


The ratio of the equal-weighted to market-cap-weighted S&P 500 stock price indexes is an interesting measure of market breadth. It is available daily since 1990 (chart). Based on this limited period, we can see that the ratio tends to rise following recessions and to peak before recessions. It bottoms just before or during recessions.
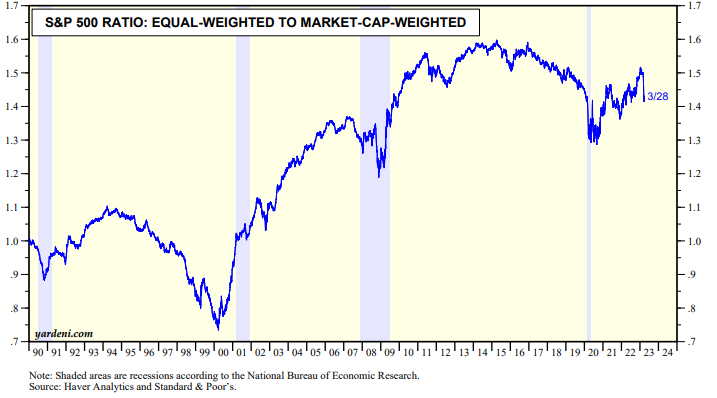
The same pattern seems to apply to this ratio during bull and bear markets (chart). This suggests that during economic recoveries when bull markets are relatively young, more and more stocks participate to the upside. Once the bull market has aged, fewer stocks participate and/or a relatively small number of large cap stocks tend to lead the market higher.
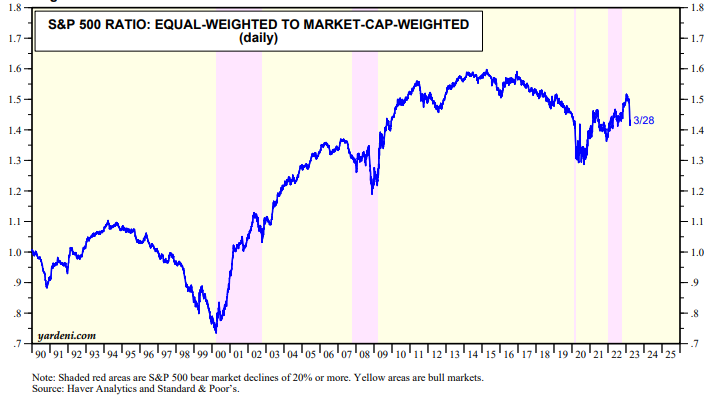
In any event the recent drop in the ratio has been triggered by the banking crisis, which started on March 10 when Silicon Valley Bank was seized by the FDIC. Investors dumped Financial stocks, but they rotated toward the MegaCap-8 stocks. They didn't bail out of the market entirely as happened during the Great Financial Crisis. That could still happen if the current banking crisis isn't contained. We think it will be by the actions taken by the Fed and the FDIC so far. If necessary, they can do more to avert a financial contagion. We still think the the bear market bottomed on October 12, 2022.