On a regular basis, we like to check on the correlations among the fixed income, commodity, and foreign currency markets. Here are a few of our observations:
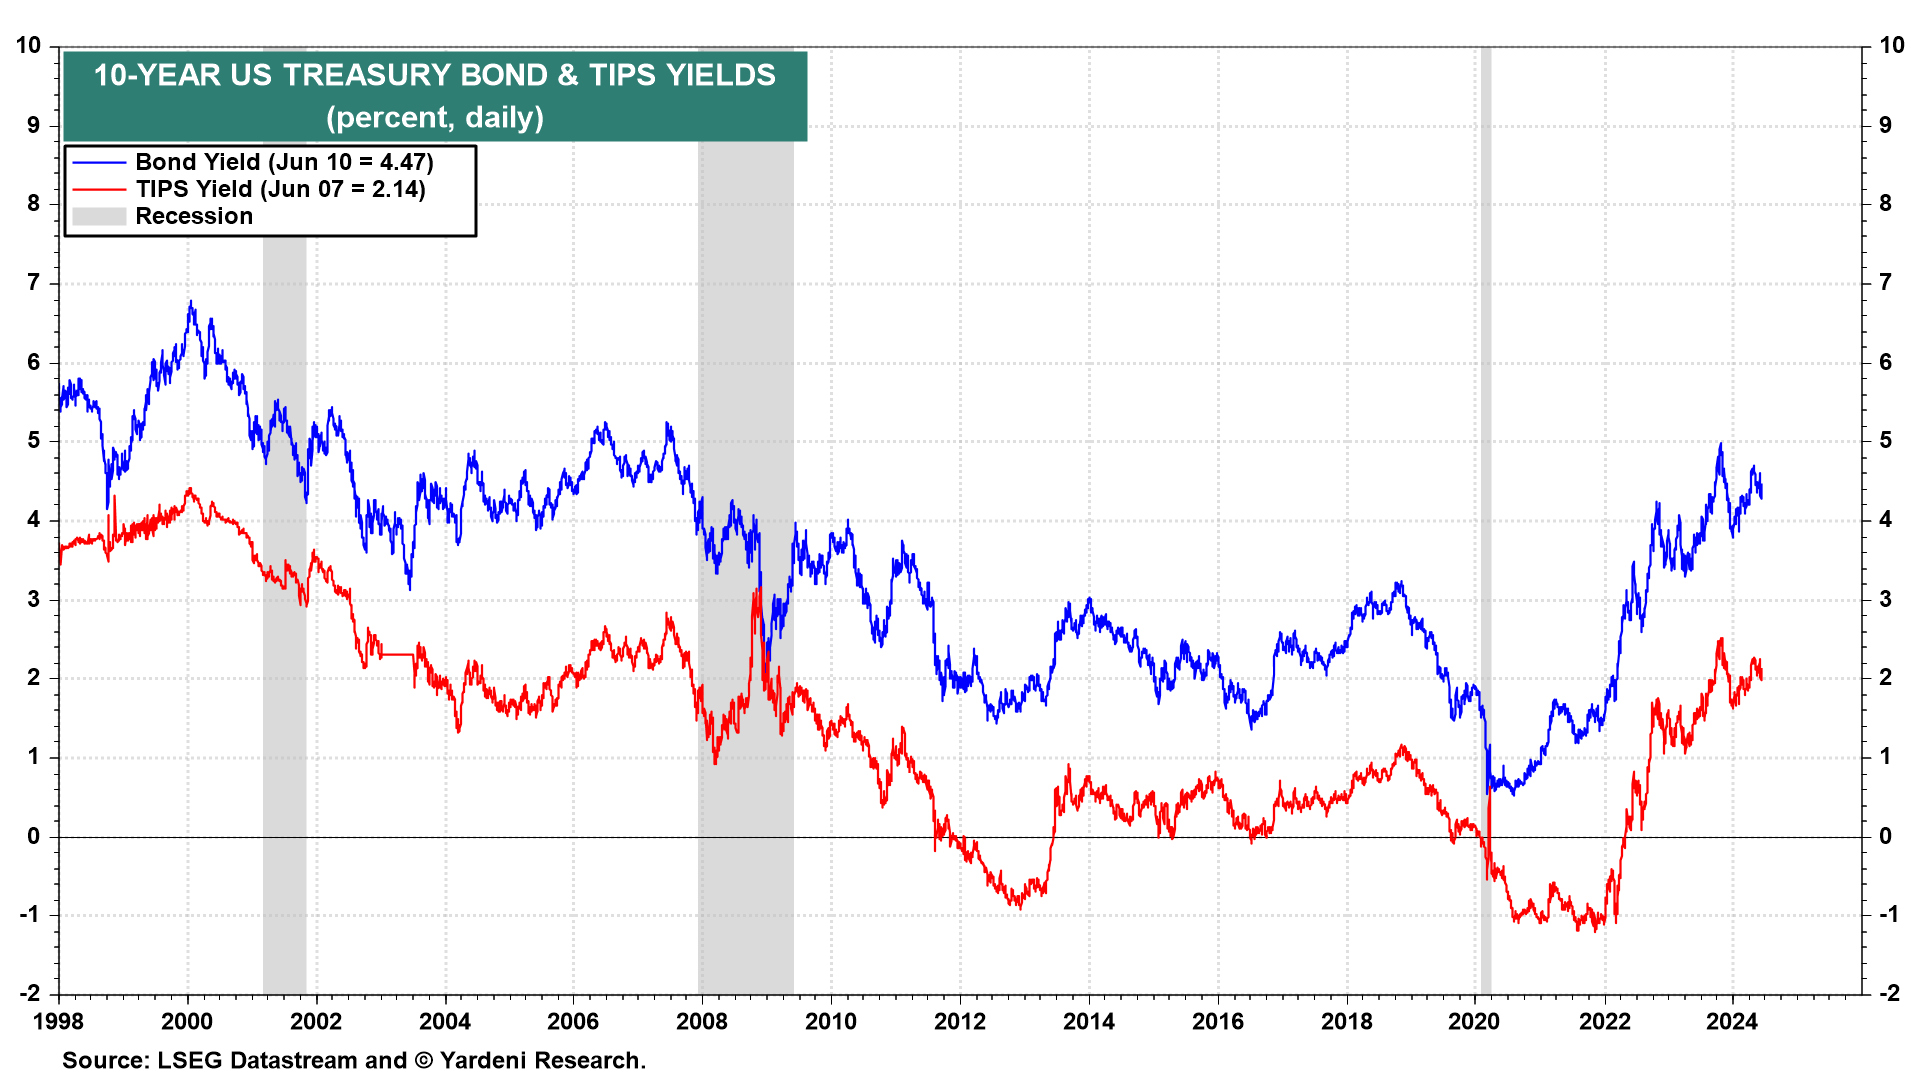
(1) Bonds. The 10-year US Treasury bond yield has normalized, fluctuating in a range roughly between 4.00% and 5.00% (chart). That's where it traded for a few years prior to the Great Financial Crisis. The same can be said about the 10-year TIPS yield. It has been fluctuating around 2.00% since late last year. It did the same for a few years prior to the GFC.
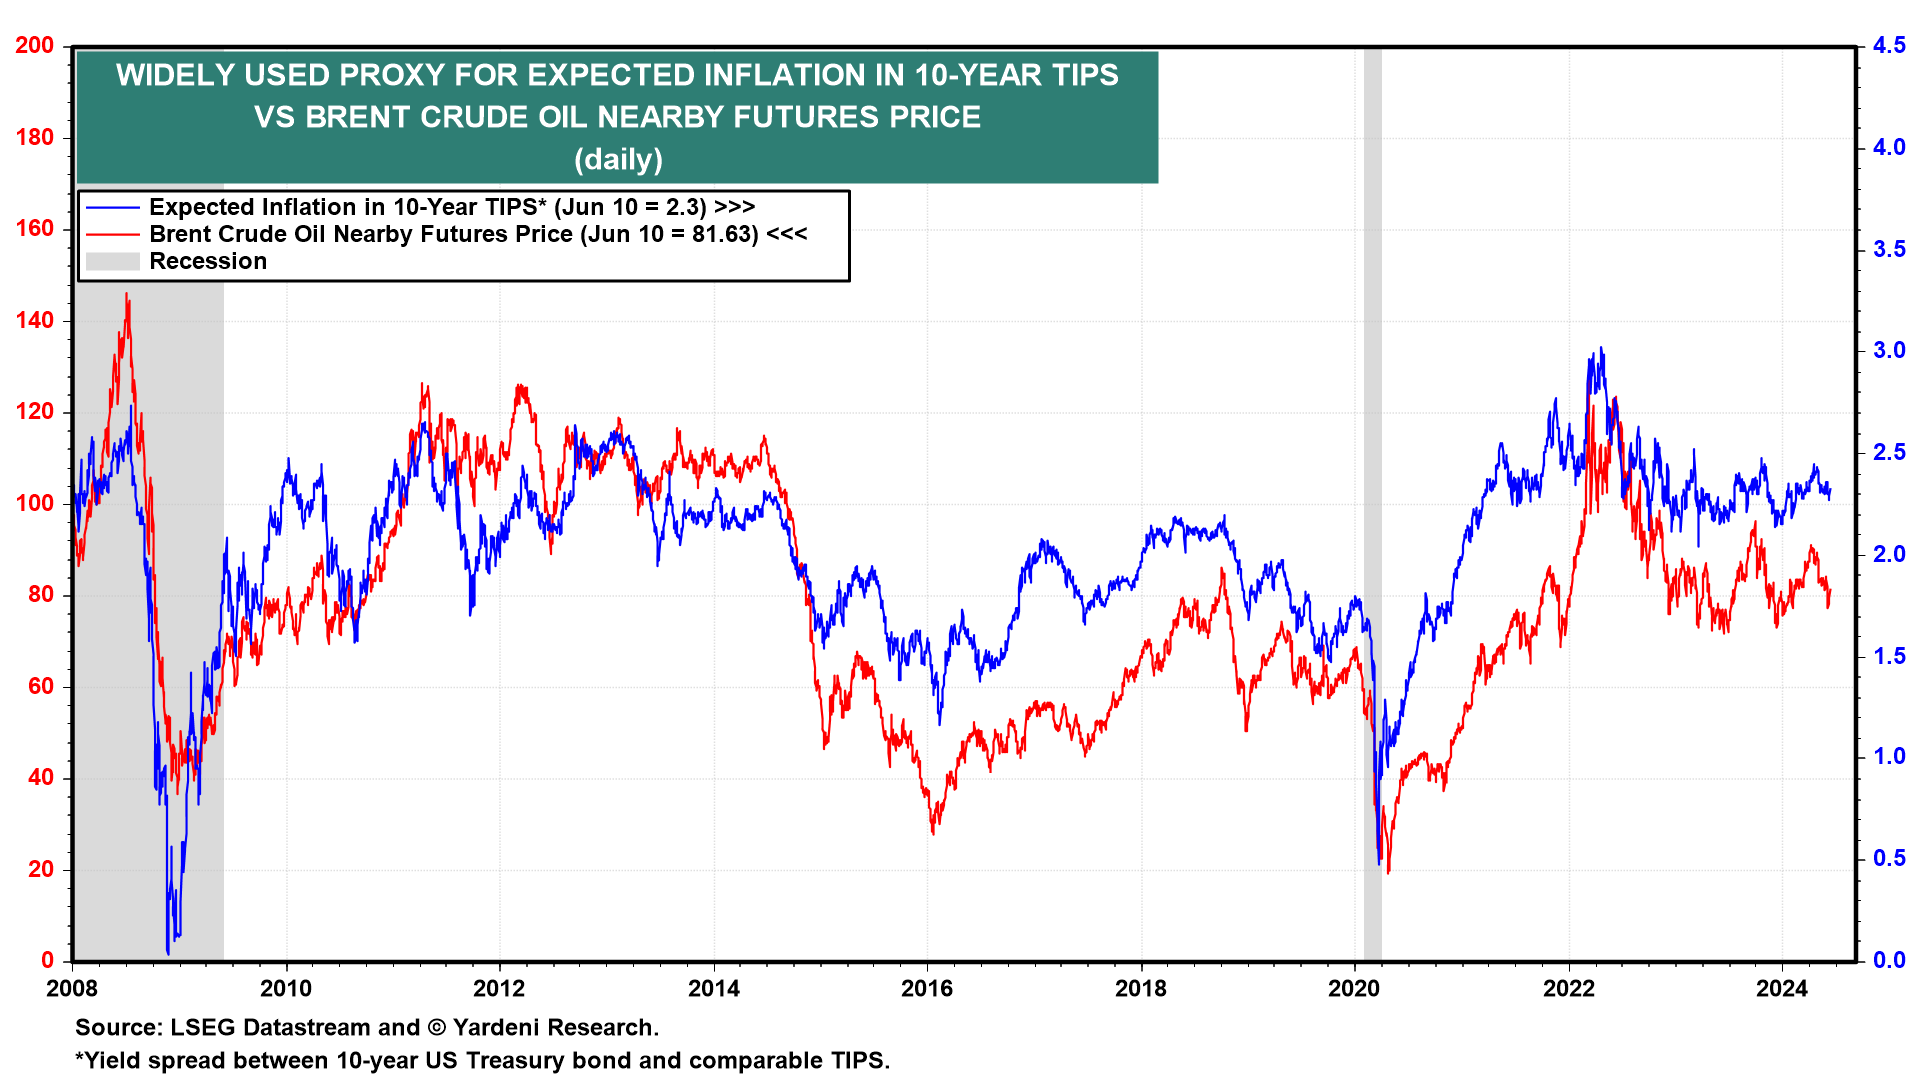
(2) Crude oil. The yield spread between the 10-year nominal and TIPS bonds is widely considered to be a proxy for the bond market's 10-year outlook for expected inflation. In fact, it is very highly correlated with the price of a barrel of Brent crude oil, which can have a significant impact on the inflation rate (chart).
If global economic activity remains lackluster, then the price of oil should remain subdued, and so should the expected inflation proxy. That would support our forecast that the nominal bond yield may remain in its current range for a while.
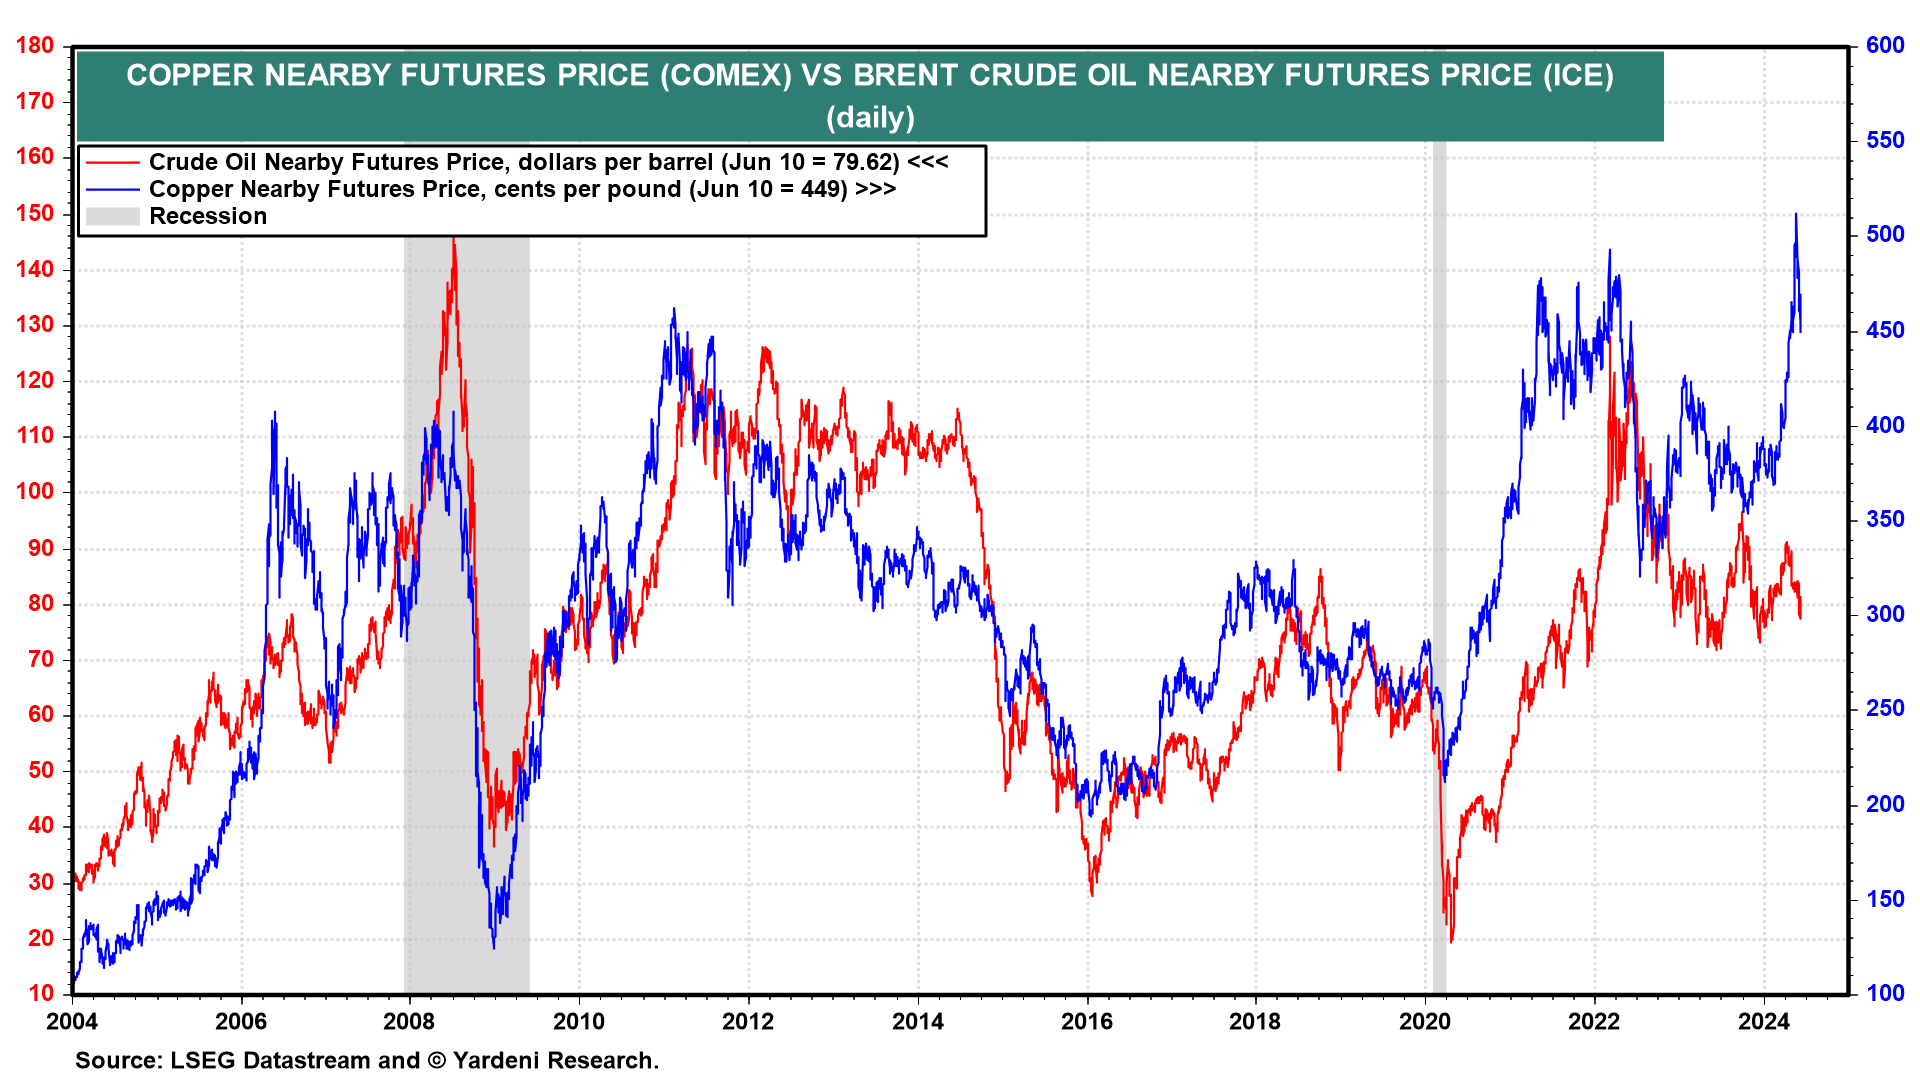
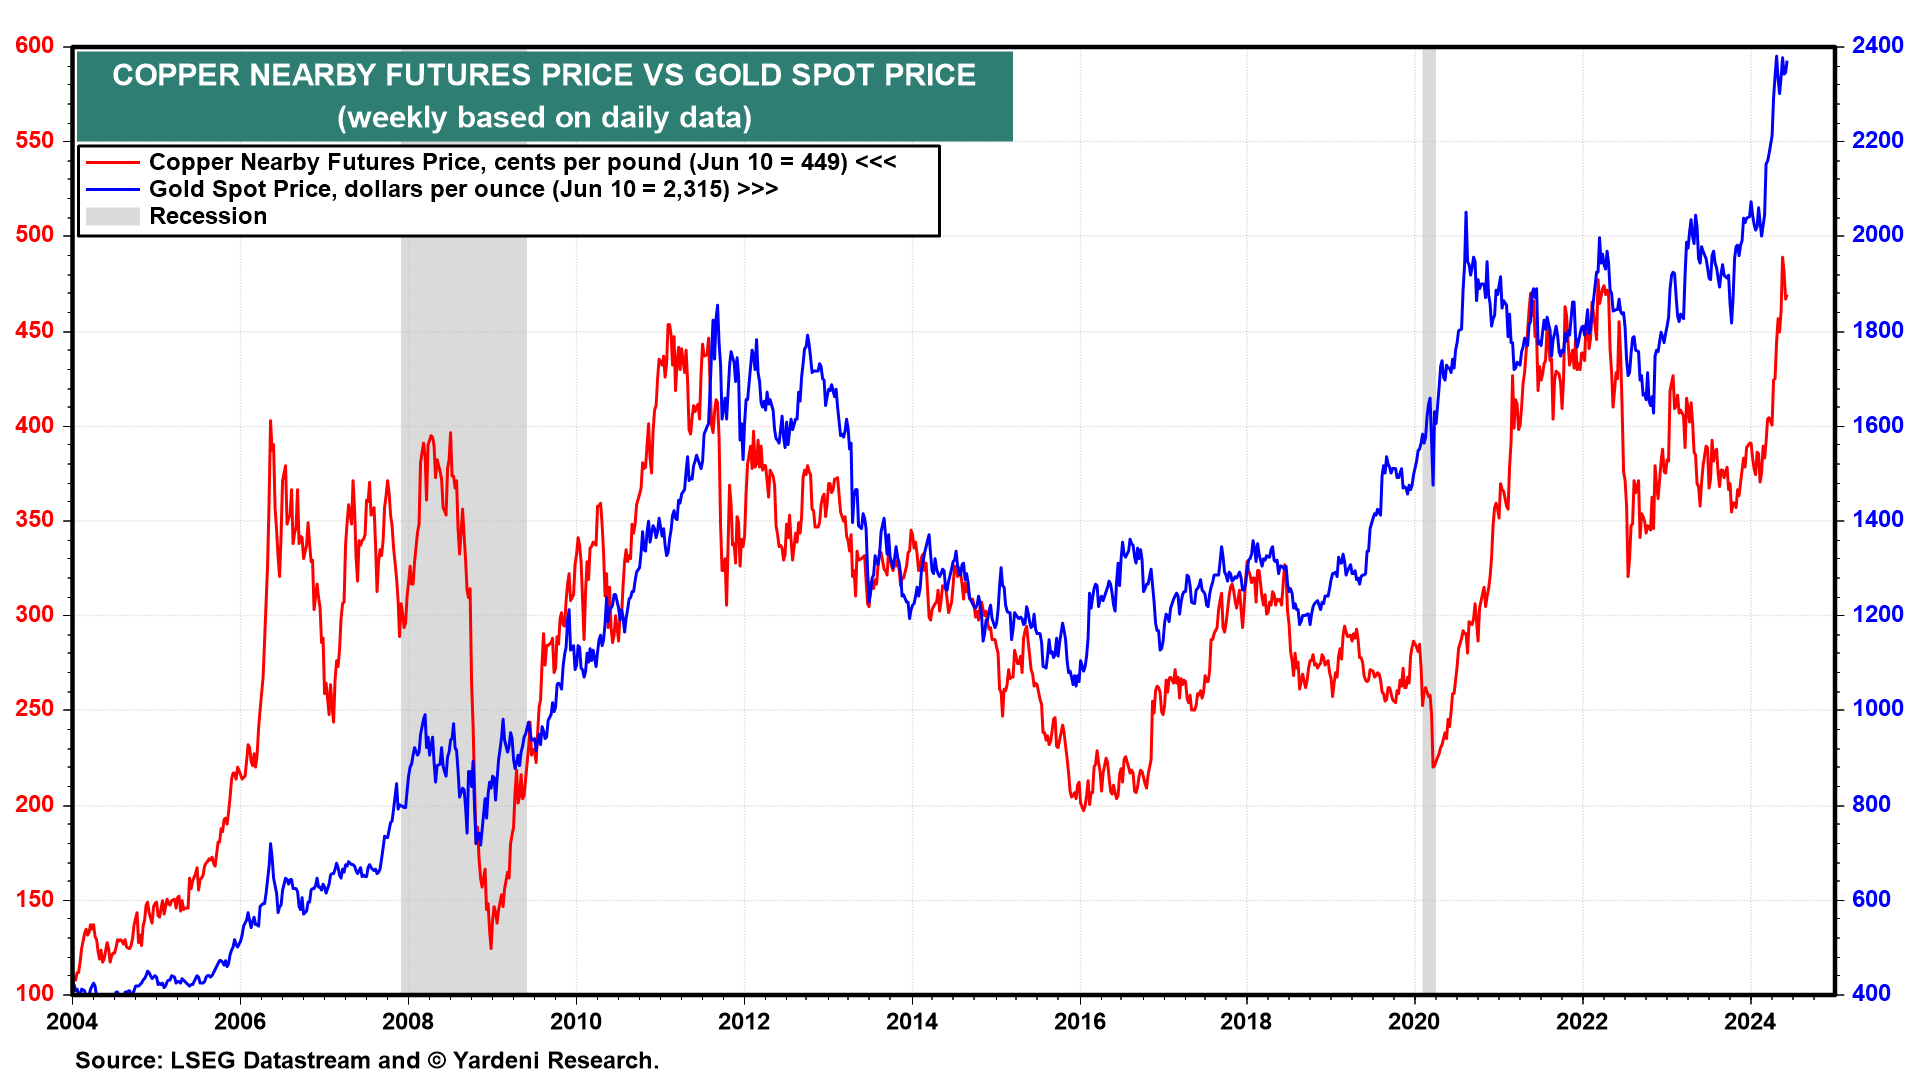
(3) Copper. The price of a barrel of Brent and a pound of copper have also been highly correlated (chart). The latter has a tendency to lead the former. Both prices reflect the strength or weakness of global economic activity. The recent surge in the price of copper didn't make much sense to us since it wasn't confirmed by the price of oil, which has been weak lately, consistent with our view that global economic activity is sluggish.
The recent jump in the price of copper was widely interpreted as a sign that the awesome demand for electricity by AI data centers would cause the demand for copper to soar. A simpler explanation is that there might have been a temporary short squeeze on the red metal.
(4) Gold. The price of gold is also highly correlated with the price of copper (chart). Bloomberg reported that China's central bank stopped buying gold last month, ending a massive buying program that ran for 18 months. The central bank is expected to resume purchases.
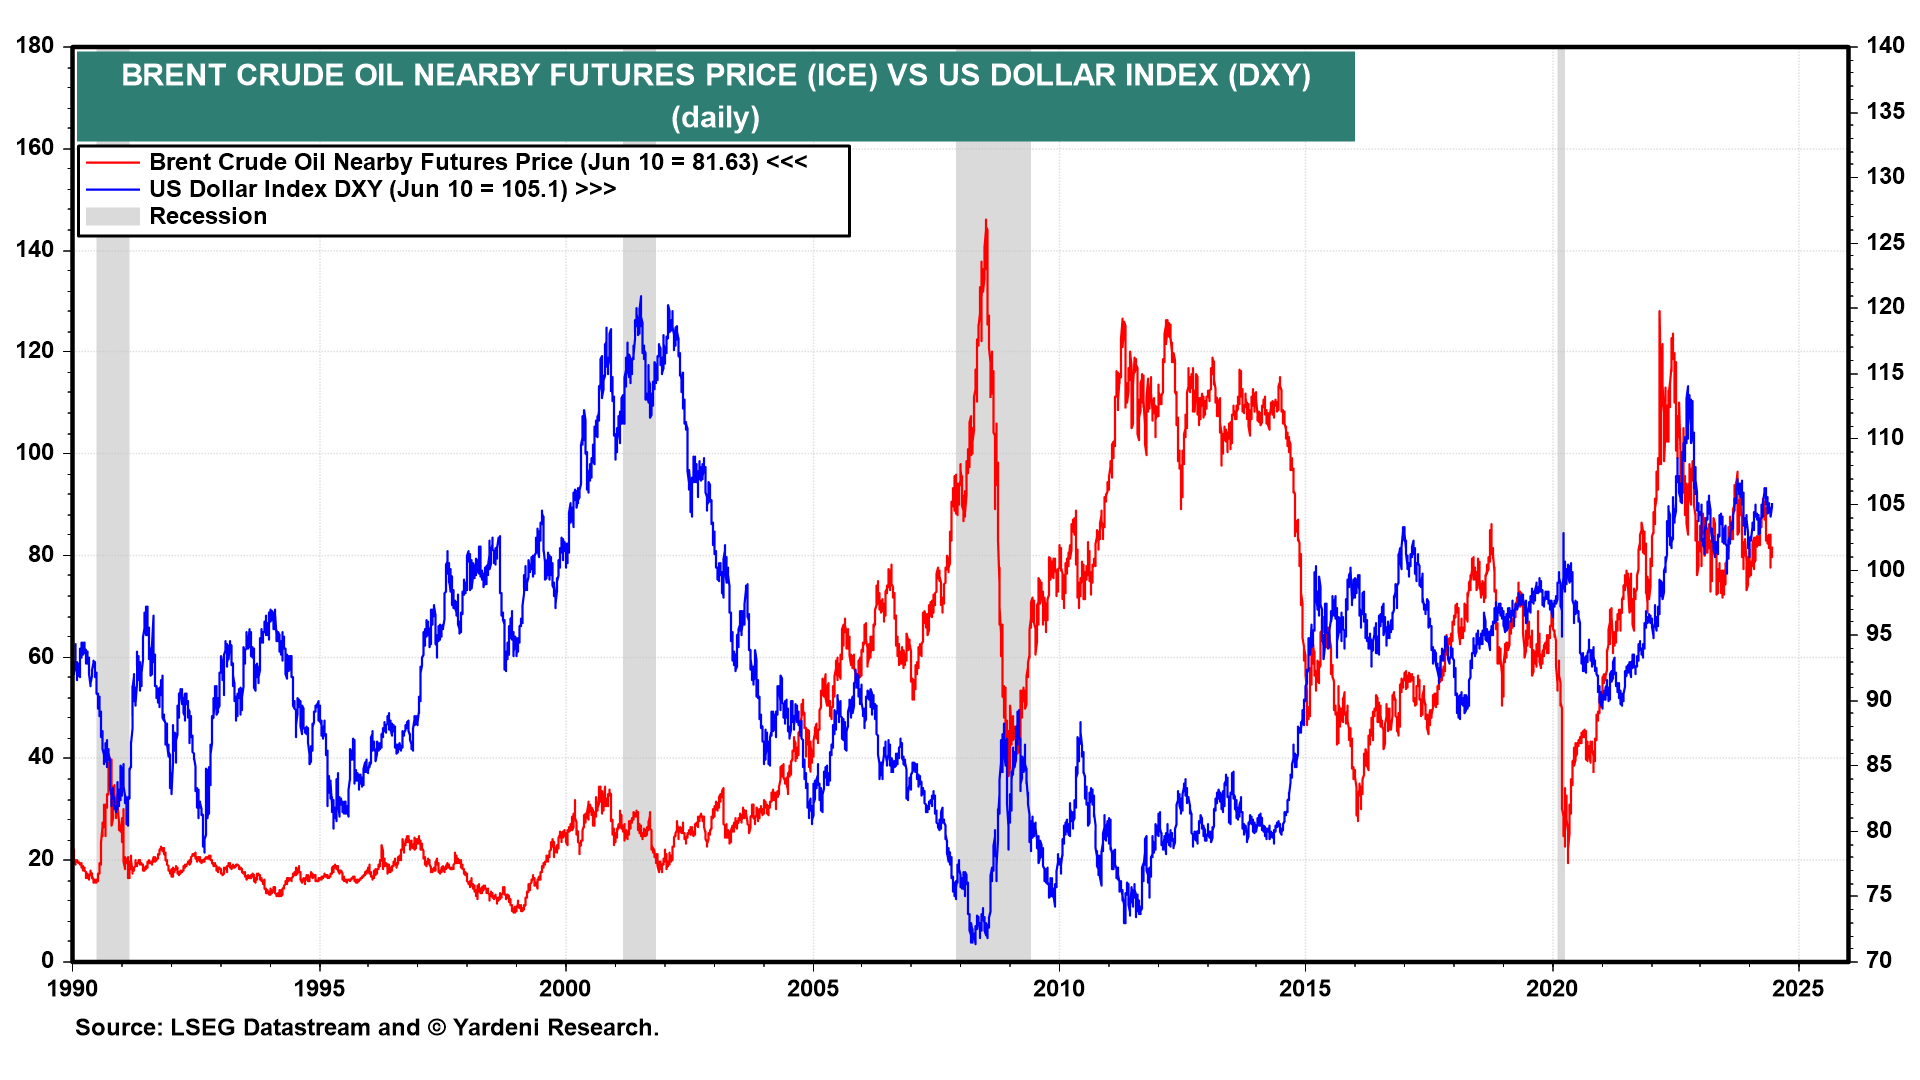
(5) Dollar index (DXY). In the past, DXY was negatively correlated with the price of a barrel of Brent crude oil (chart). More recently, the two have been positively correlated. It may be that as the US has become a bigger producer and exporter of oil and natural gas, the demand for dollars to pay for these US energy exports has increased.