If it turns into a bear market, it will be more reminiscent of the short-lived 1987 bear market, when earnings continued to grow because a recession didn’t occur, as was feared at the time. If a recession does occur because the Fed and/or the Bond Vigilantes cause it to bring inflation down, the bear market could be similar to the ones in the early 1980s. We are still forecasting a 30% chance of a 2022 recession at this time.
Here are a few more stats on this selloff:
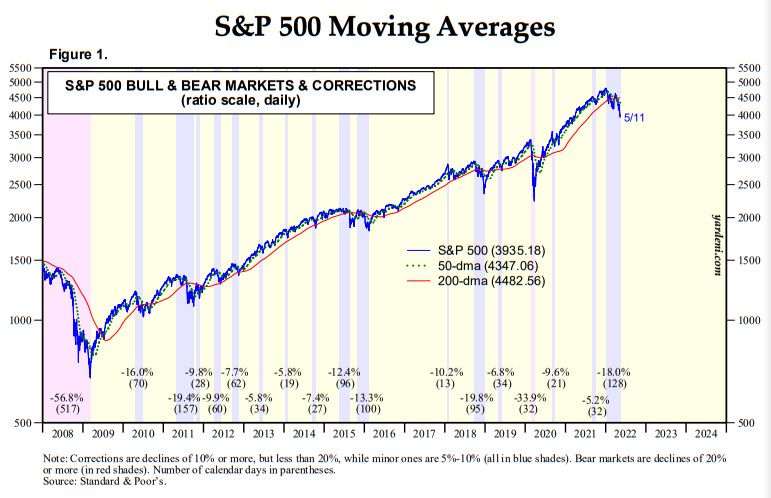
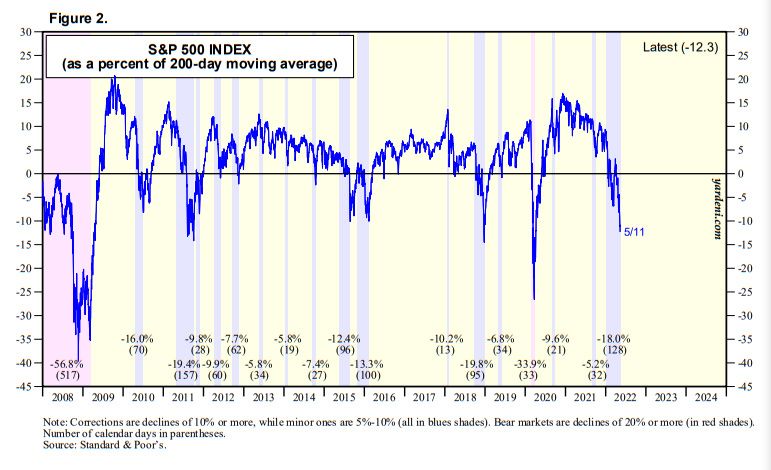
(1) The S&P 500 stock price index is 12.3% below its 200-day moving average. That’s comparable to what happened during the previous corrections since 2009, and suggests that the market is oversold if recession fears abate.
(2) Back on Christmas Eve, December 24, 2018, the forward P/E of the S&P 500 bottomed at 13.5. Currently, the market is still looking for a bottom. The S&P 500’s forward P/E is down to 16.7 from 17.5 on Friday. We are still looking for a bounce, if not a bottom at 16.0. Again, that’s assuming as we do that a recession isn’t in the cards.
(3) The S&P 500 Growth’s MegaCap-8’s total market cap is down 36% from $12.3 trillion on December 27, 2021 to $8.6 trillion now. That’s the lowest since March 26, 2020.
(4) That puts the MegaCap-8’s forward P/E at 23.6, down from 25.4 on Friday and the lowest since 23.6 the week of April 3, 2020. At a forward P/E of 16.0, lots of stocks would be even cheaper.