


We are sure that Fed Chair Jerome Powell has recently reread former Fed-Chair Alan Greenspan's December 5, 1996 speech in which he famously asked: "But how do we know when irrational exuberance has unduly escalated asset values, which then become subject to unexpected and prolonged contractions as they have in Japan over the past decade? And how do we factor that assessment into monetary policy?"
How can we spot a stock market meltup this time? Might Powell & Co. choose not to lower the federal funds rate at all if they conclude that a 1990s-style stock market bubble is inflating? We don't know for sure, but we suspect that we might find out this year. Here are a few preliminary possible indicators of a meltup:
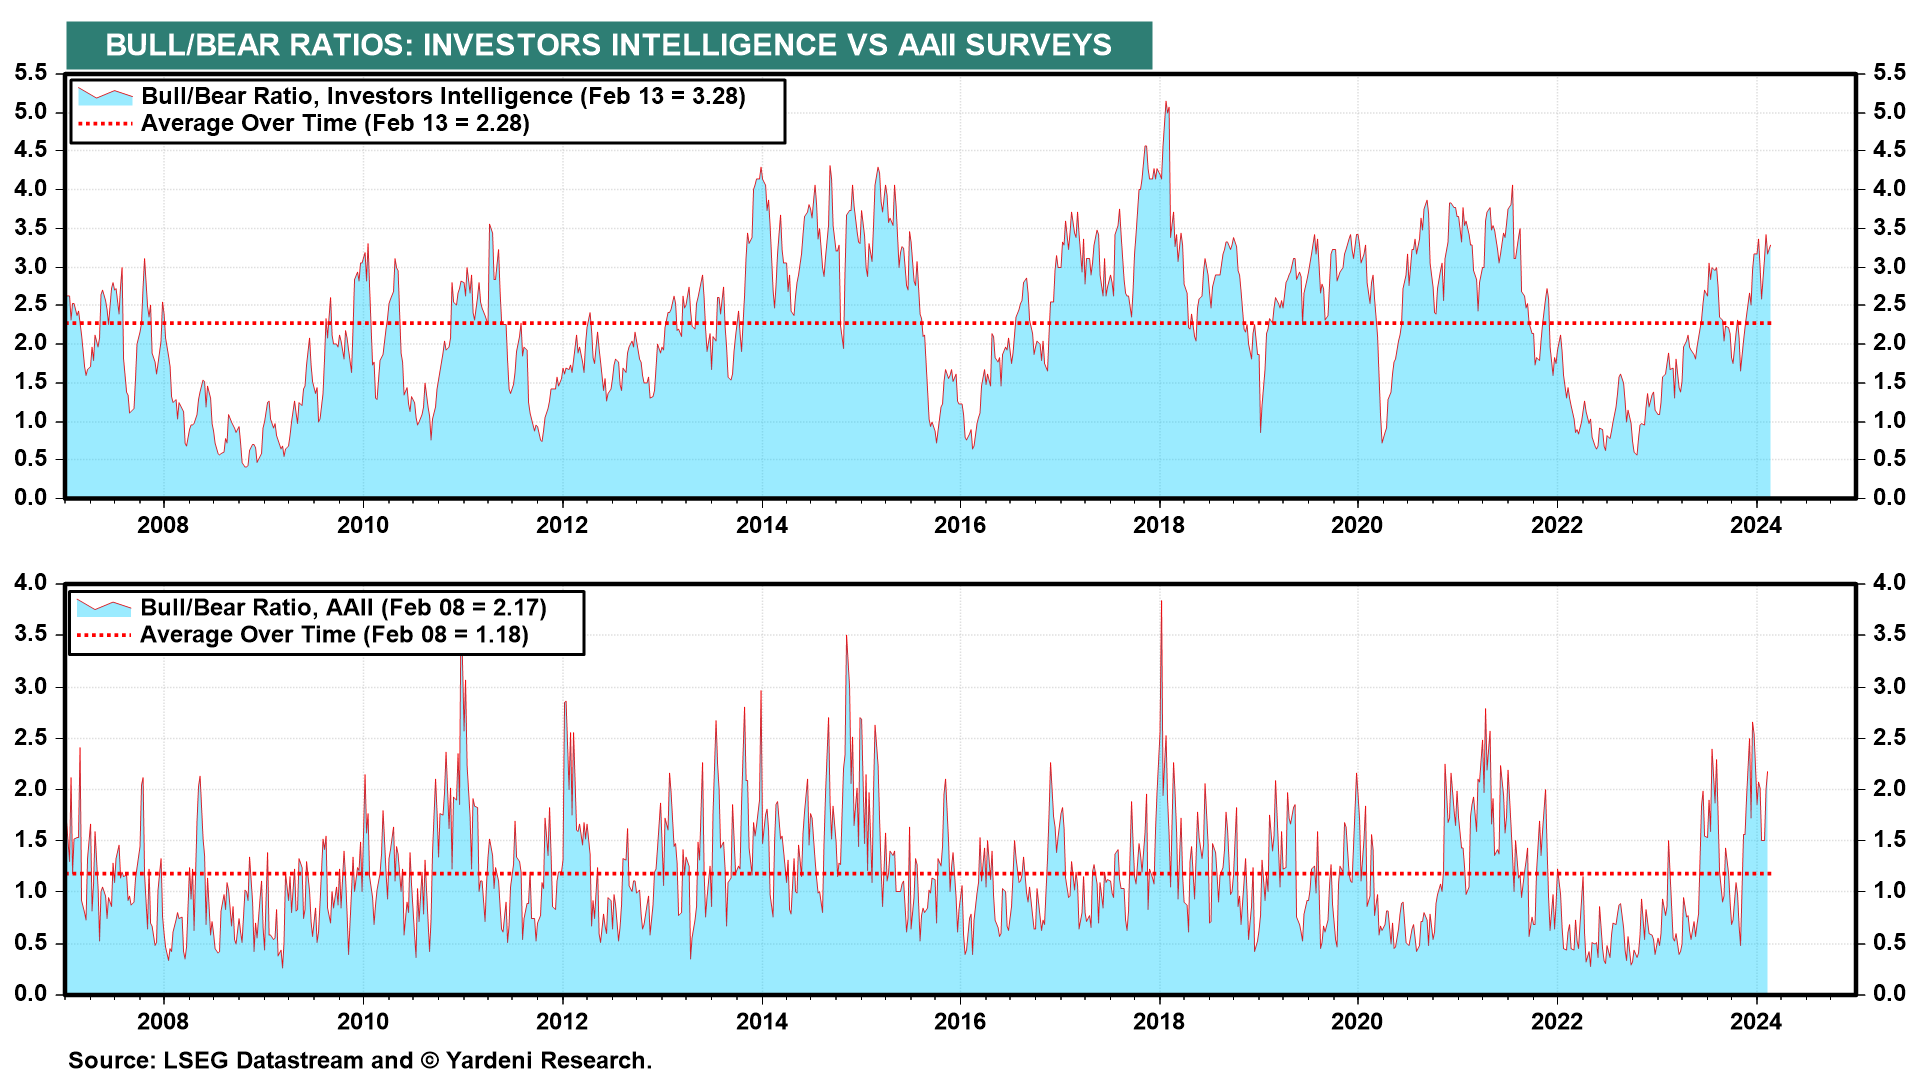
(1) We might be in a meltup, if the S&P 500 and Nasdaq 100 continue to make new record highs despite overly bullish readings of the Bull/Bear Ratios (chart).
(2) We might be in a meltup, if the major stock market averages continue to make new record highs despite relatively low readings of the Put/Call Ratio, signaling too much bullishness (chart).