


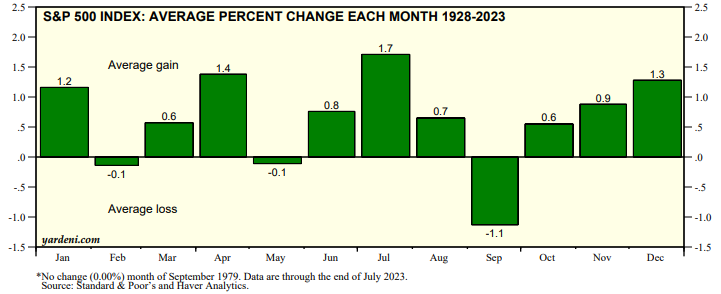
July was hotter than usual. We aren't referring to the weather but rather to the 3.1% increase in the S&P 500. That compares to an average increase of 1.7% for the month since 1928, with an average gain of 4.9% for the 58 up years and an average 3.2% loss during the 38 down years (chart). So it is fair to say that we've already had a nice summer rally. It is also fair to say that following the adage about going away in May would have been a mistake so far this year. On the other hand, the year after a mid-term election is once again proving to be a bullish one. August starts tomorrow and the month has seen a modest average gain of 0.7% since 1928.
This year, we've favored overweighting Information Technology, Industrials, Financials, Energy, and Materials betting that the most widely anticipated recession of all times would continue to be a no-show this year. So far, so good as reflected in the performance of the S&P sectors.
Here is the ytd performance derby of the 11 sectors of the S&P 500: Information Technology (45.8%), Communication Services (44.7), Consumer Discretionary (35.5), S&P 500 (19.5), Industrials (12.3), Materials (10.2), Financials (3.1), Real Estate (3.1), Consumer Staples (1.9), Energy (-0.5), Health Care (-1.5), and Utilities (-5.0) (chart).