Today's Composite Economic Indicators, compiled by the Conference Board, are pointing in different directions. The Index of Leading Economic Indicators (LEI) fell in April for the 13th straight month, sinking 0.6% m/m and 8.6% over the period to the lowest level since September 2020 (chart). The LEI, which peaked at a record high last February, has led recessions by 12 months on average.
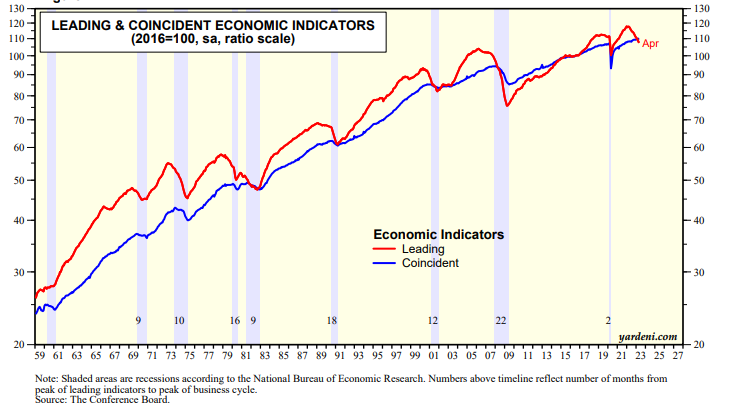
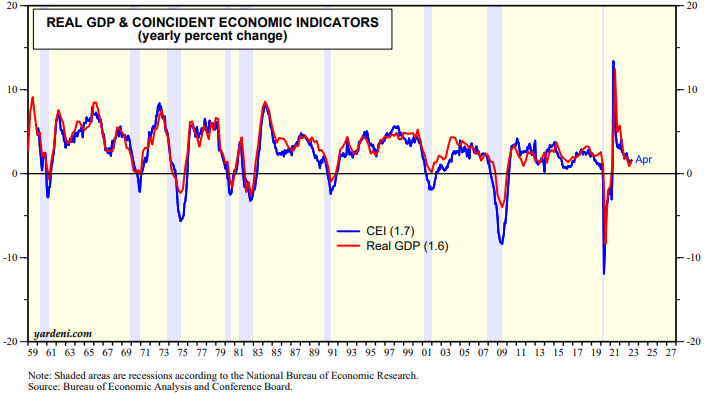
While the LEI continues to predict a recession, the US economy continues to expand, with the Index of Coincident Economic Indicators (CEI) reaching yet another record high in April. The CEI has only posted one decline in the past 10 months, climbing 0.3% in April and 1.7% y/y (chart). It exceeds its previous record high, just before the pandemic, by 2.7%. All four components of the CEI rose once again in April. The y/y growth rate of the CEI closely tracks the comparable growth rate of real GDP (chart).
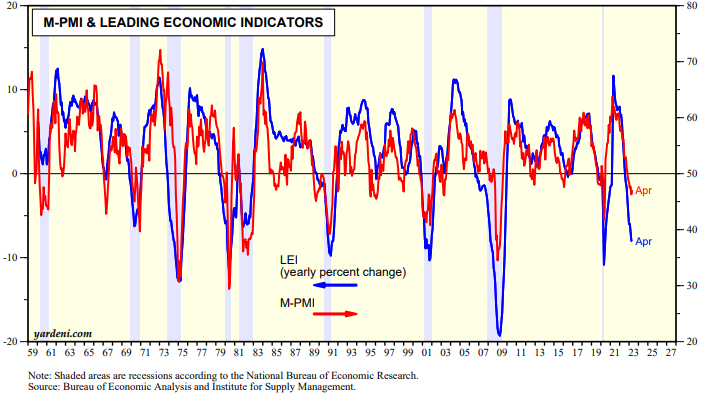
We've previously observed that the LEI tends to give heavier weight to the manufacturing side of the economy without recognizing the increasing importance of services. Its y/y growth rate closely tracks the manufacturing purchasing managers index (chart). The goods side of the economy has been weak since mid-2022 when consumers pivoted from buying goods to spending more on services.