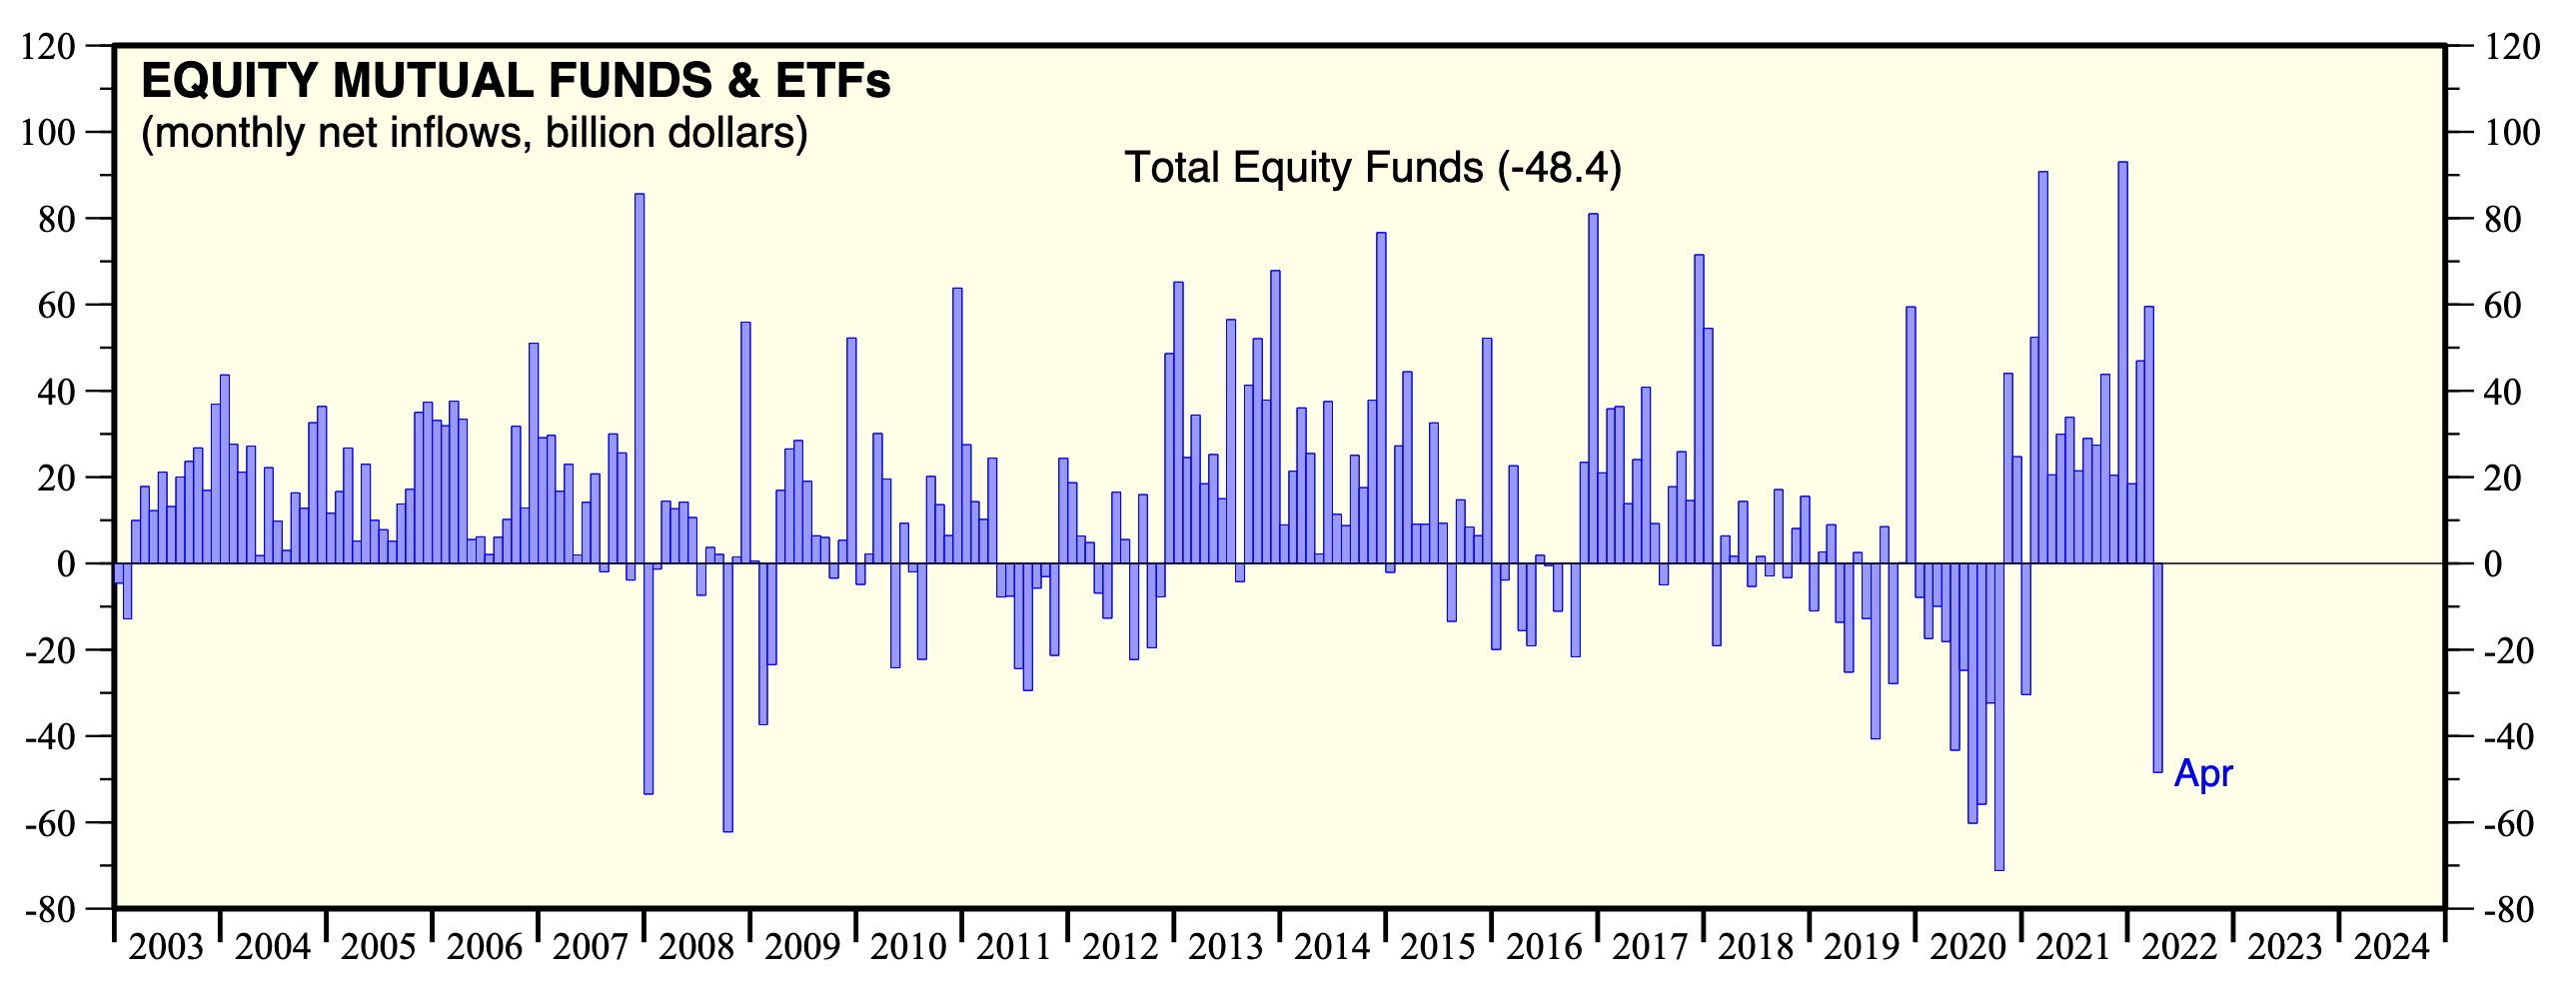
The stock market’s been dropping, but who is selling stocks? Is the stock market so illiquid that just $48.4 billion in net outflows from equity mutual funds and exchange-traded funds (ETFs) during April caused April’s steep 8.8% drop in the S&P 500? The S&P 500 also fell sharply during the first three months of this year, by 4.9%, but there were substantial net inflows back then. Obviously, equity fund flows aren’t especially useful for understanding what’s driving the stock market. Nevertheless, they may provide some insights. Consider the following:
(1) Last year’s climb to record highs in the S&P 500 was fueled by large net inflows into equity ETFs more than offsetting net outflows from equity mutual funds. The move from active management (i.e., as mutual funds represent) to passive management (ETFs) must have boosted the valuation multiples of the MegaCap-8 stocks. (The MegaCap-8 are eight very-high-capitalization tech-related companies in the S&P 500’s Growth index—namely, Alphabet, Amazon, Apple, Meta, Microsoft, Netflix, Nvidia, and Tesla.)
(2) Yet this year, the valuation multiples of these eight stocks have been crushed, while net inflows into ETFs remained positive for the first three months of the year.
(3) Of course, there are other flows in and out of equities. For example, the US Treasury’s TICS data show that net foreign selling of US equities during the first three months of this year totaled $160.0 billion. For perspective, foreigners purchased a whopping $695.6 billion in 2020 and $51.7 billion in 2021. So the recent selloff might largely represent profit-taking by foreign investors, particularly in the MegaCap-8 stocks.