Some widely followed technical and sentiment indicators suggest that the stock market is oversold and due for a rally. Consider the following:
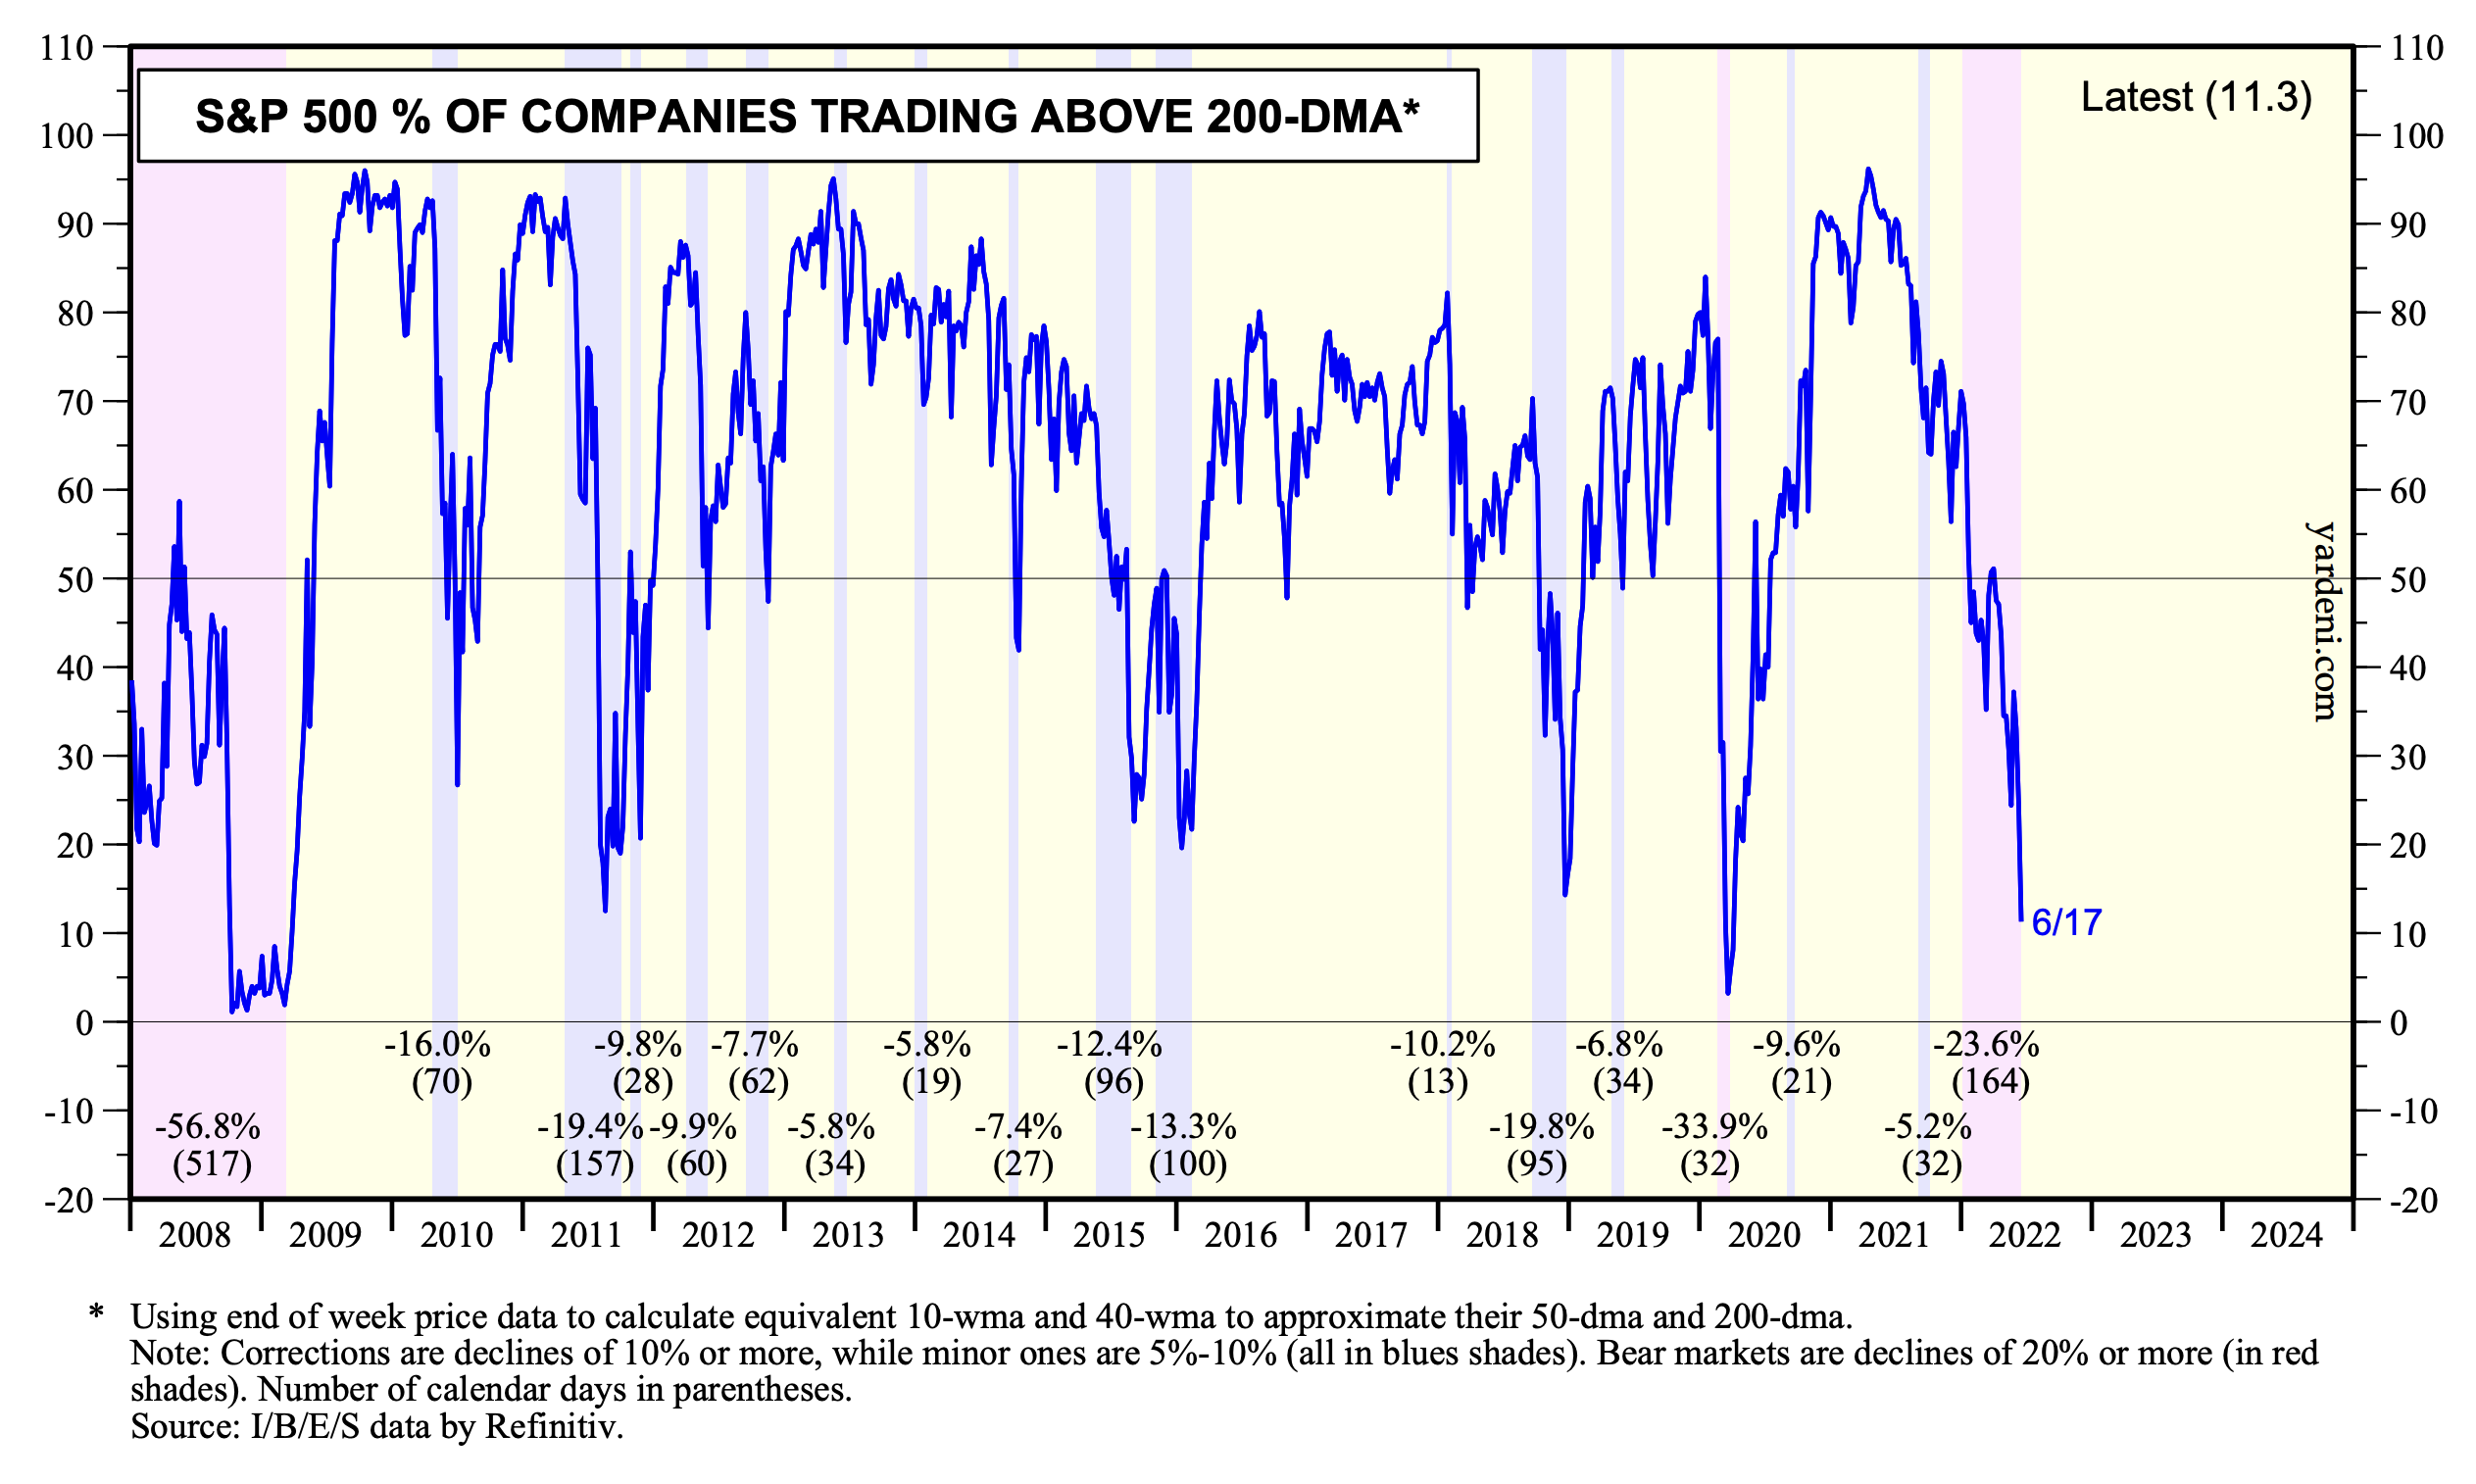
(1) The S&P 500 was extremely overbought last year. Around mid-year 2021, more than 90% of the stocks in the index were trading above their 200-day moving averages (dma). There has been a significant reversal of fortune since then with only 11.3% of the S&P 500 stock prices above their 200-dmas on Friday.
(2) The S&P 500 traded 10%-15% above its 200-dma most of last year. On Friday, it was 16.9% below its 200-dma.
(3) The S&P 500's VIX has been moving higher, rising to 31.1 on Friday. It was under 20.0 earlier this year, but remains relatively subdued even though bearish sentiment in the Investors Intelligence survey of market watchers was high during the June 14 week at 42.7%.
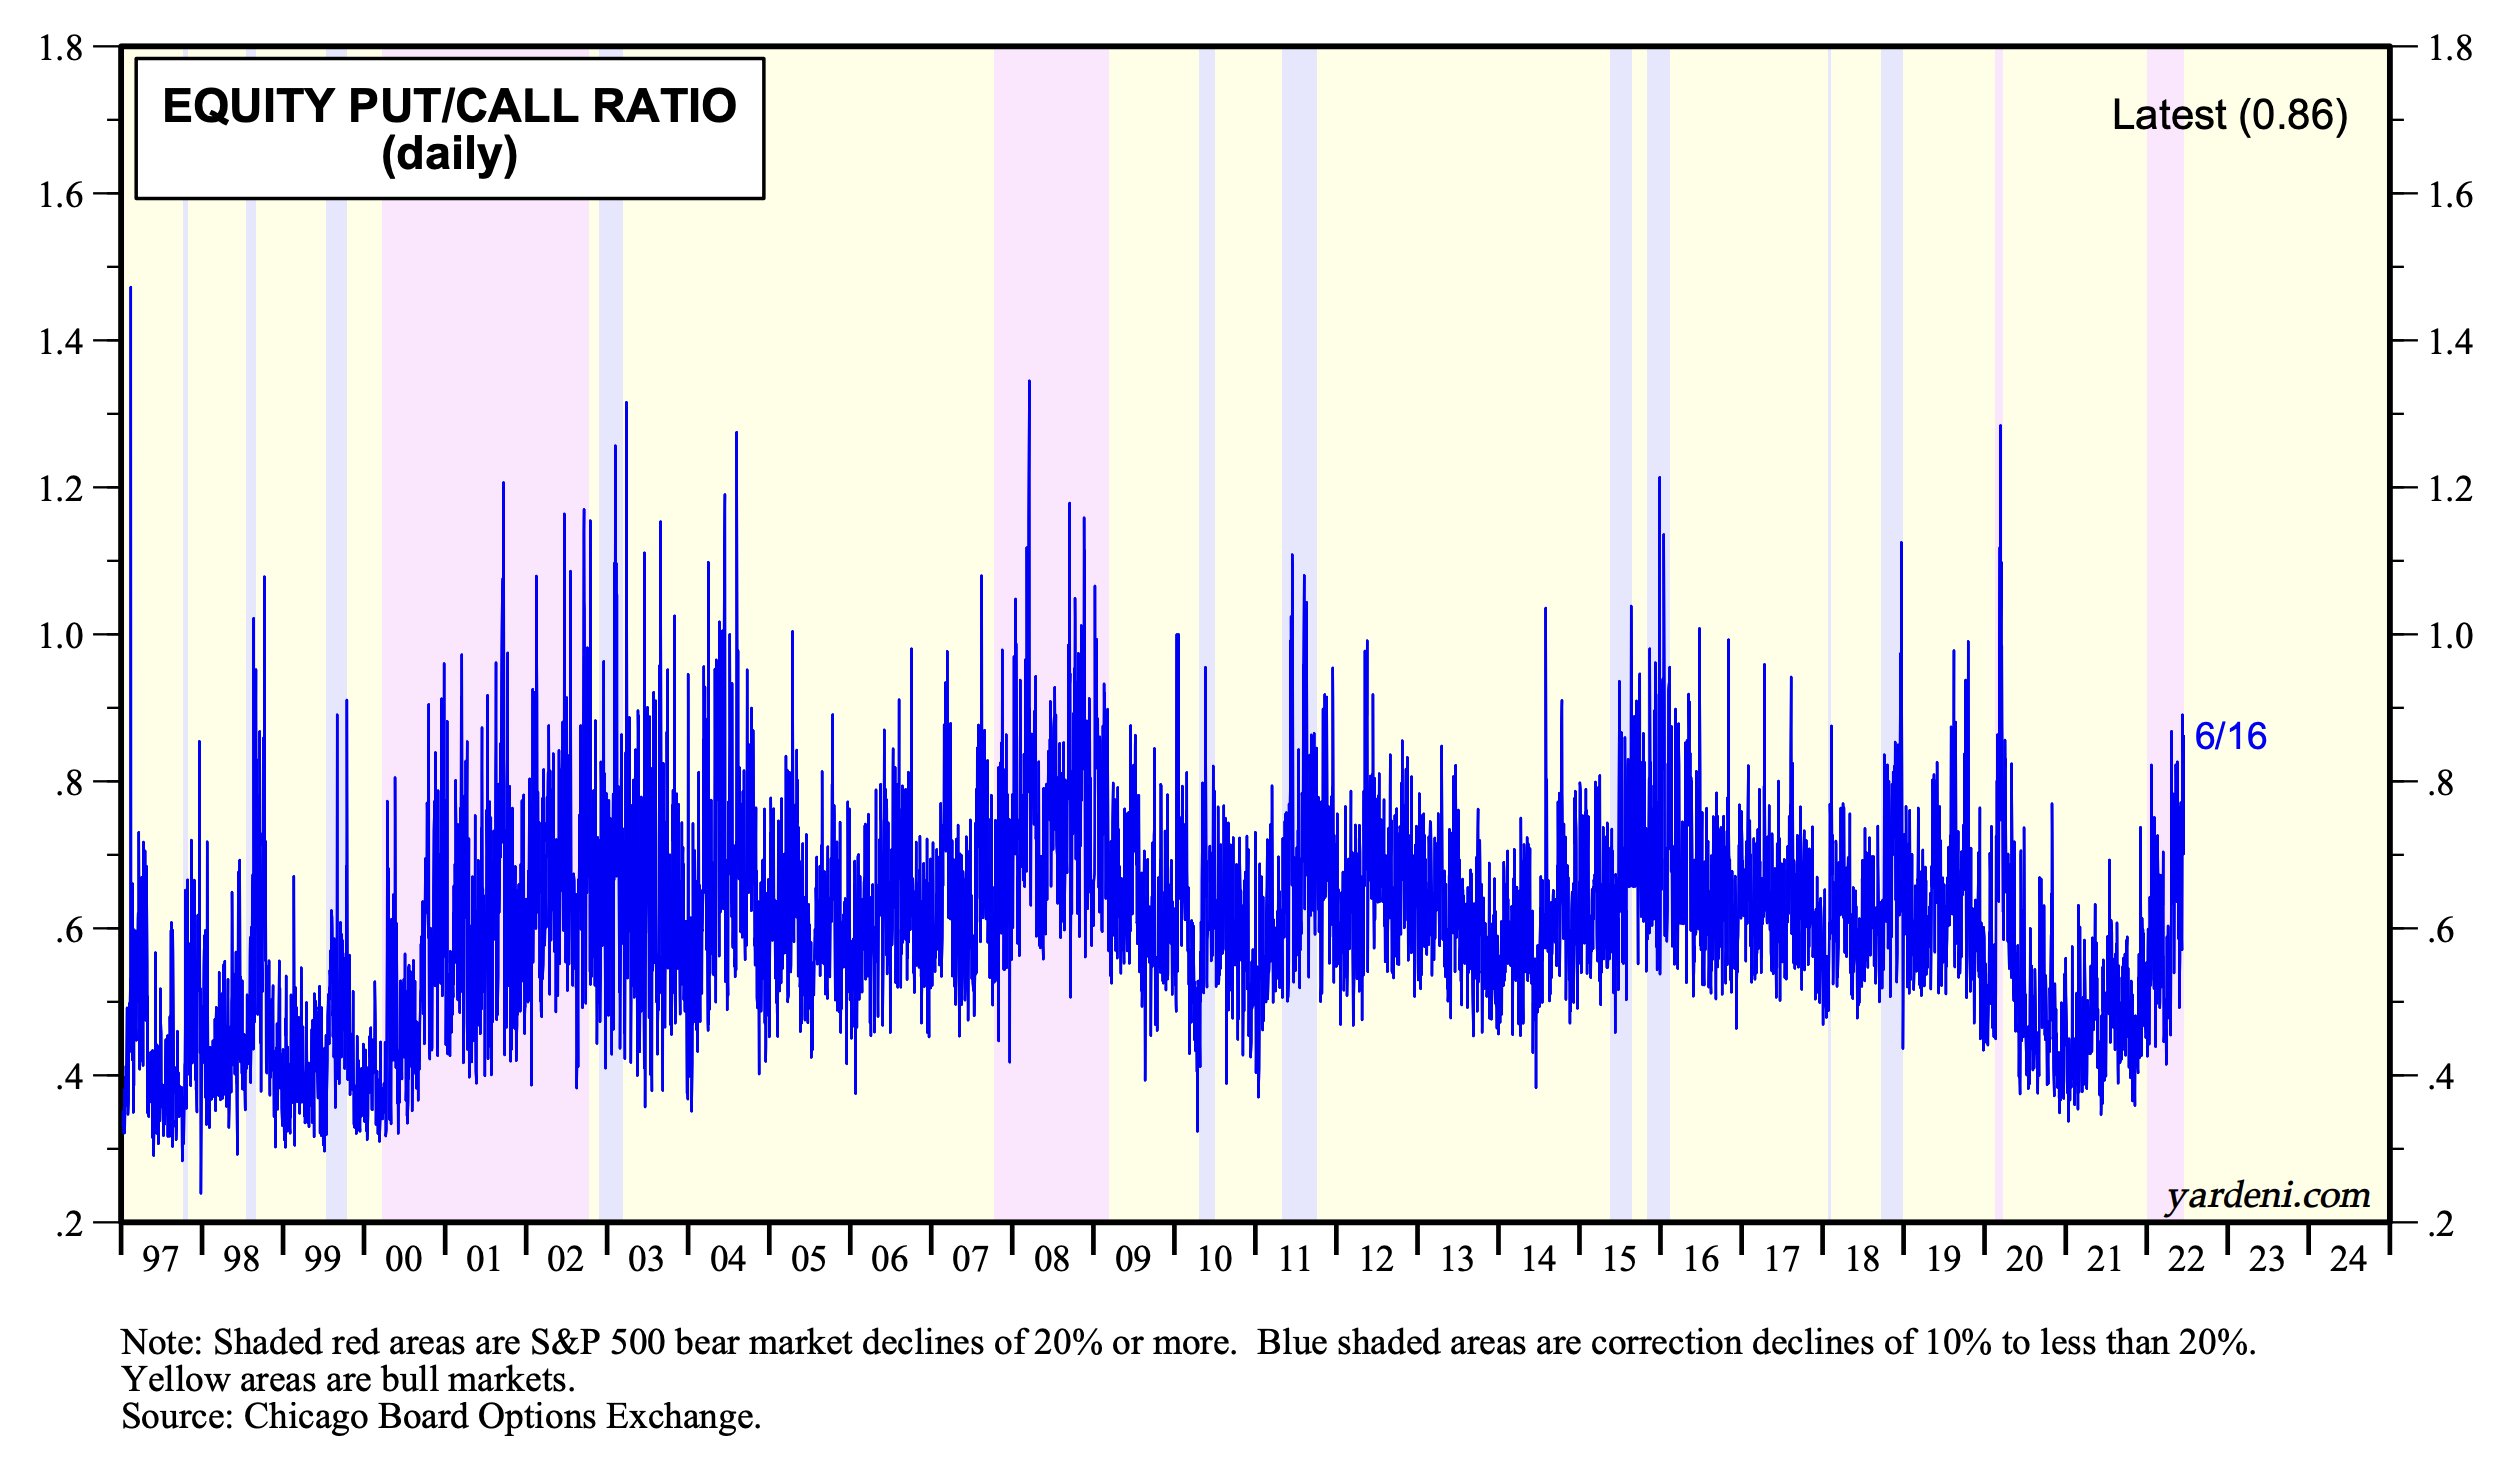
(4) The Put/Call Ratio has also been elevated in recent days in a range between 0.80 and 0.90.