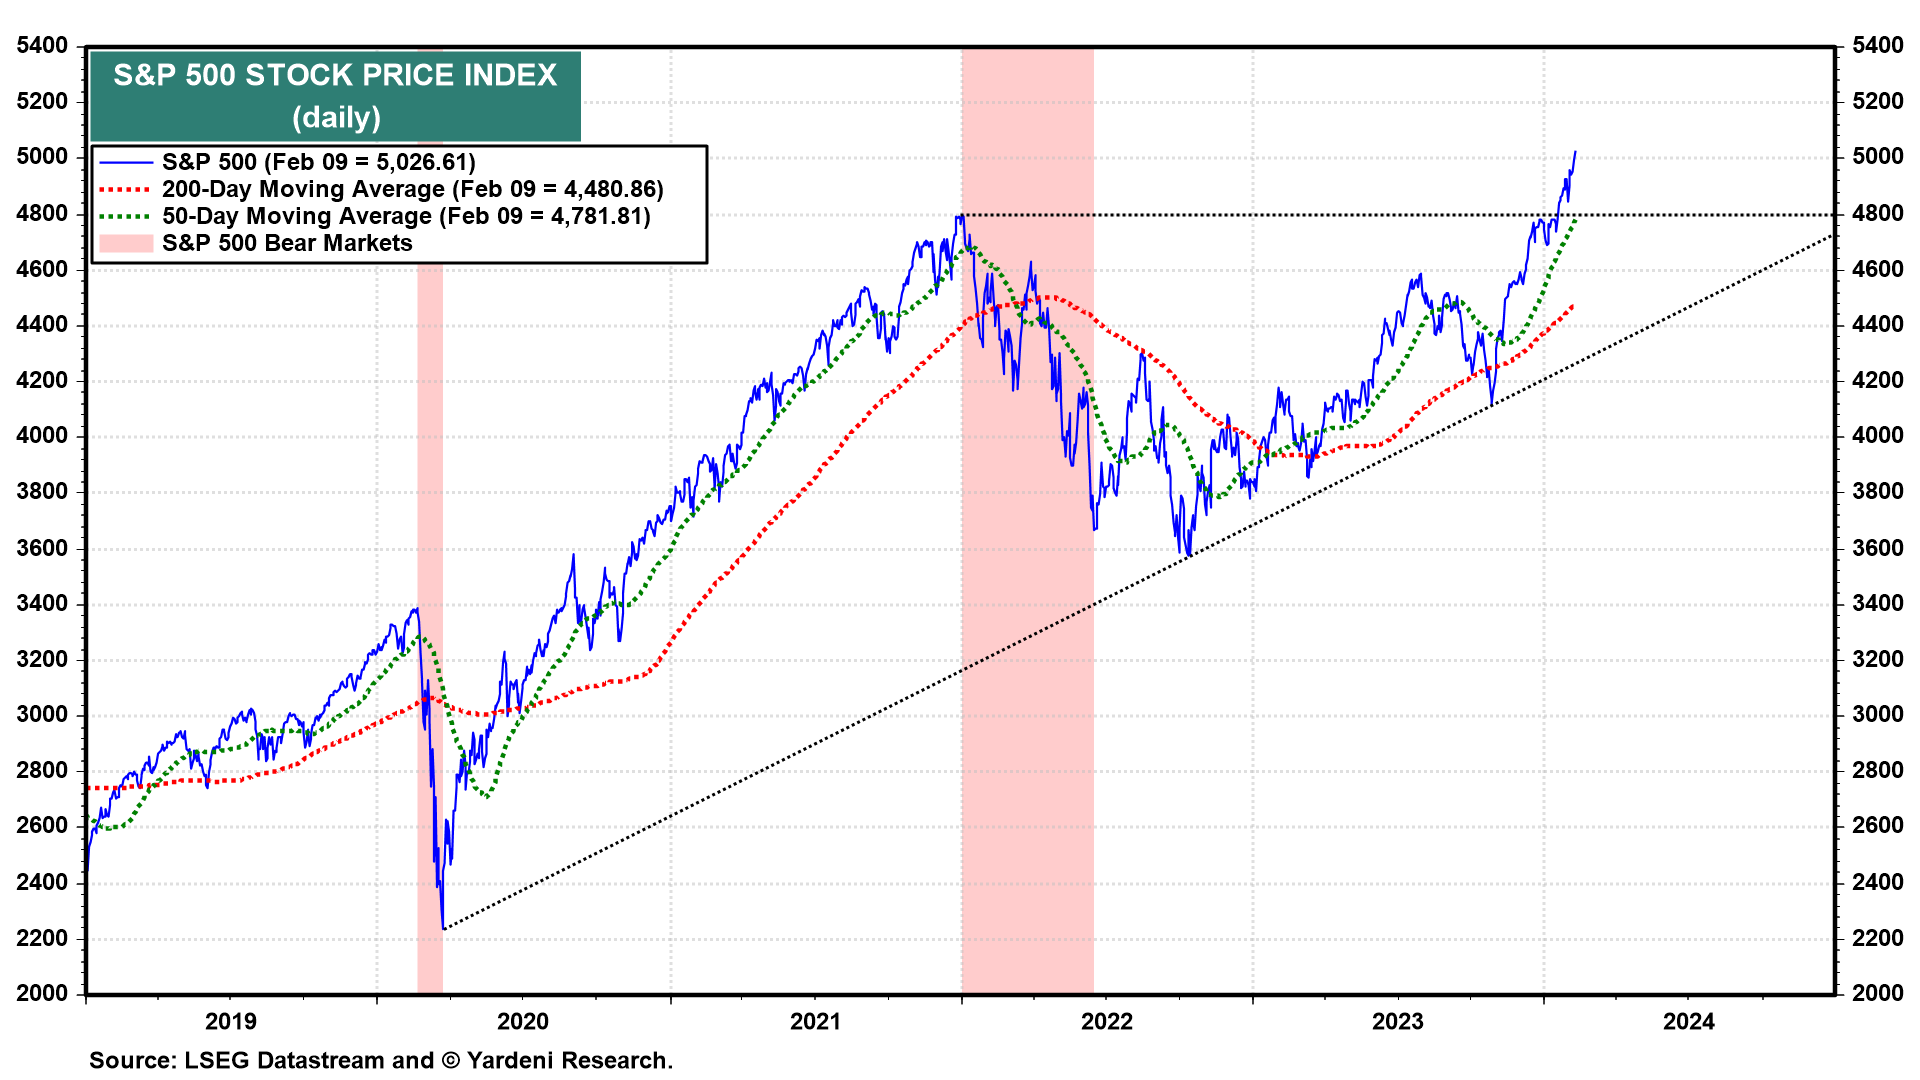
The S&P 500 is up 40.5% since the start of the current bull market on October 12, 2022 (chart). Along the way, there was a 10.3% correction from July 31 to October 27, 2023. Since then, it has been a 22.1% meltup through Friday’s close.
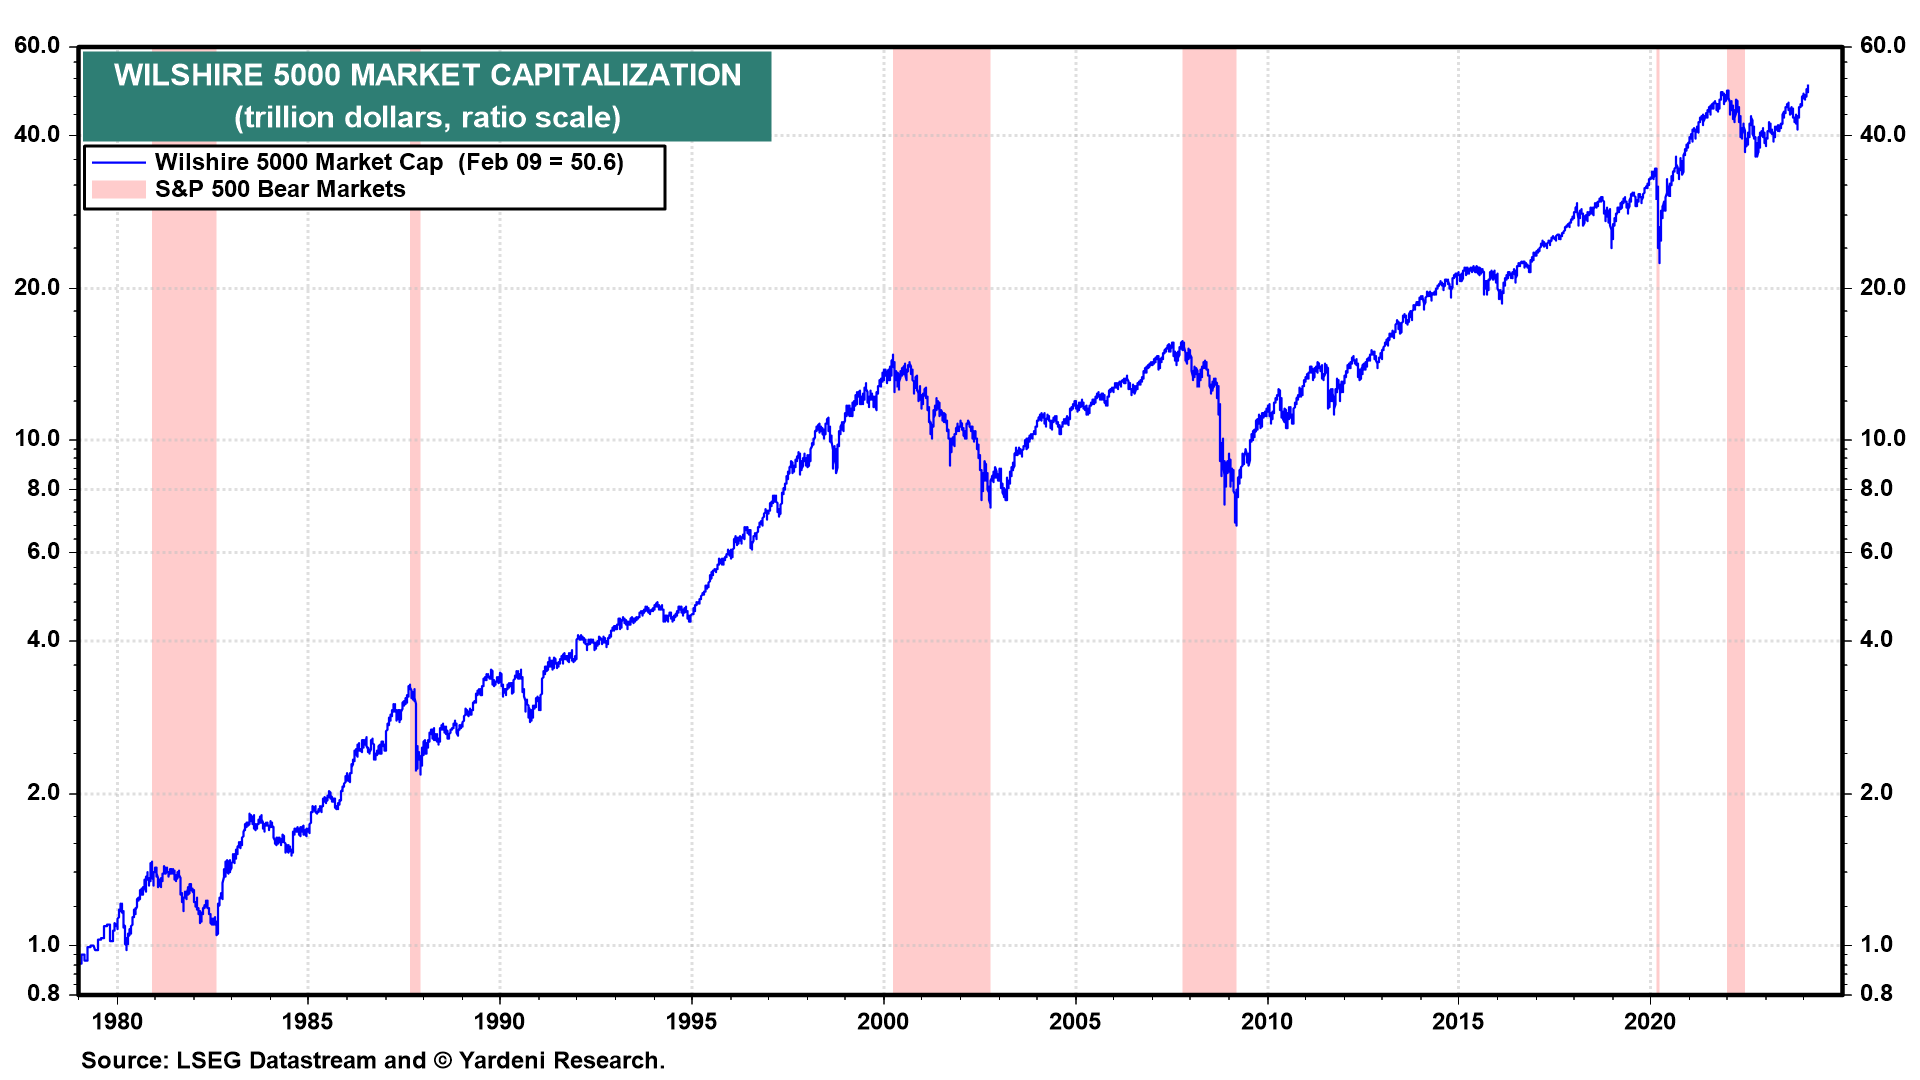
Furthermore, the Wilshire 5000 market capitalization is up $14 trillion since October 14, 2022 and $9.3 trillion since October 27 to a record $50.6 trillion last Friday (chart).
Where did all the money come from to drive up the stock market? It certainly isn’t coming out of money market mutual funds. They are up $1.4 trillion since the start of the bull market in stocks to a record $6.0 trillion during February.
Bull markets tend to be self-perpetuating as rising stock prices attract more buyers. More and more people keep dancing until the music stops. Consider the following:
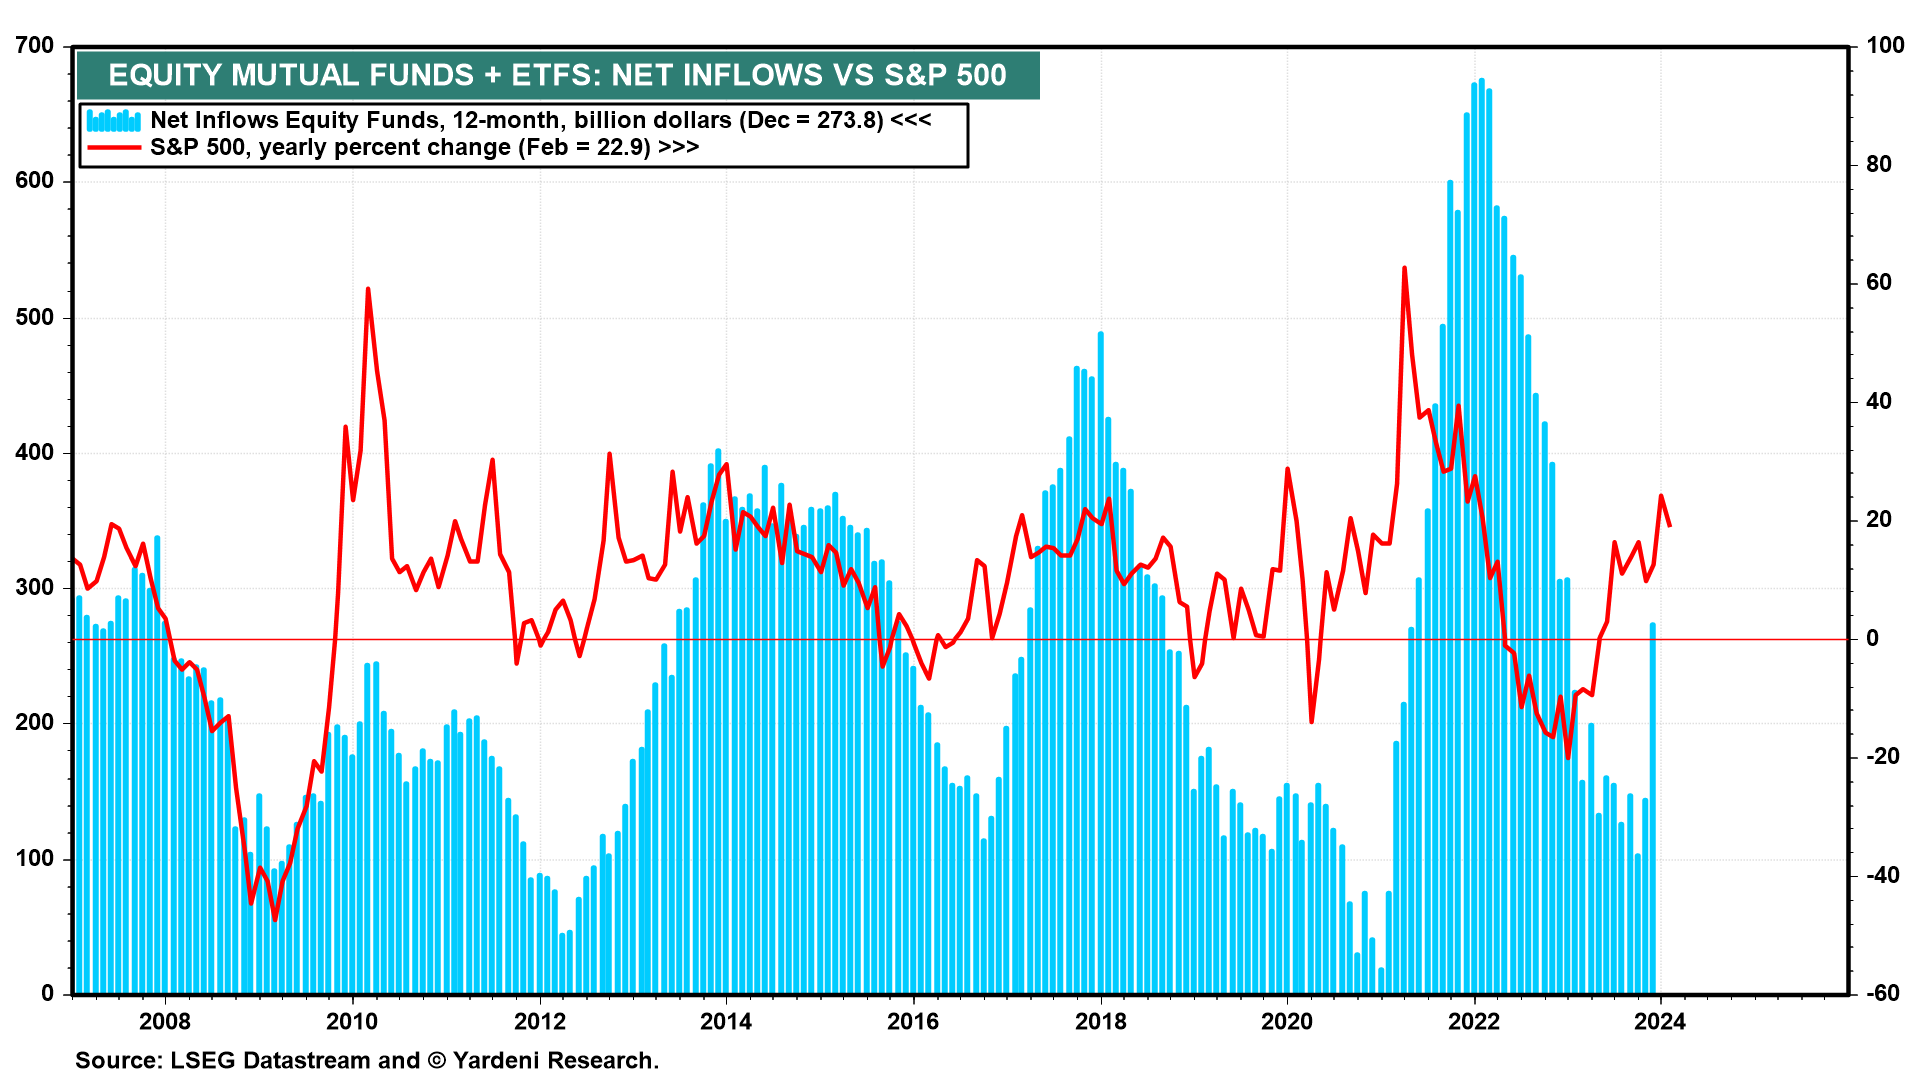
(1) Equity funds. Equity mutual funds and ETFs attracted $156.3 m/m billion in net inflows during December. That was the best pace of monthly net inflows since the start of the data in 2006. Over the past 12 months through December, net inflows into these equity funds totaled $273.8 billion (chart). On this 12-month basis, net inflows show a pattern of either coinciding with or lagging the yearly percent change in the S&P 500.