GDP I: Still Flying. Not Landing.
It’s official: There was no recession in 2022 or 2023. There was no hard landing in either year. There was a soft landing of sorts in 2022, but the economy was flying high last year and remains on that flight path in 2024.
Consumers continued to increase their spending through the end of last year, upending forecasts (not ours) that the dwindling of their pandemic-related excess saving and the resumption of student loan payments would force them to retrench. They didn’t get that memo, or they didn’t read it.
Spending on private capital and public infrastructure also continued to boost economic growth. Fiscal policy remained stimulative and should continue to be so this year given the government’s tax incentives and grants to boost onshoring of manufacturing and ongoing work to improve public infrastructure.
Consider the following:
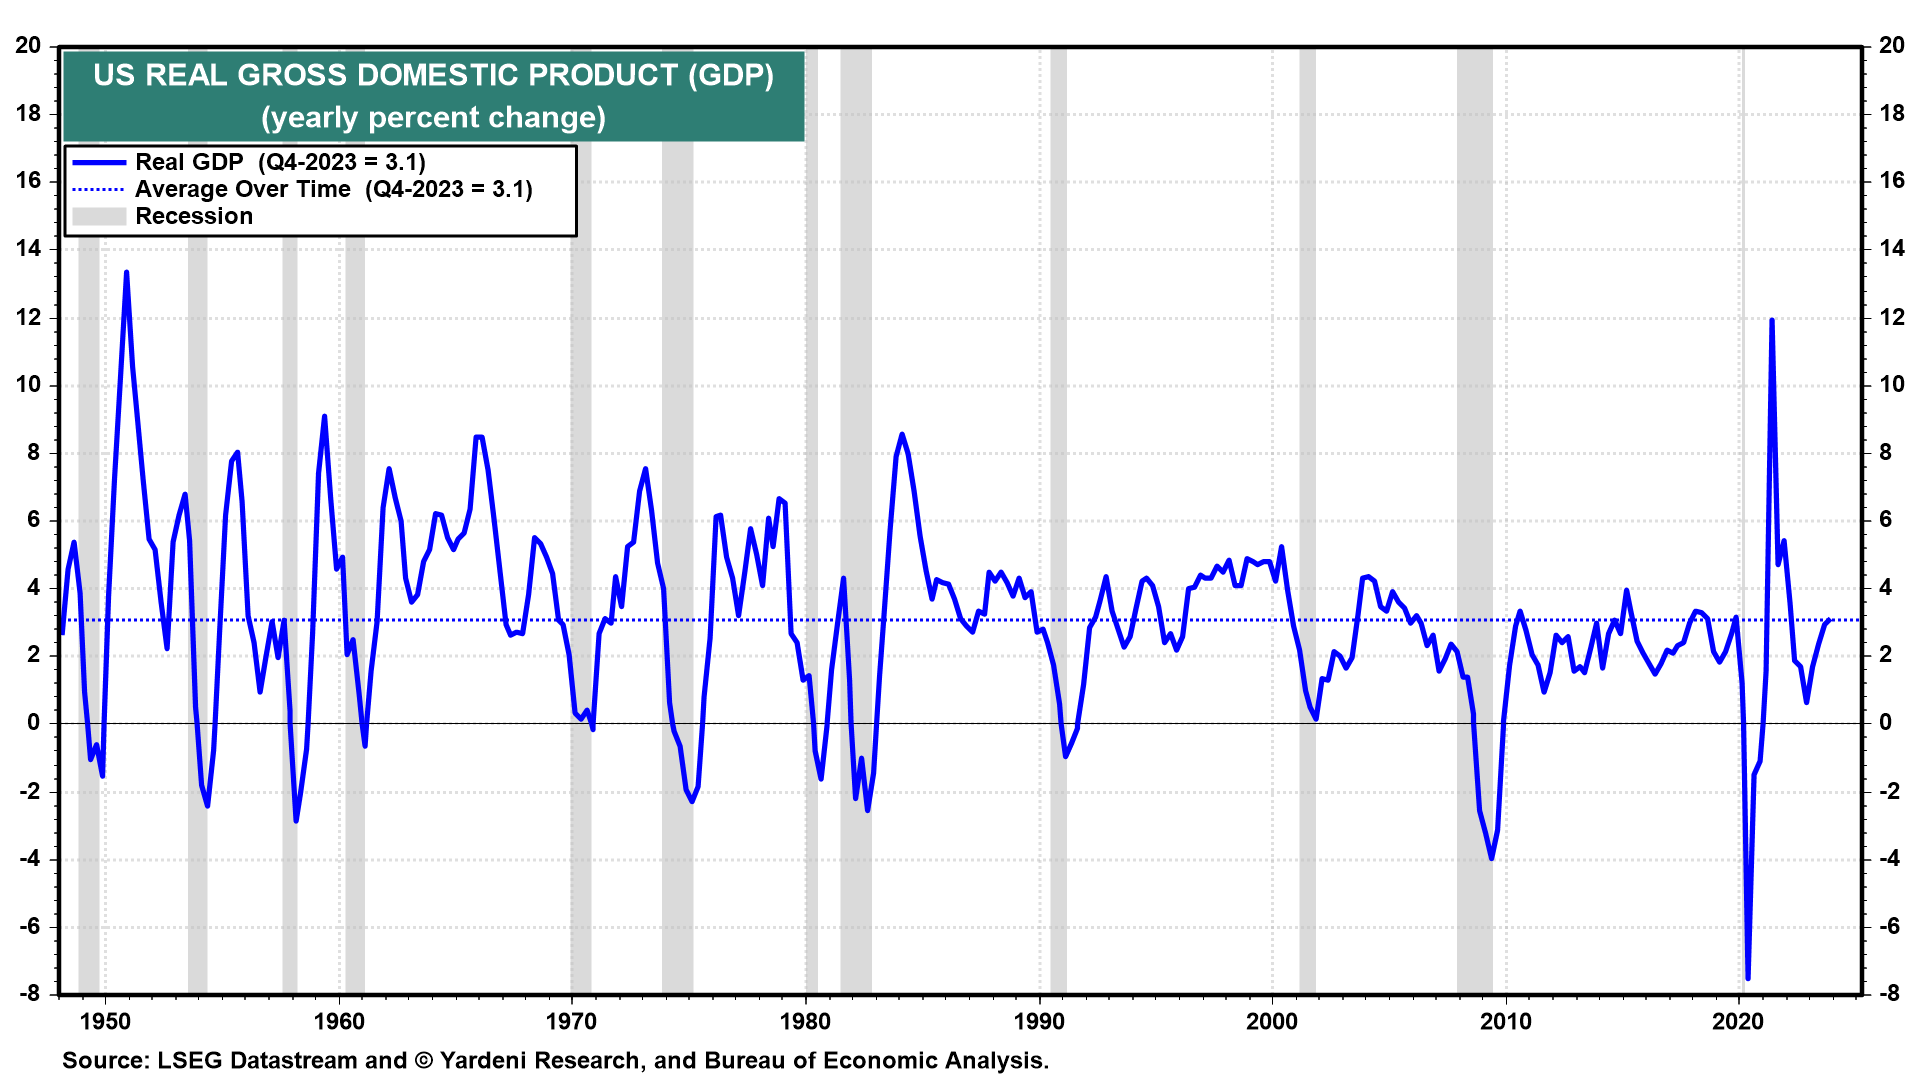
(1) Real GDP. Real GDP for Q4-2023 was revised up from 3.2% (q/q, saar) to 3.4% (Fig. 1 below). Real GDP rose 3.1% y/y last year based on a Q4/Q4 comparison (Fig. 2 below). That matches the average growth rate since 1948. It is up from 0.7% in 2022, which could be described as a “soft landing,” we suppose.
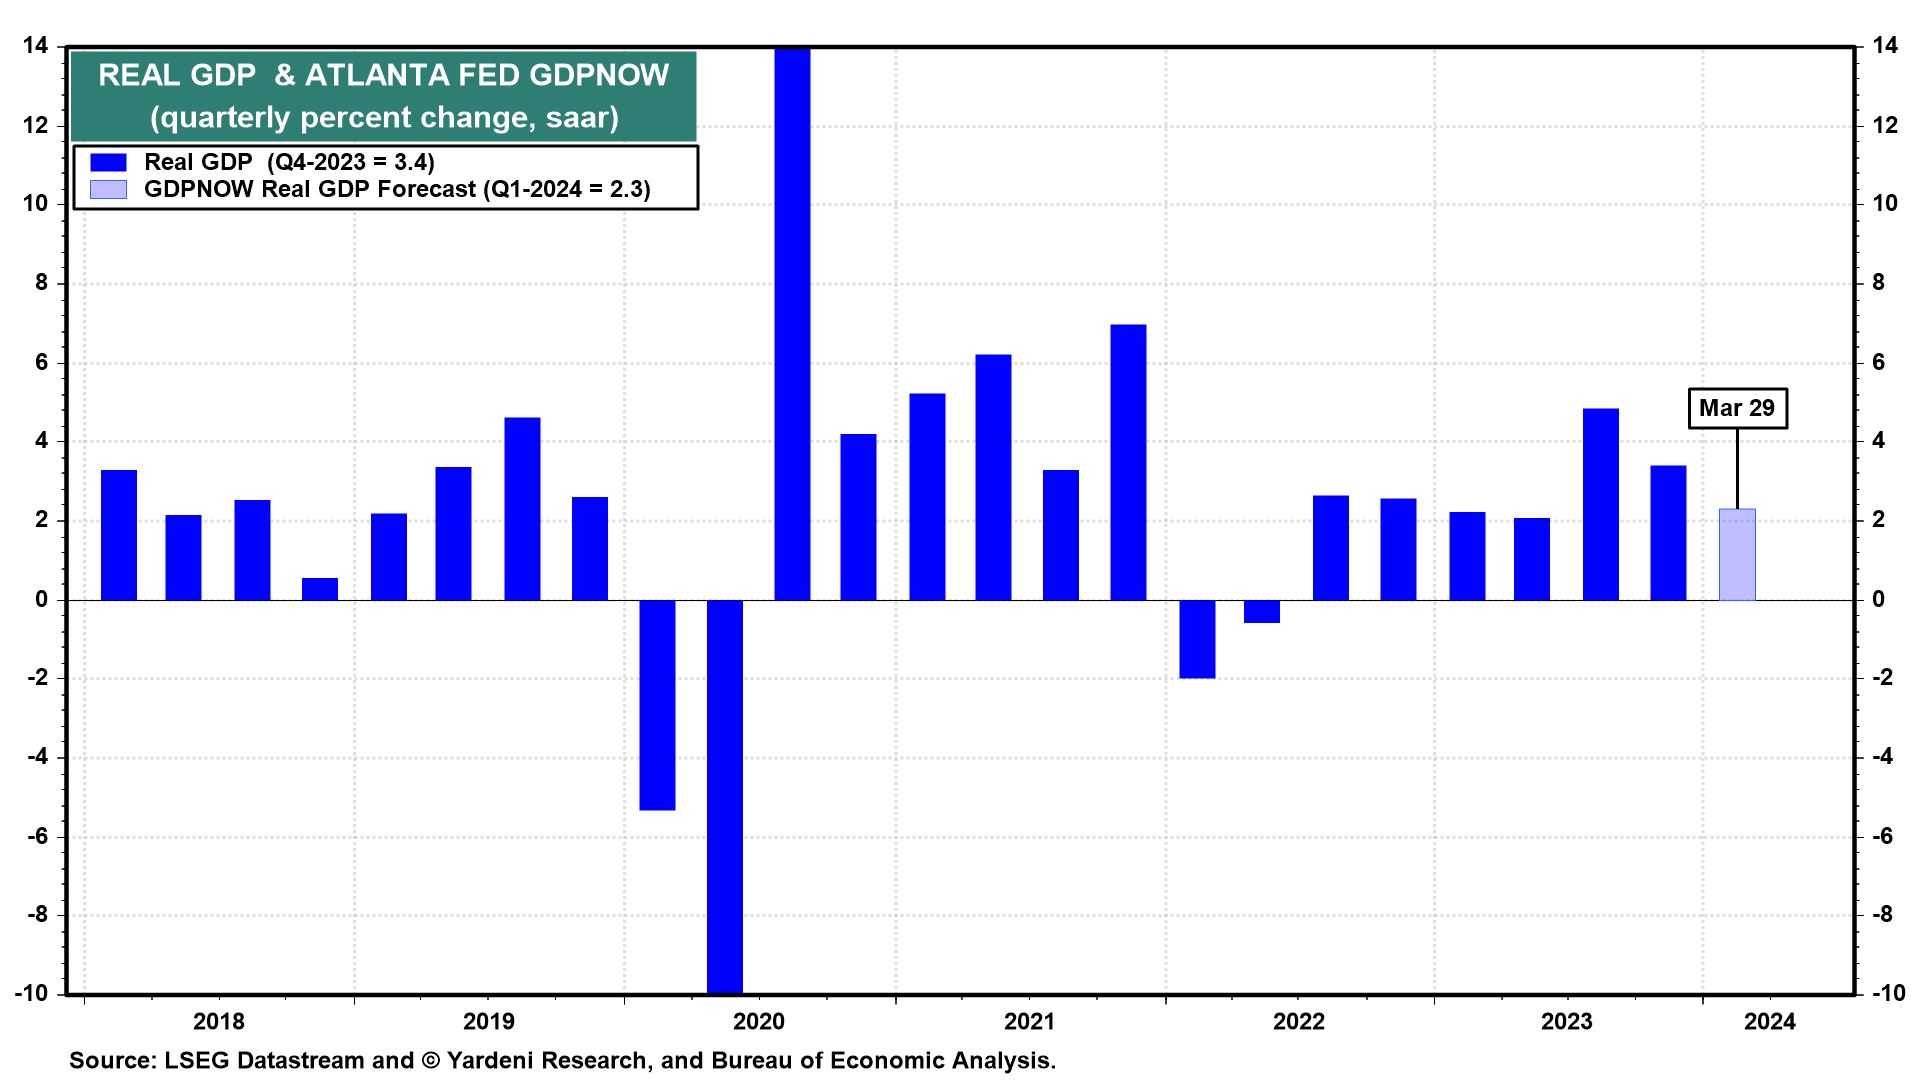
The latest, April 1 estimate of the Atlanta Fed’s GDPNow tracking model shows real GDP up 2.8% during Q1-2024, raised following Monday morning’s releases from the US Census Bureau and the Institute for Supply Management (ISM) from 2.3% shown on March 29. The nowcasts of Q1 real personal consumption expenditures growth and real gross private domestic growth increased from 2.6% and 3.1%, respectively, to 3.2% and 3.9%.
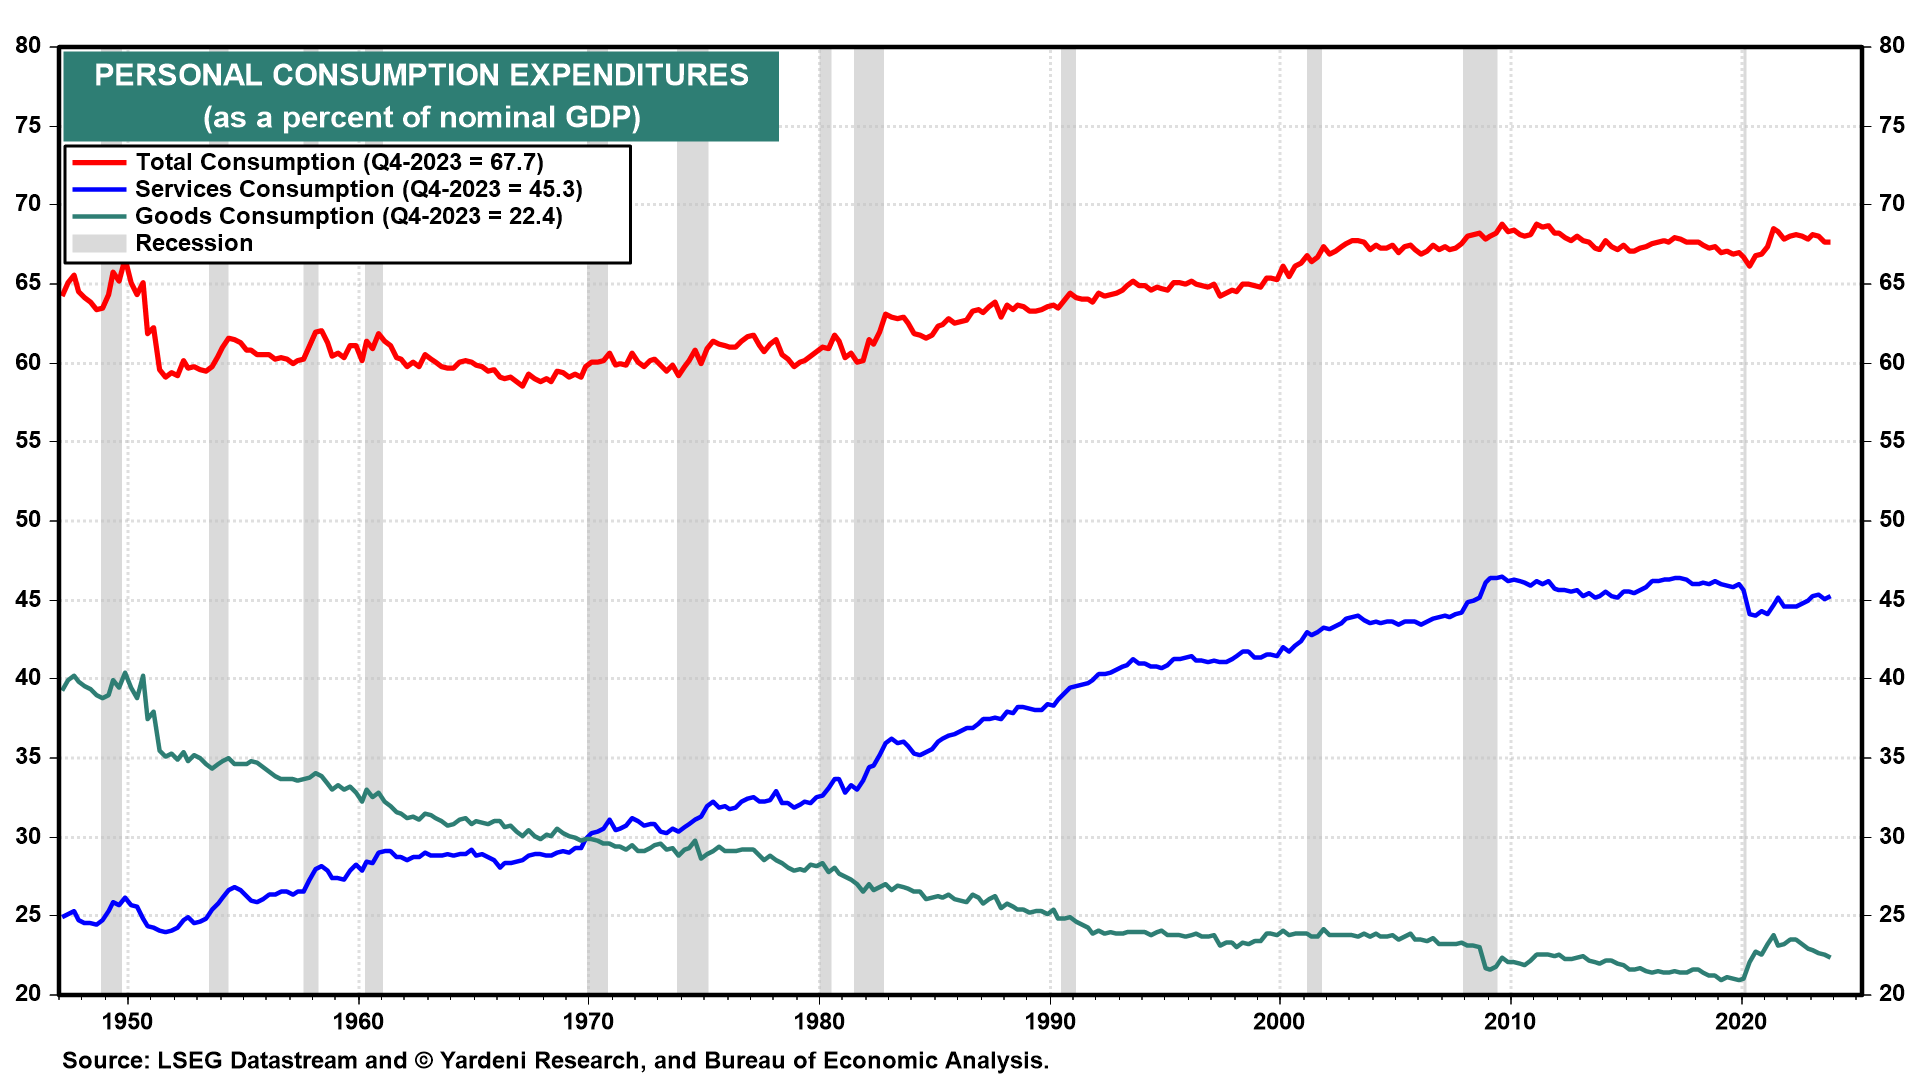
(2) Consumption. The consumer is the economy’s 800-pound gorilla. Consumer spending currently accounts for 67.7% of nominal GDP (Fig. 3 below). The percentage of services consumption rose to equal 29.9% during Q1-1970, at the same time as the percentage of goods consumption fell to that level. Today, the percentages are 45.3% for services and 22.4% for goods.
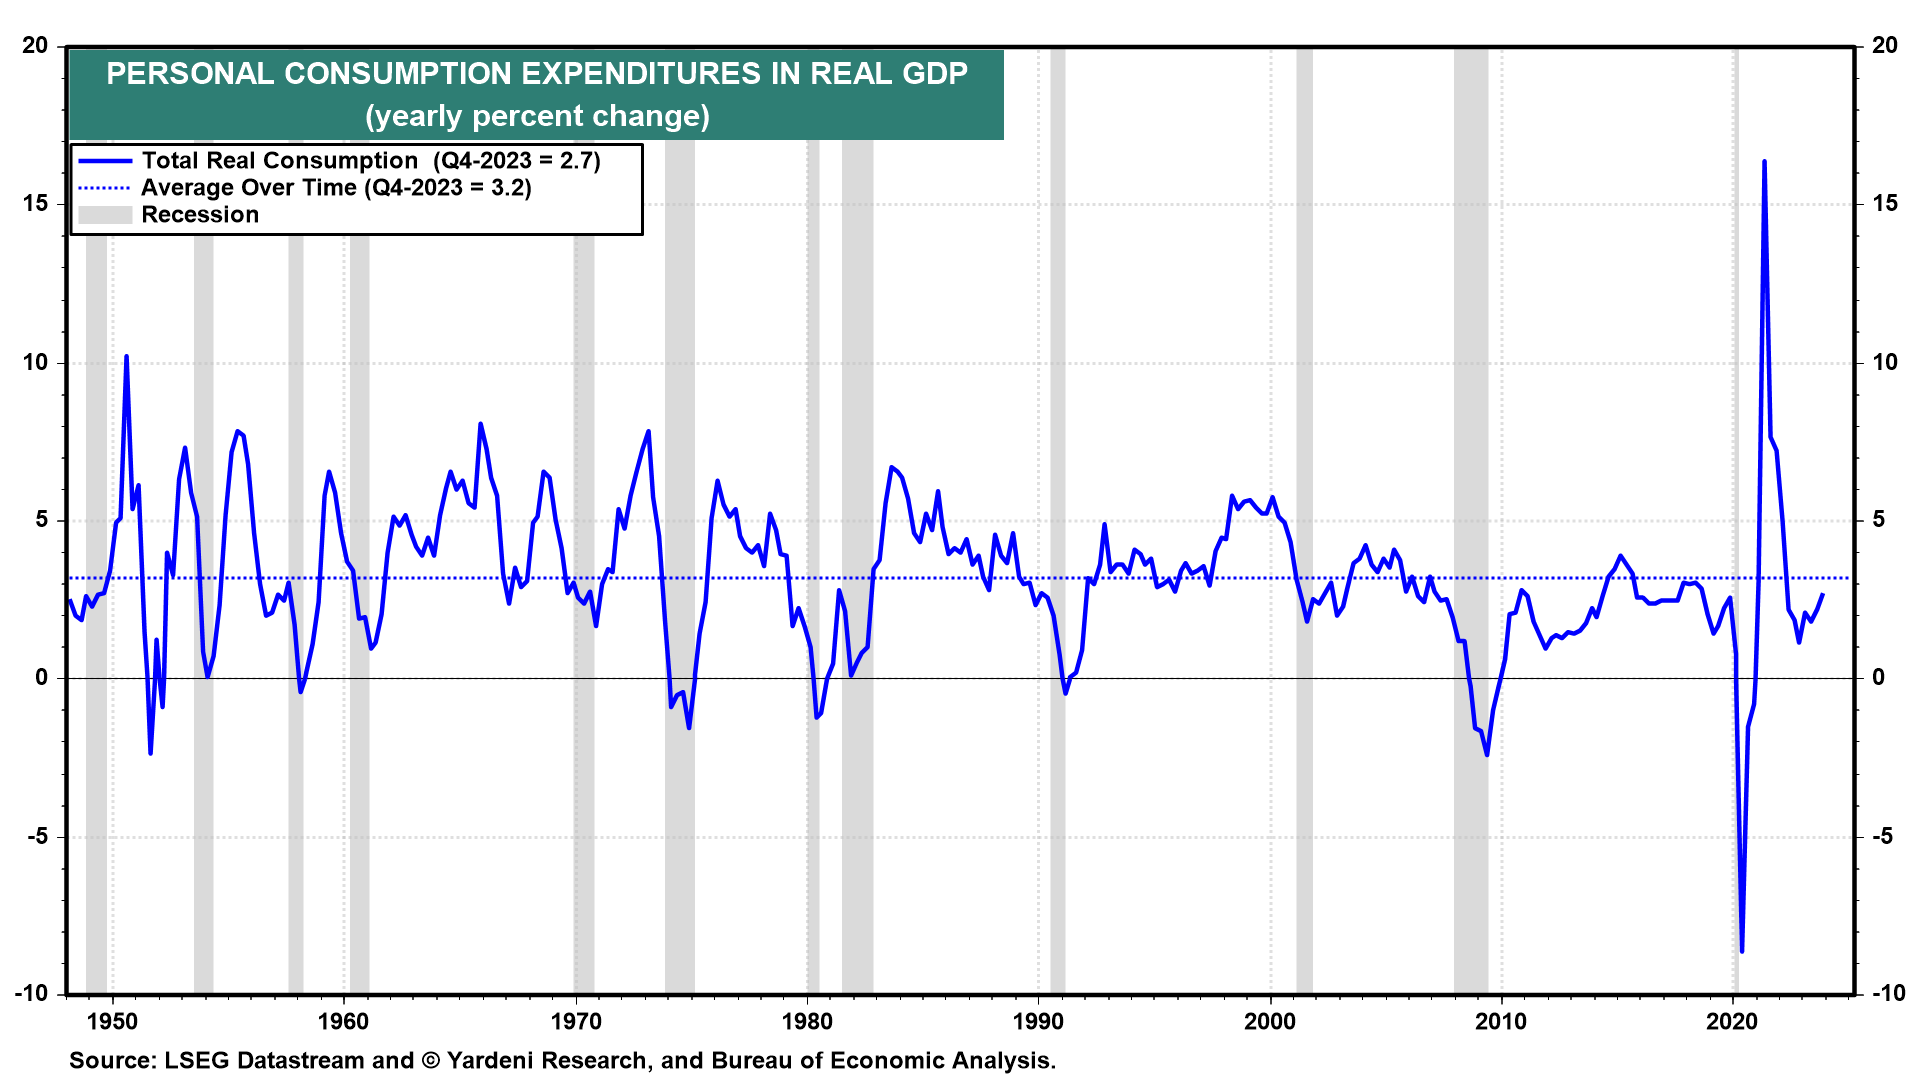
Real consumer spending rose 2.7% y/y through Q4-2023 (Fig. 4 below). That’s a solid pace. Real spending per household was $118,400 (saar) during Q4-2023, near the Q1-2023 record high (Fig. 5). The trendline since 1955 has been rising 1.8% per year, suggesting that the standard of living has been doubling every 40 years. Sure enough, this measure of the standard of living has doubled since 1984.
The widely held notion that Americans’ standard of living has stagnated is dead wrong. Americans have never been better off as measured by consumption per household! Rich households aren’t likely to be biasing real consumption per household significantly upward; there aren’t enough of them consuming enough more than other households to make a statistical difference.
(3) Capital spending. There’s no sign that the Fed’s aggressive tightening of monetary policy over the past two years has depressed capital spending. On the contrary, real capital spending rose to a record high of $3.3 trillion at the end of last year (Fig. 6 below).
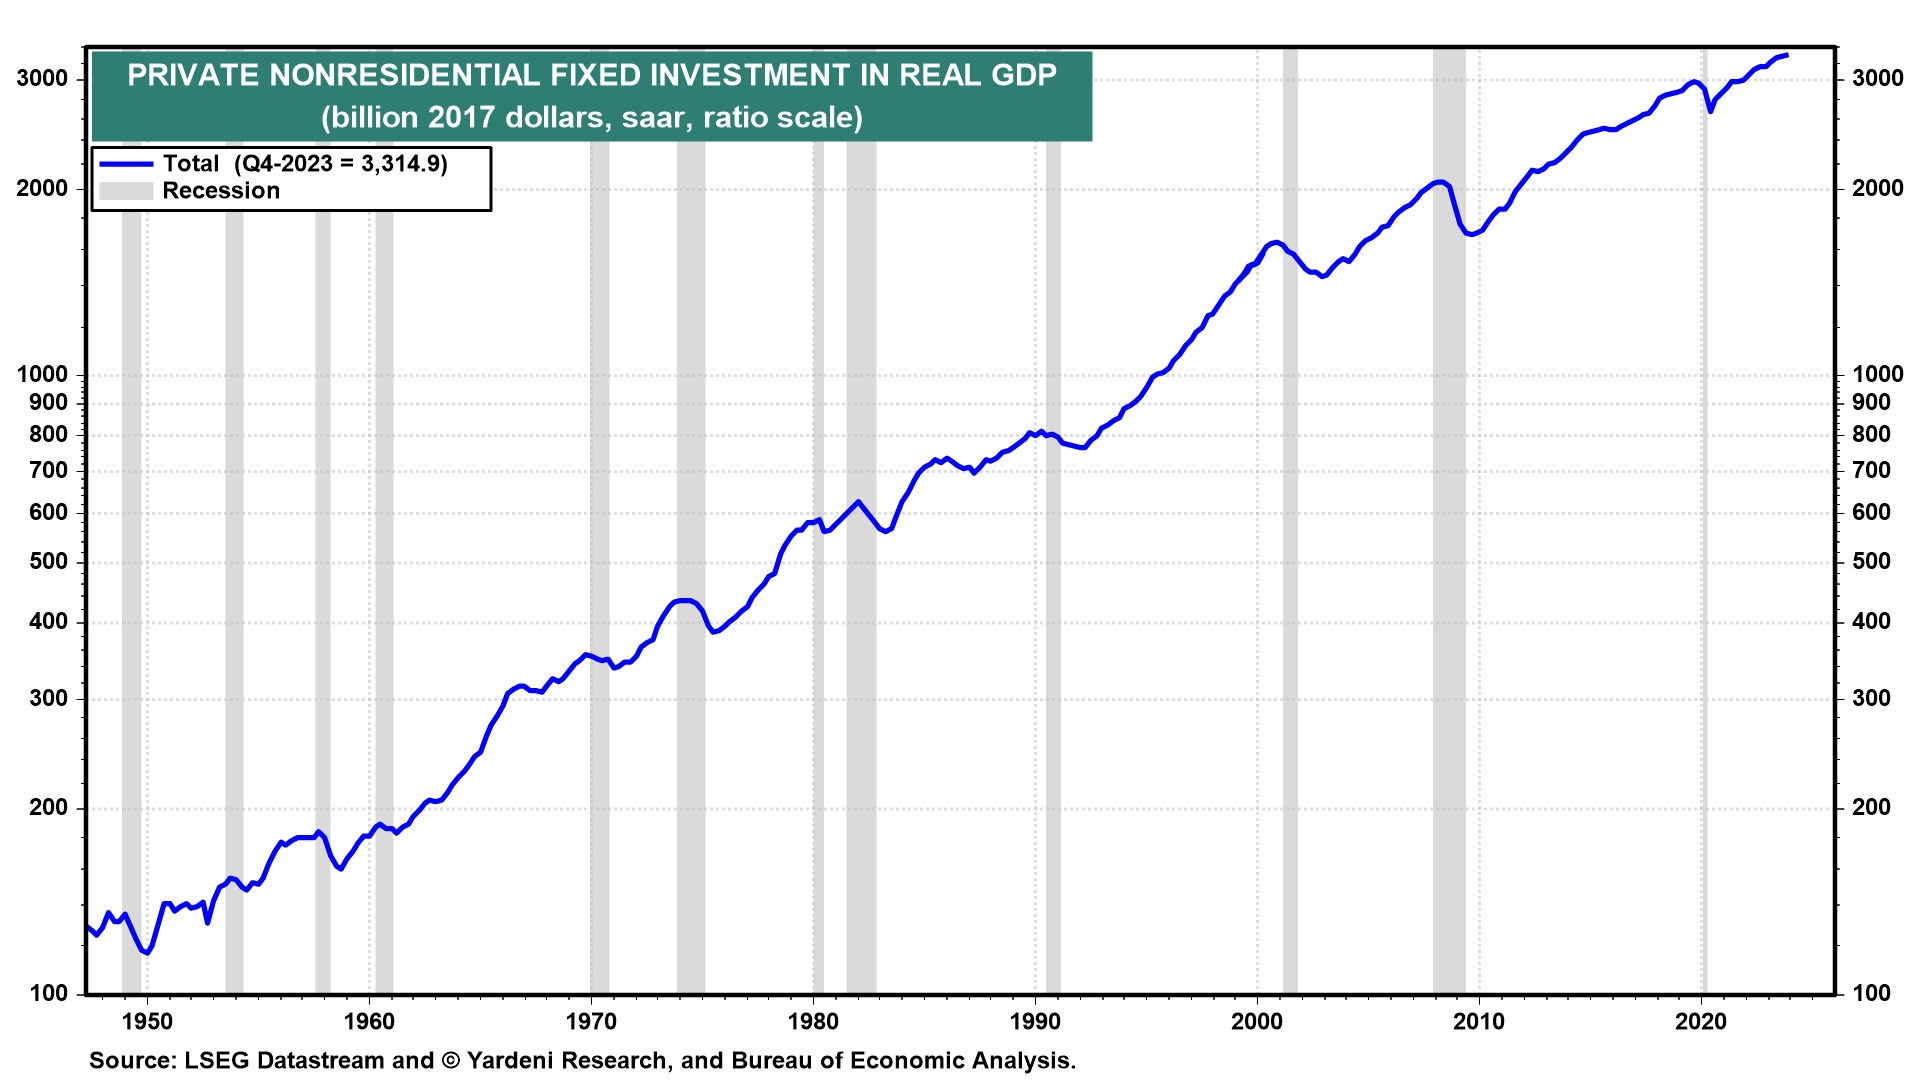
In the past, recessions caused by the tightening of monetary policy depressed capital spending. This time, there has been no recession, so far. This suggests that rising interest rates don’t depress capital spending unless they cause a recession! By the way, corporate cash flow rose to a record high, as we discuss below.
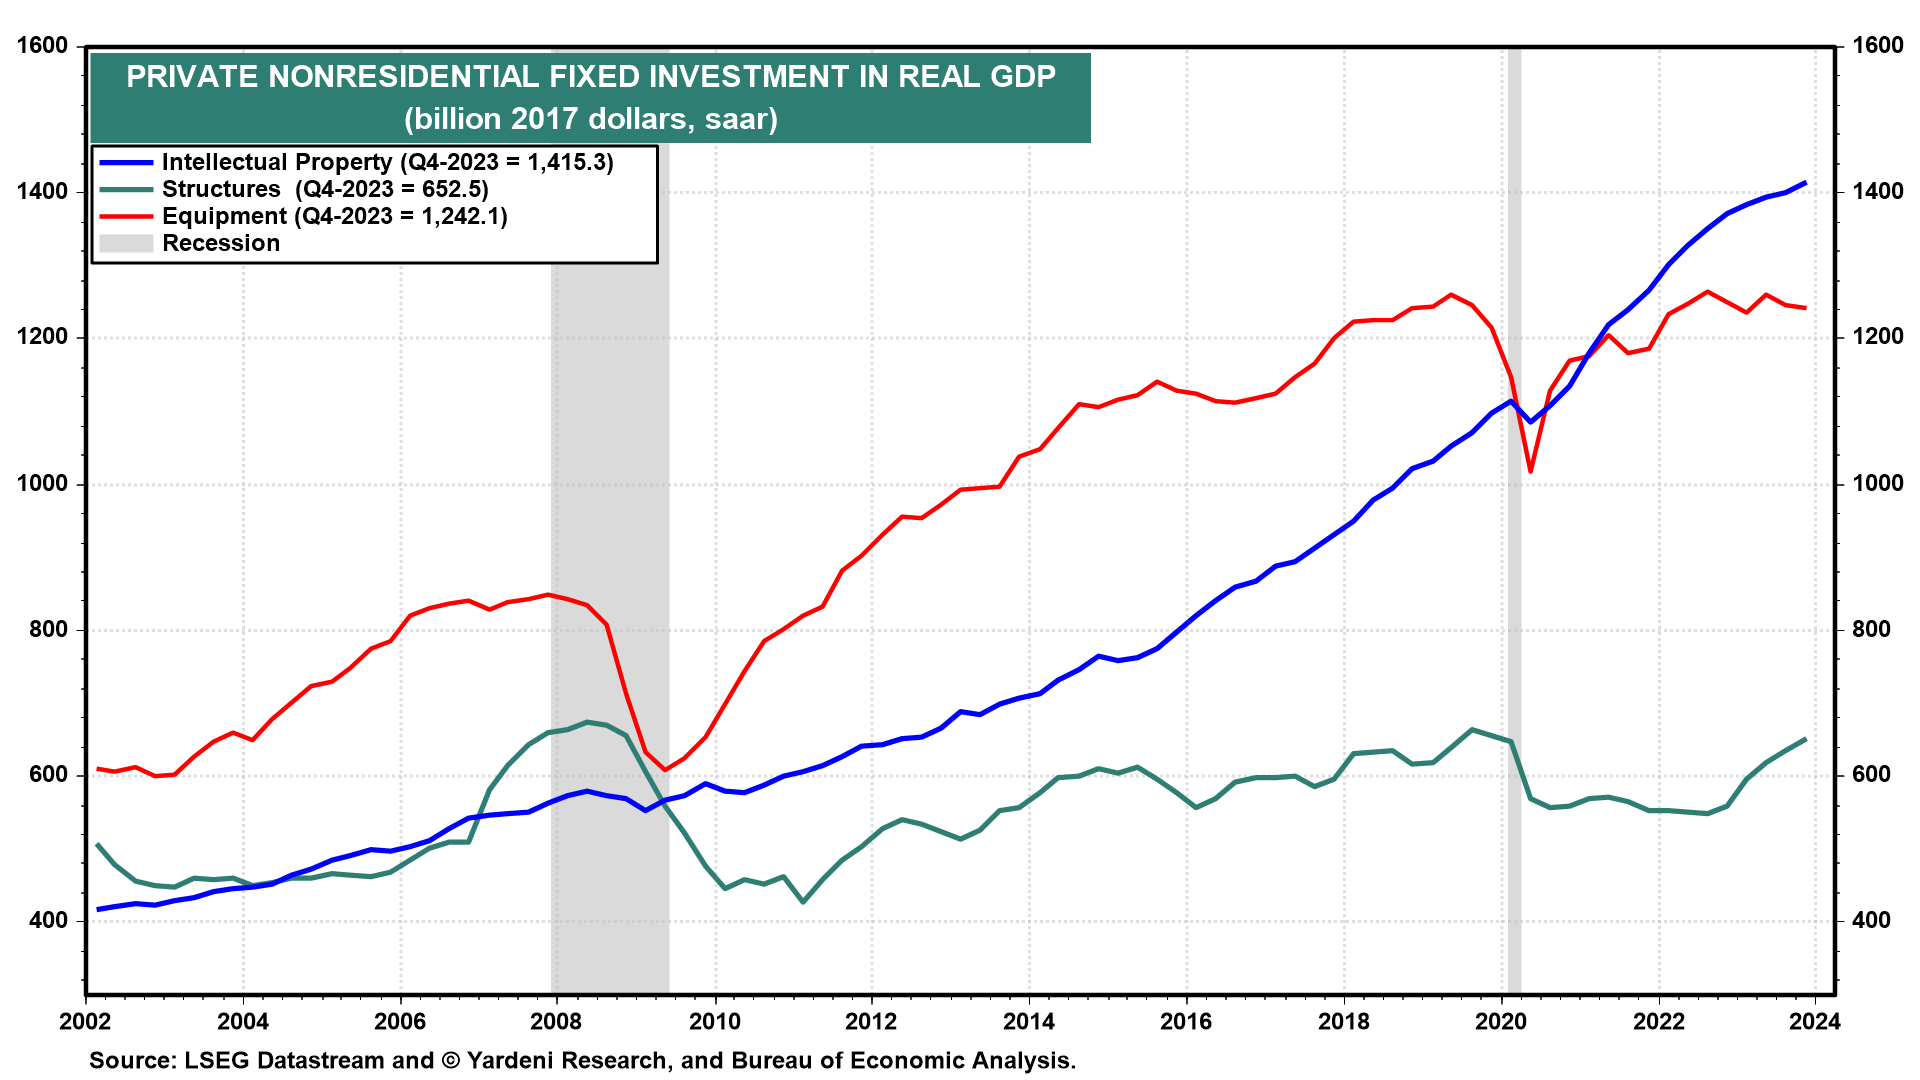
Leading the charge to a new high for real capital spending have been new highs for spending on software (in intellectual property) and manufacturing structures (in structures) (Fig. 7 below, Fig. 8, and Fig. 9).
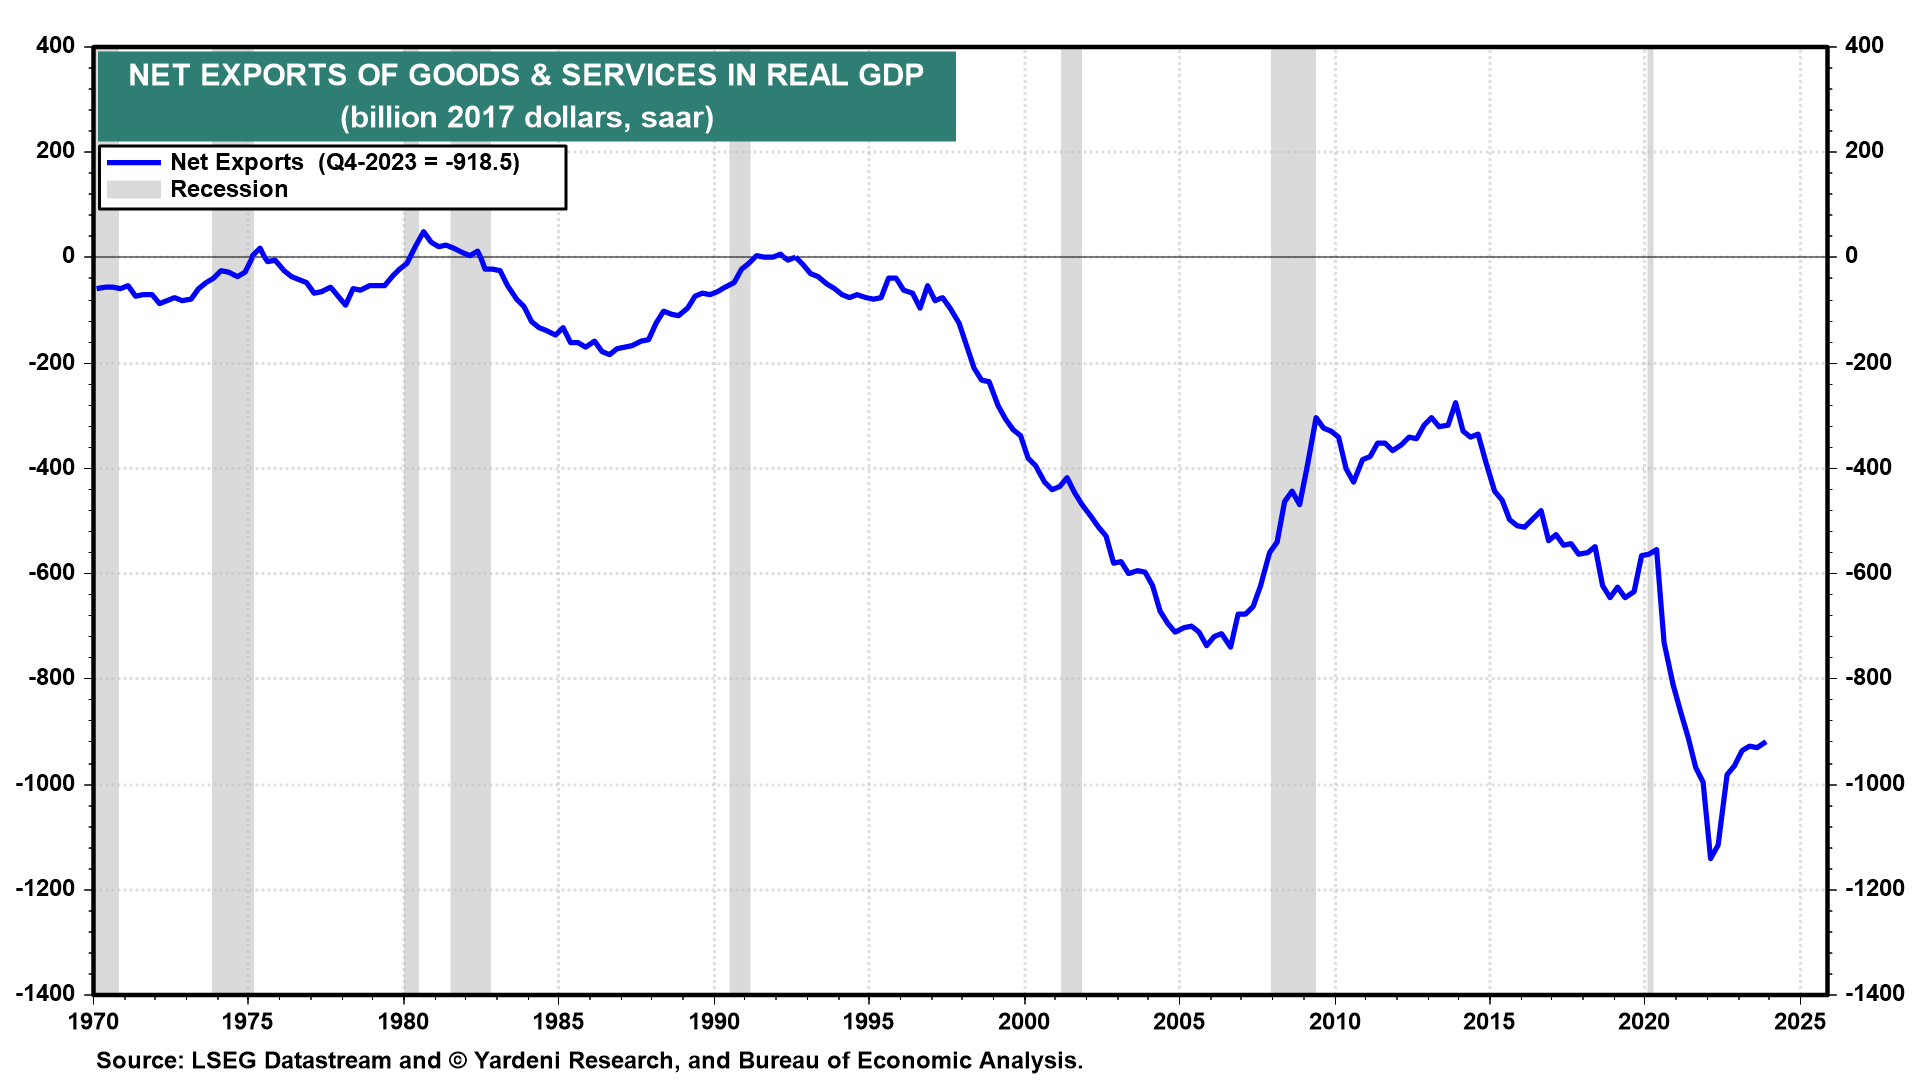
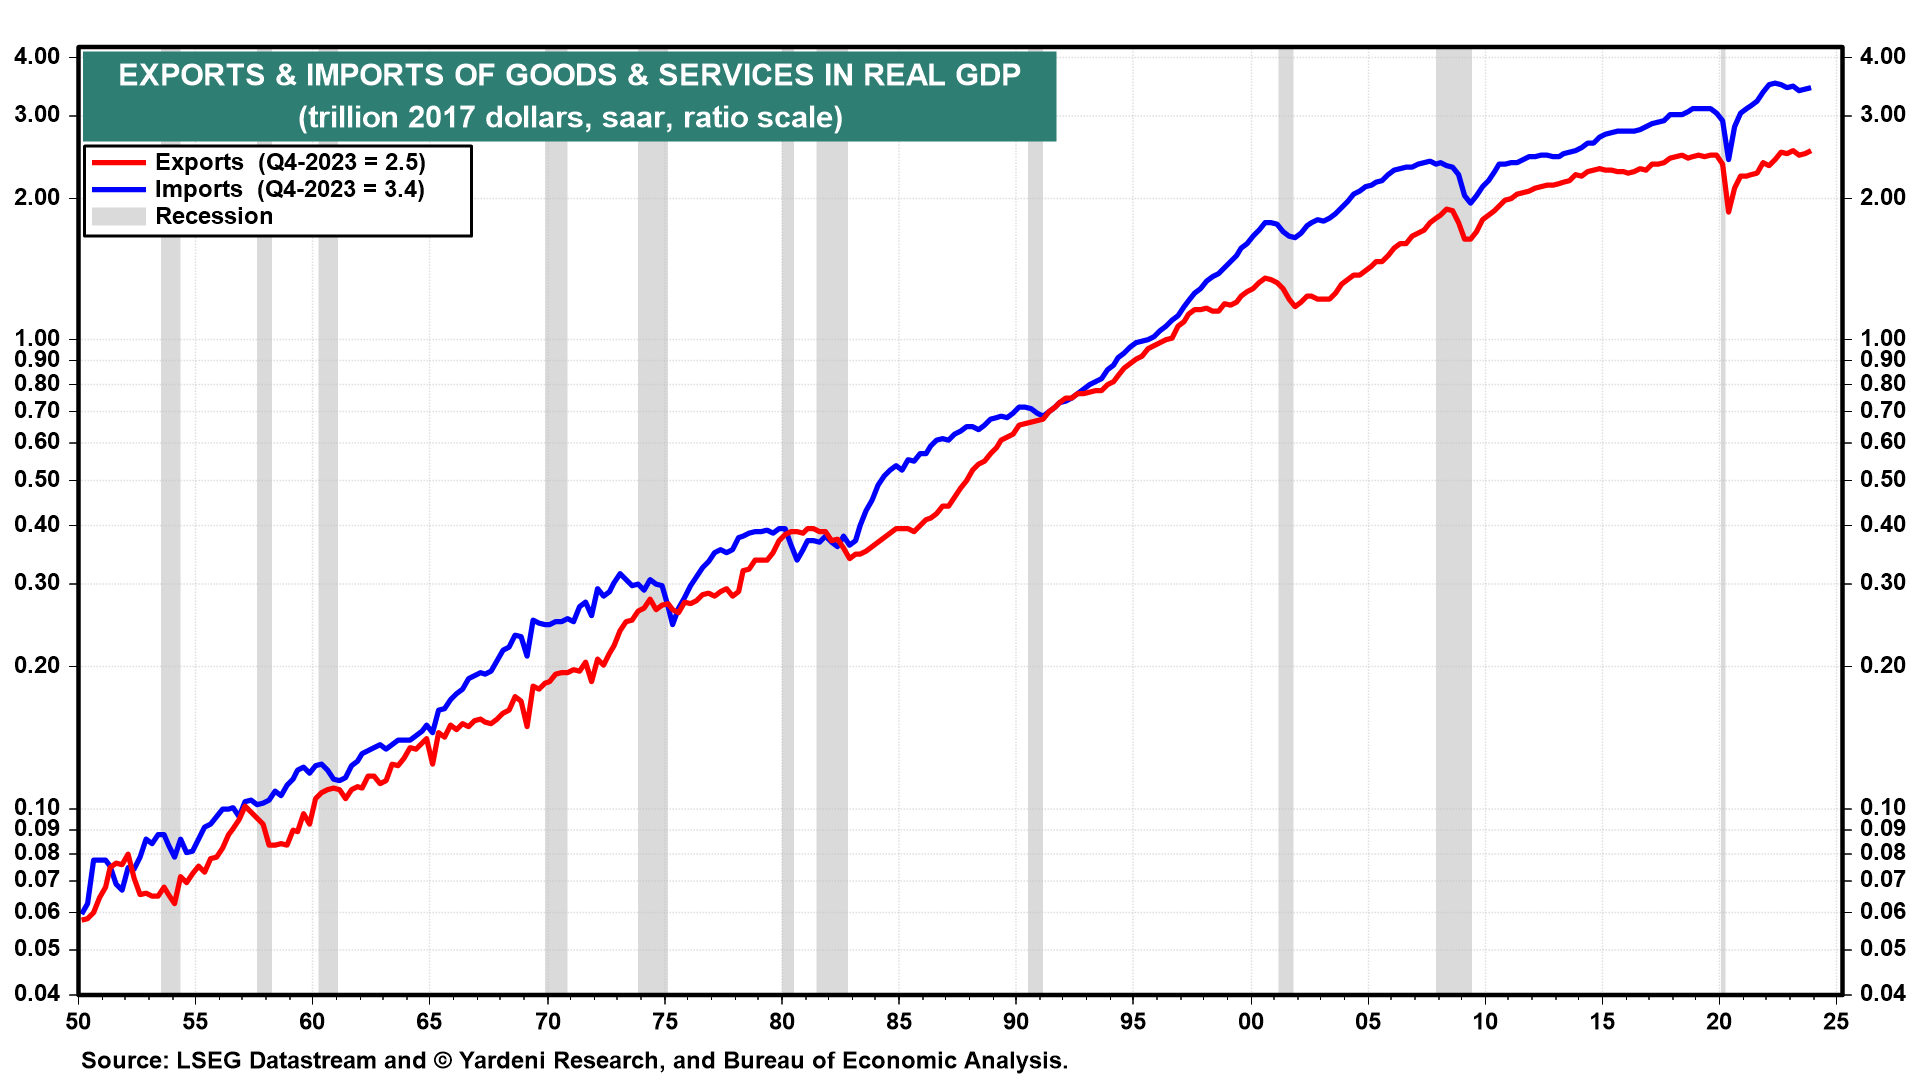
(4) Trade. The widening trade deficit in real GDP was a major drag on economic growth during the pandemic period from Q3-2020 through Q1-2022 (Fig. 10 below). That’s when Americans went on a buying binge for goods, with many of the goods purchased imported from overseas. The trade deficit has been mostly a positive contributor to economic growth since then, though not so much last year, as both exports and imports stagnated, reflecting slower global economic growth (Fig. 11 below).
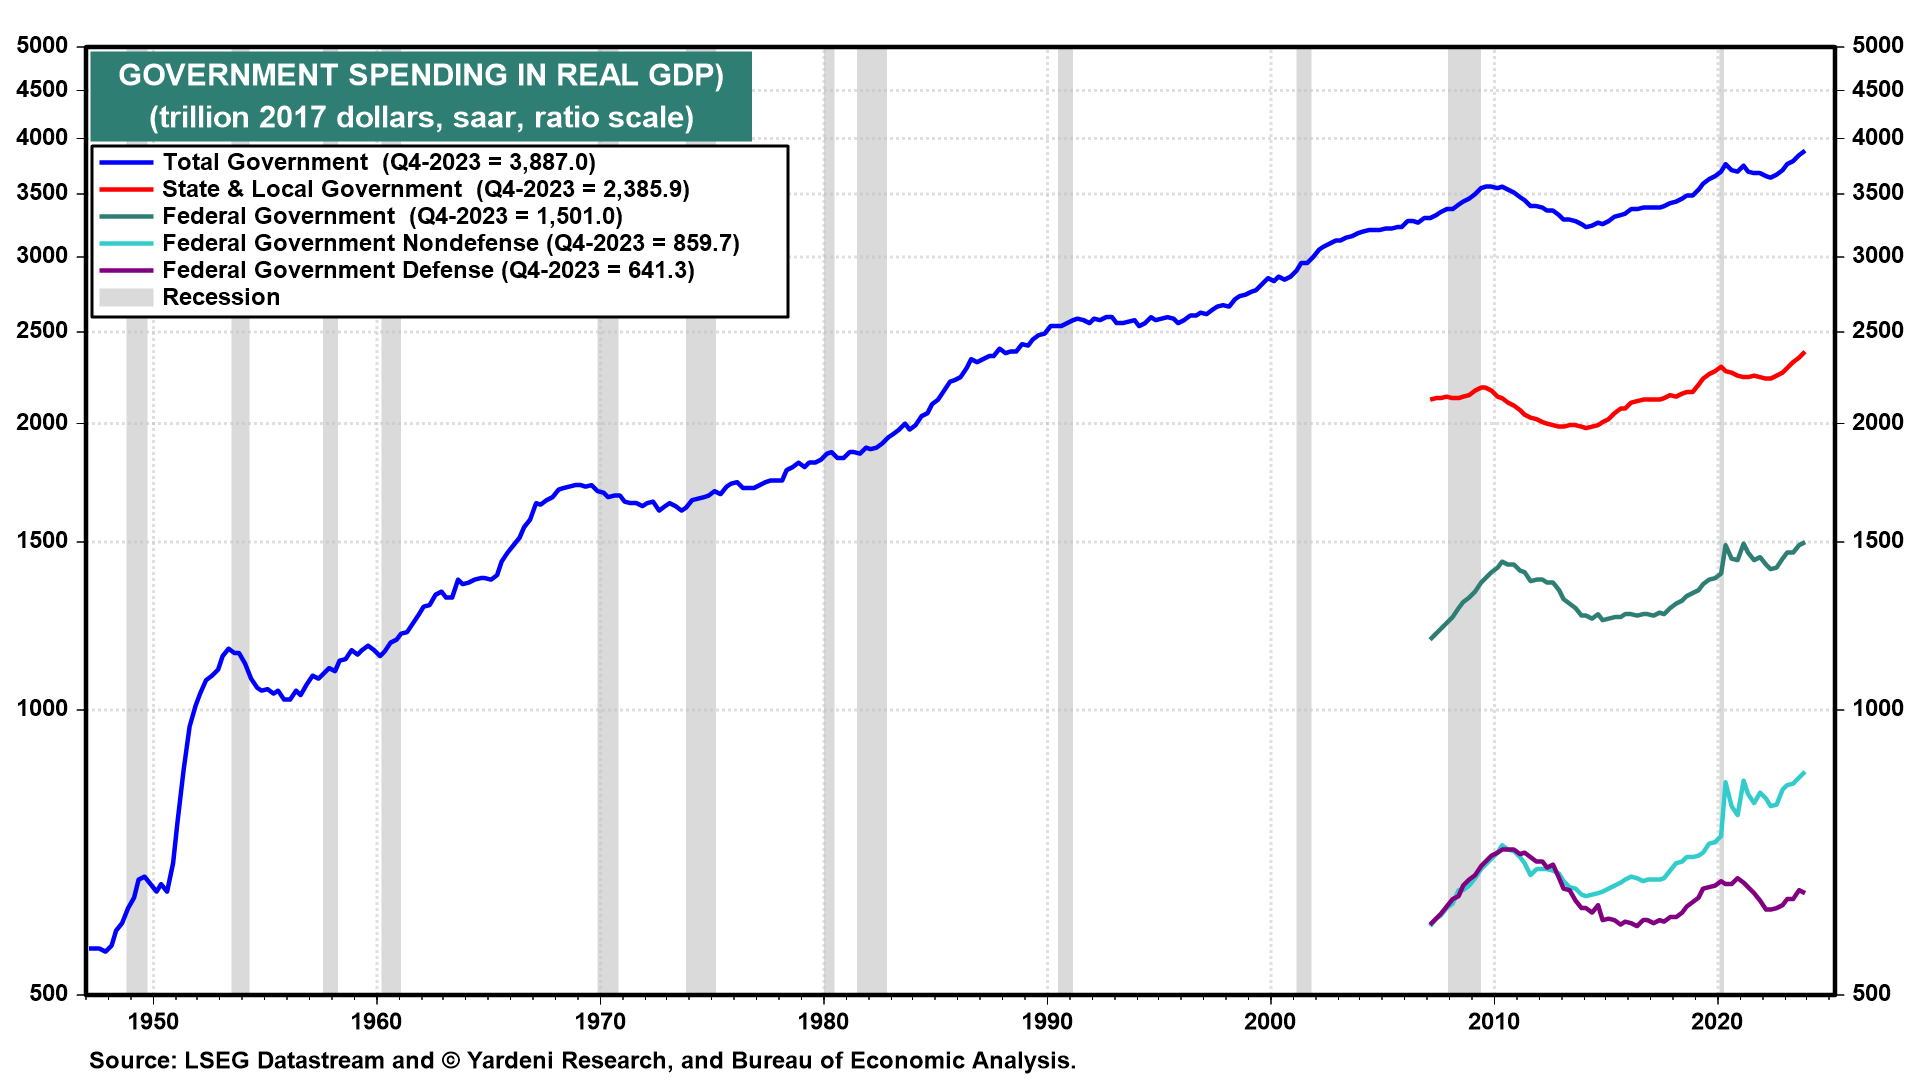
(5) Government. Federal, state, and local government spending on goods and services in real GDP rose to a record high during Q4-2023, as state and local government spending rose to new record highs while federal climbed back to its preexisting record high (Fig. 12 below). Nondefense federal government spending also rose to a record high. Spending on public infrastructure undoubtedly boosted government spending and should continue to do so.
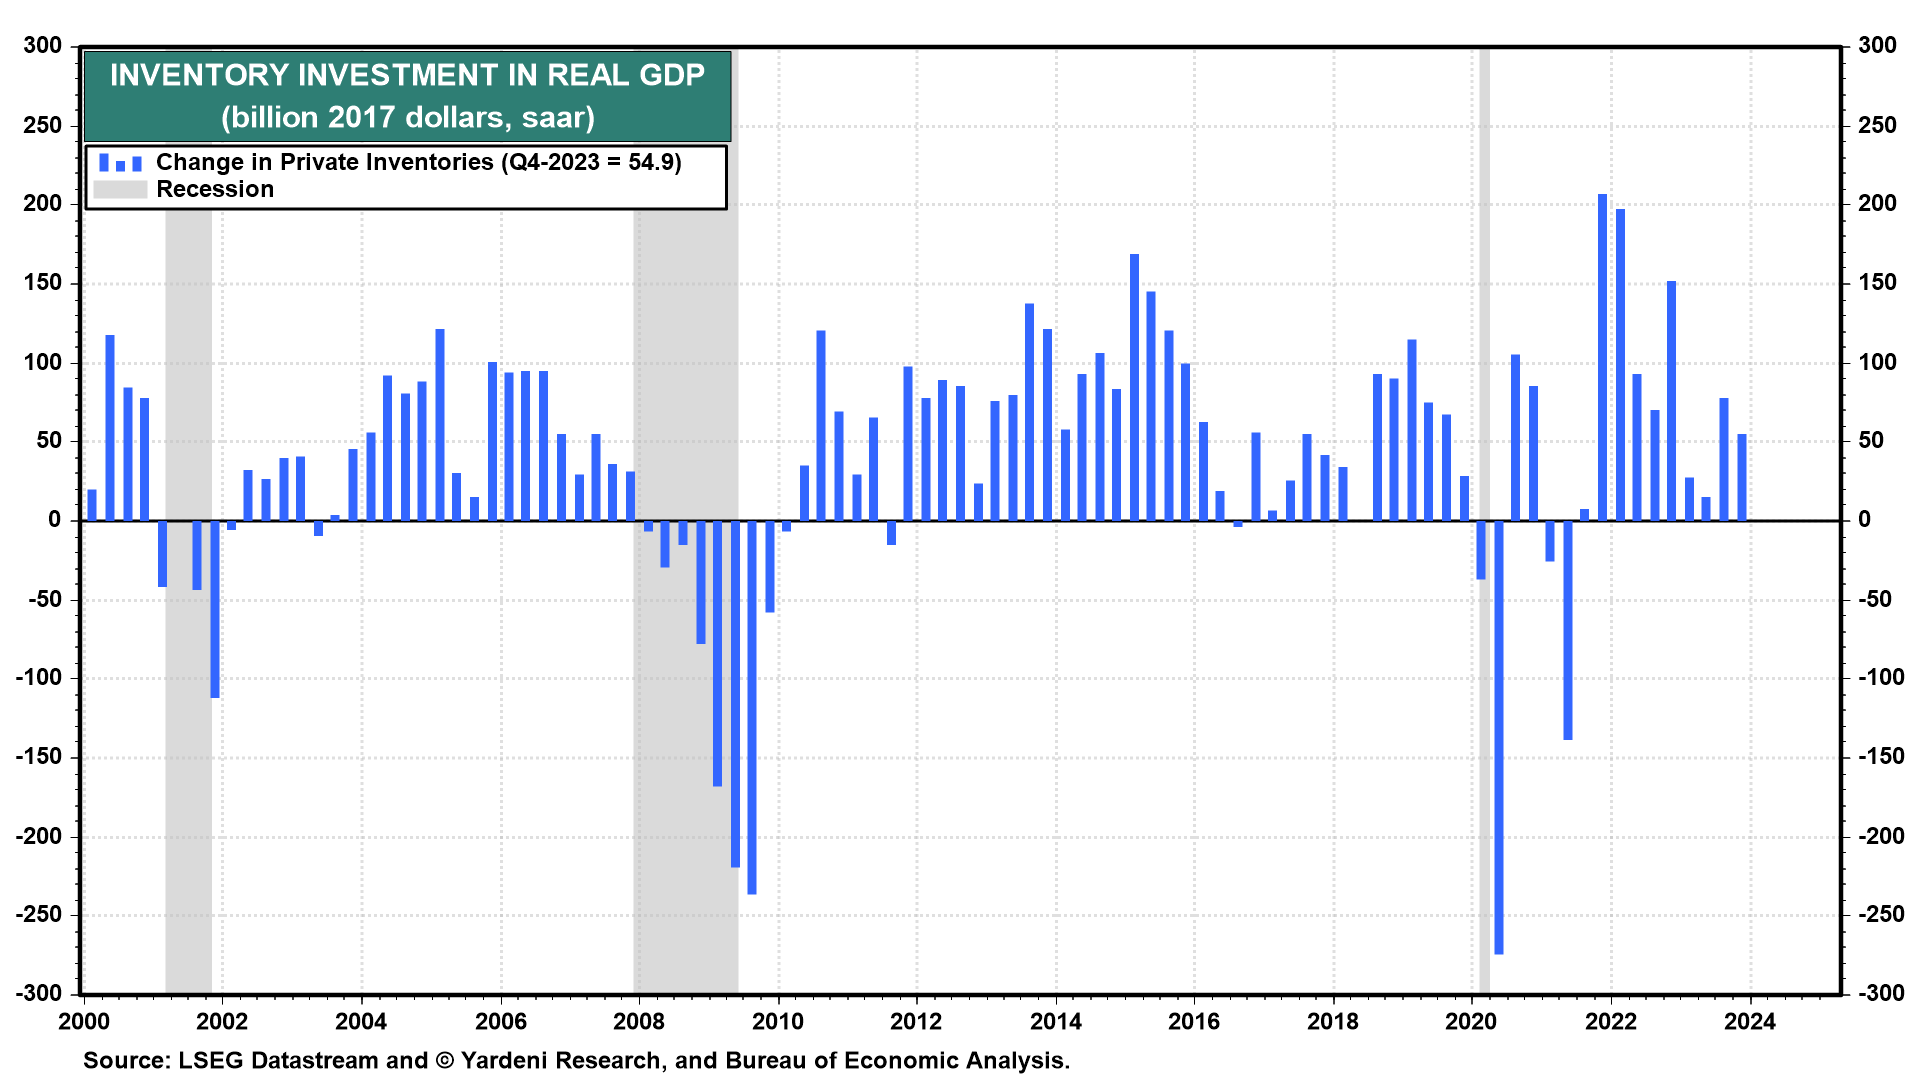
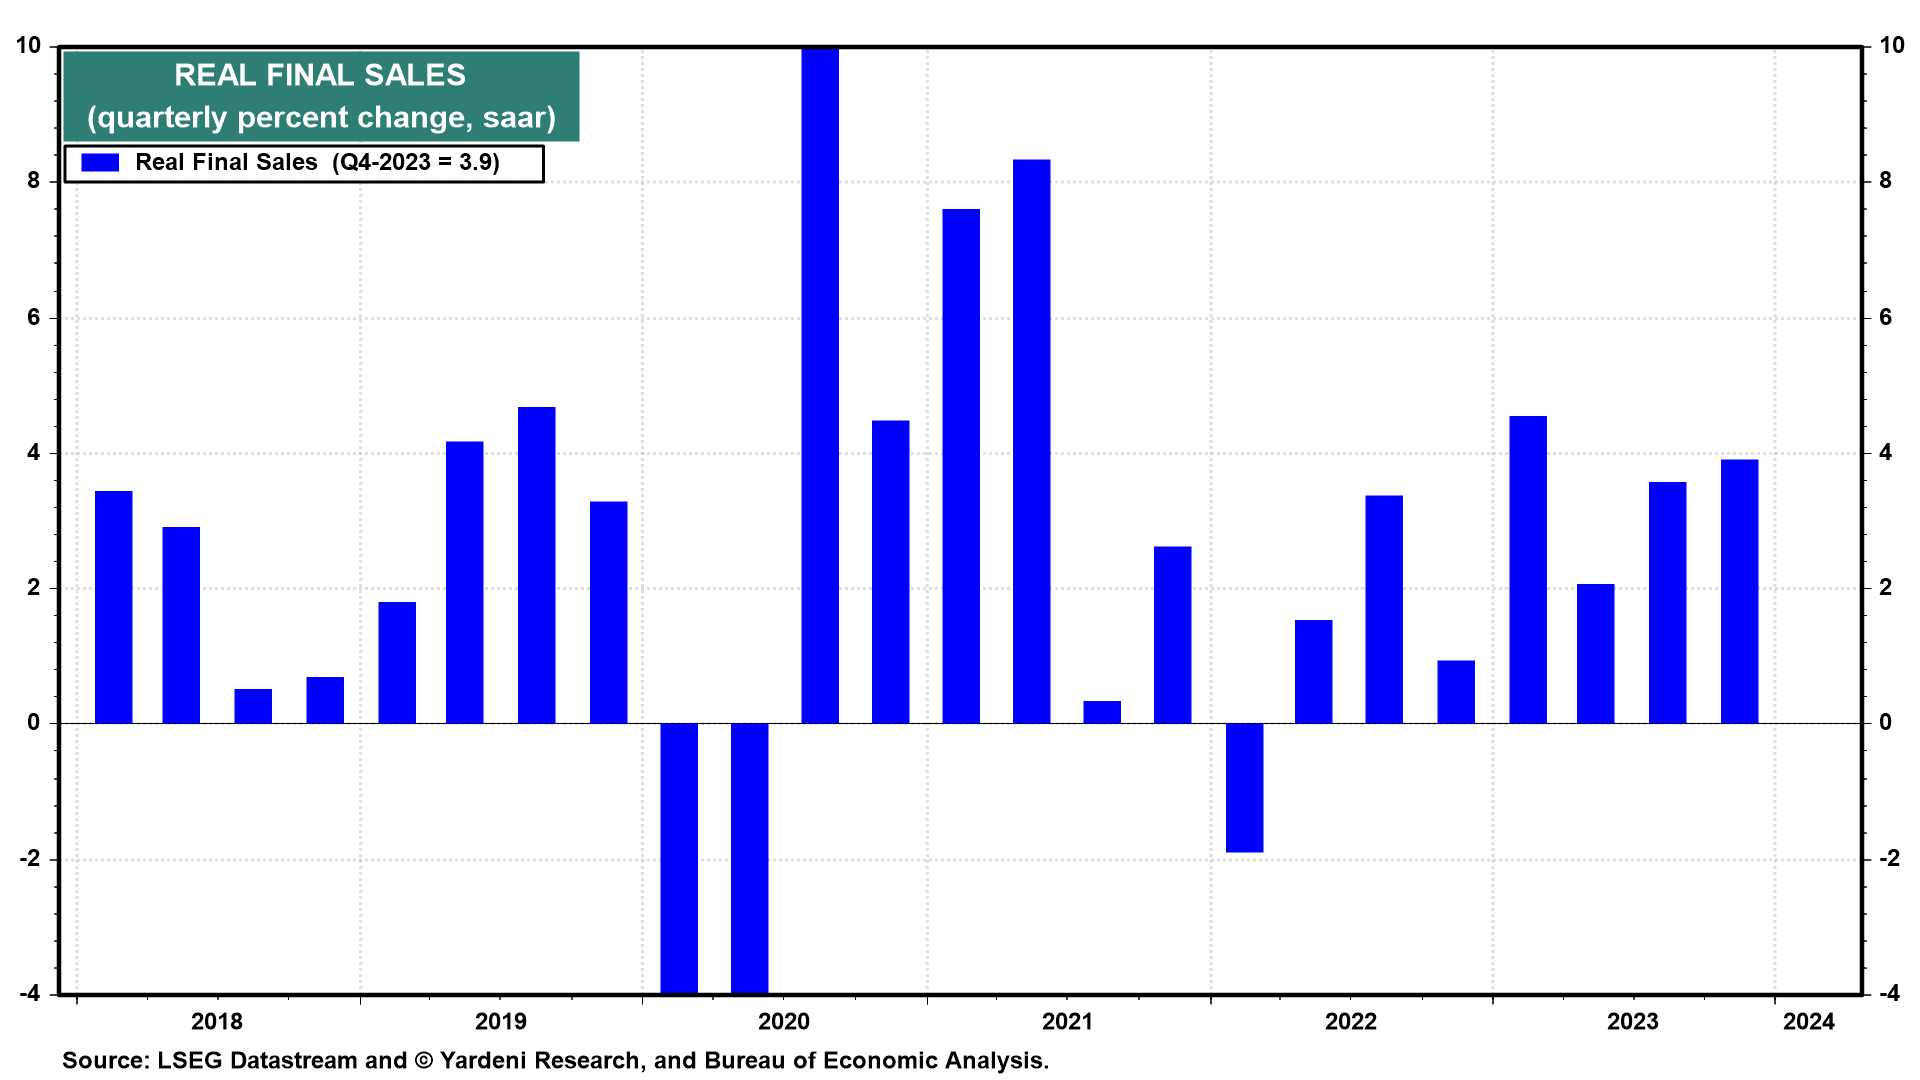
(6) Inventories & final sales. The pace of real inventory investment slowed during Q4-2023 (Fig. 13 below). That was a negative contributor to real GDP. That’s why real final sales rose 3.9% during the quarter, the best pace since the first quarter of last year (Fig. 14 below).