


Since the start of the 2020s, we’ve been comparing the current decade mostly to the 1920s and the 1970s. However, the S&P 500’s 42.3% meltup since October 12, 2022 to a new record high on February 23 has us considering whether another period represents a possible analogous scenario, i.e., the second half of the 1990s. We see parallels between conditions then and now that may suggest what’s up ahead for both the stock market and the federal funds rate (FFR).
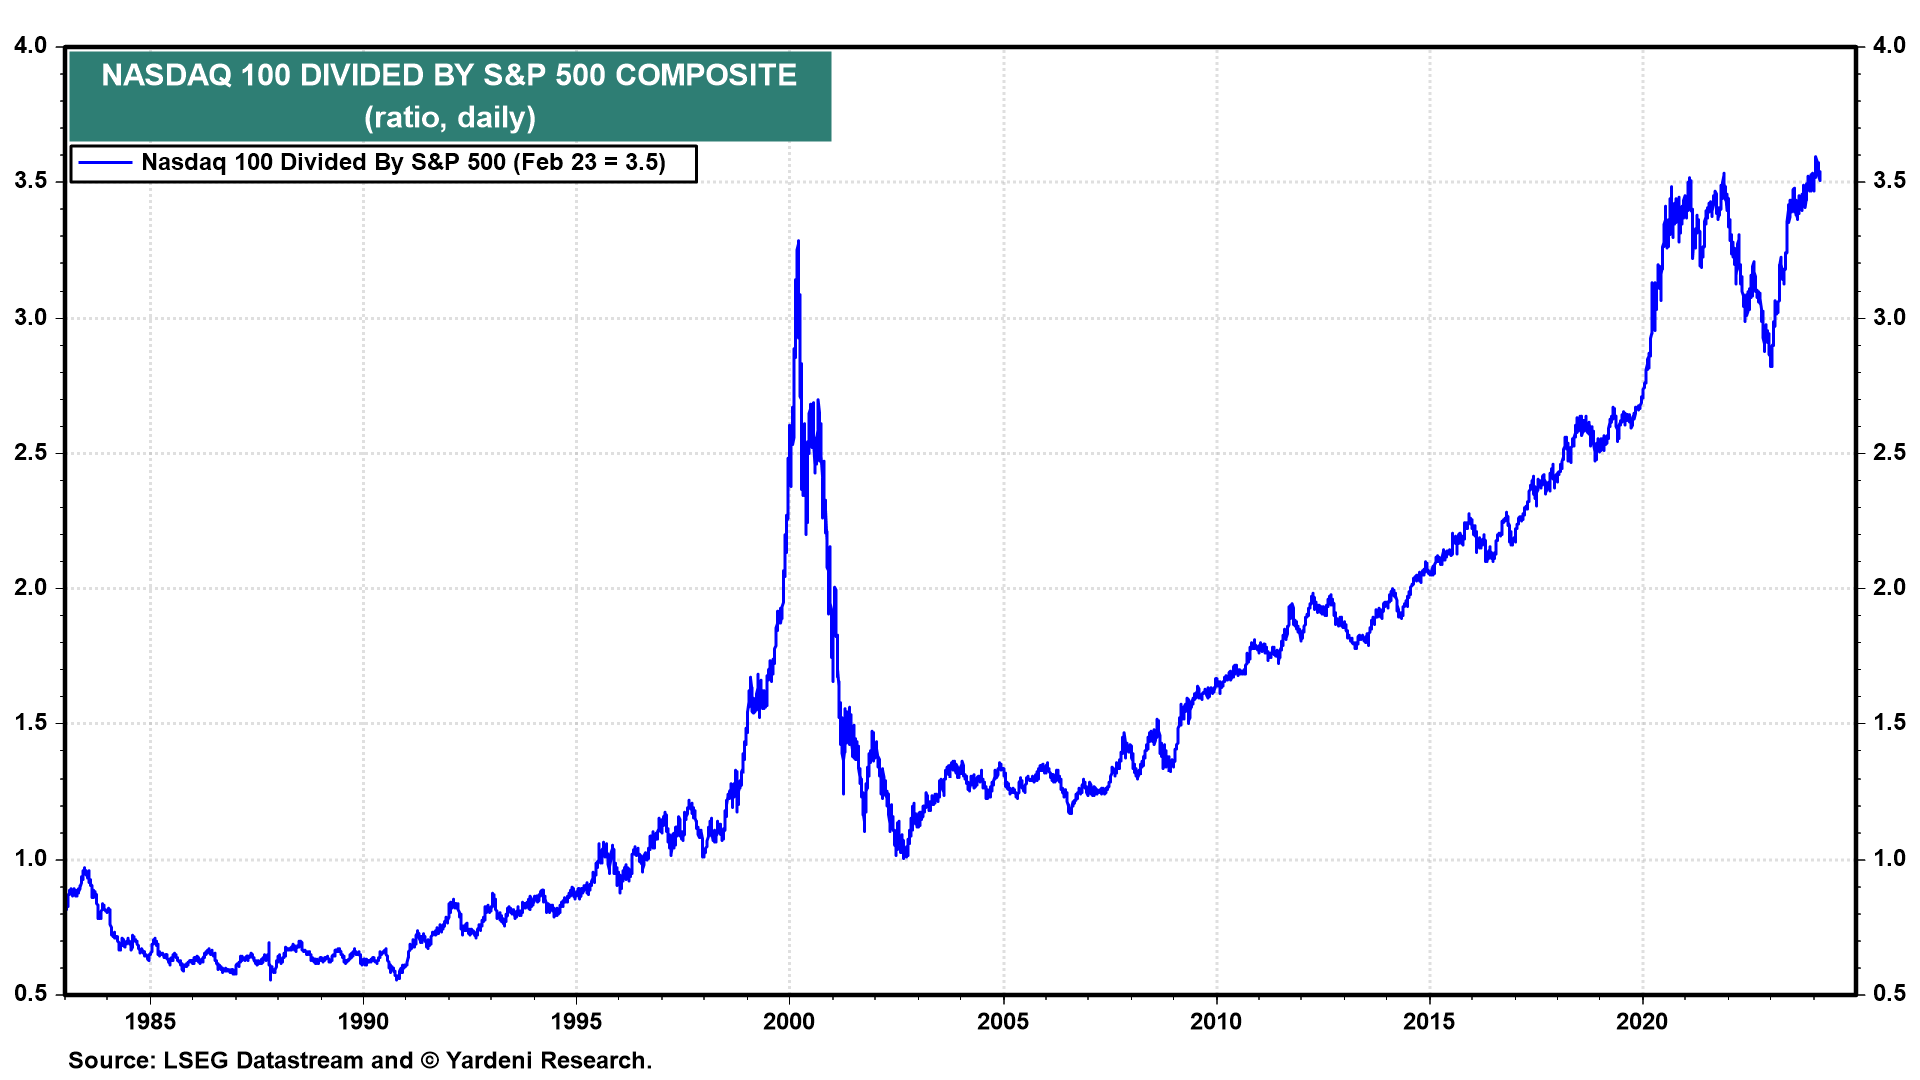
Leading the S&P 500 higher back then was the Nasdaq 100 (Fig. 1 and Fig. 2). That seems to be happening again since the ratio of the latter to the former bottomed on January 5, 2023 (Fig. 3 below). We are especially intrigued by the similarity between the recent vertical ascent of Nvidia’s stock price and that of Cisco’s stock price during the late 1990s (Fig. 4).
Indeed, Melissa and I are considering the possibility that the second half of the 1990s’ script might be the most likely scenario for the FFR over the rest of the current decade. Back then, stock prices soared. The positive wealth effect boosted economic growth. Inflation was subdued by rapid productivity growth, implying that the inflation adjusted FFR was in line with the so-called "neutral" FFR. Consider the following:
(1/8) Real GDP. The 1990s started with a brief and shallow recession (Fig. 5 below). Real GDP growth rebounded quickly from a low of -1.0% y/y during Q1-1991 to its historical average of 3.1%. During the second half of the decade, it fluctuated around 4.0%-5.0%.
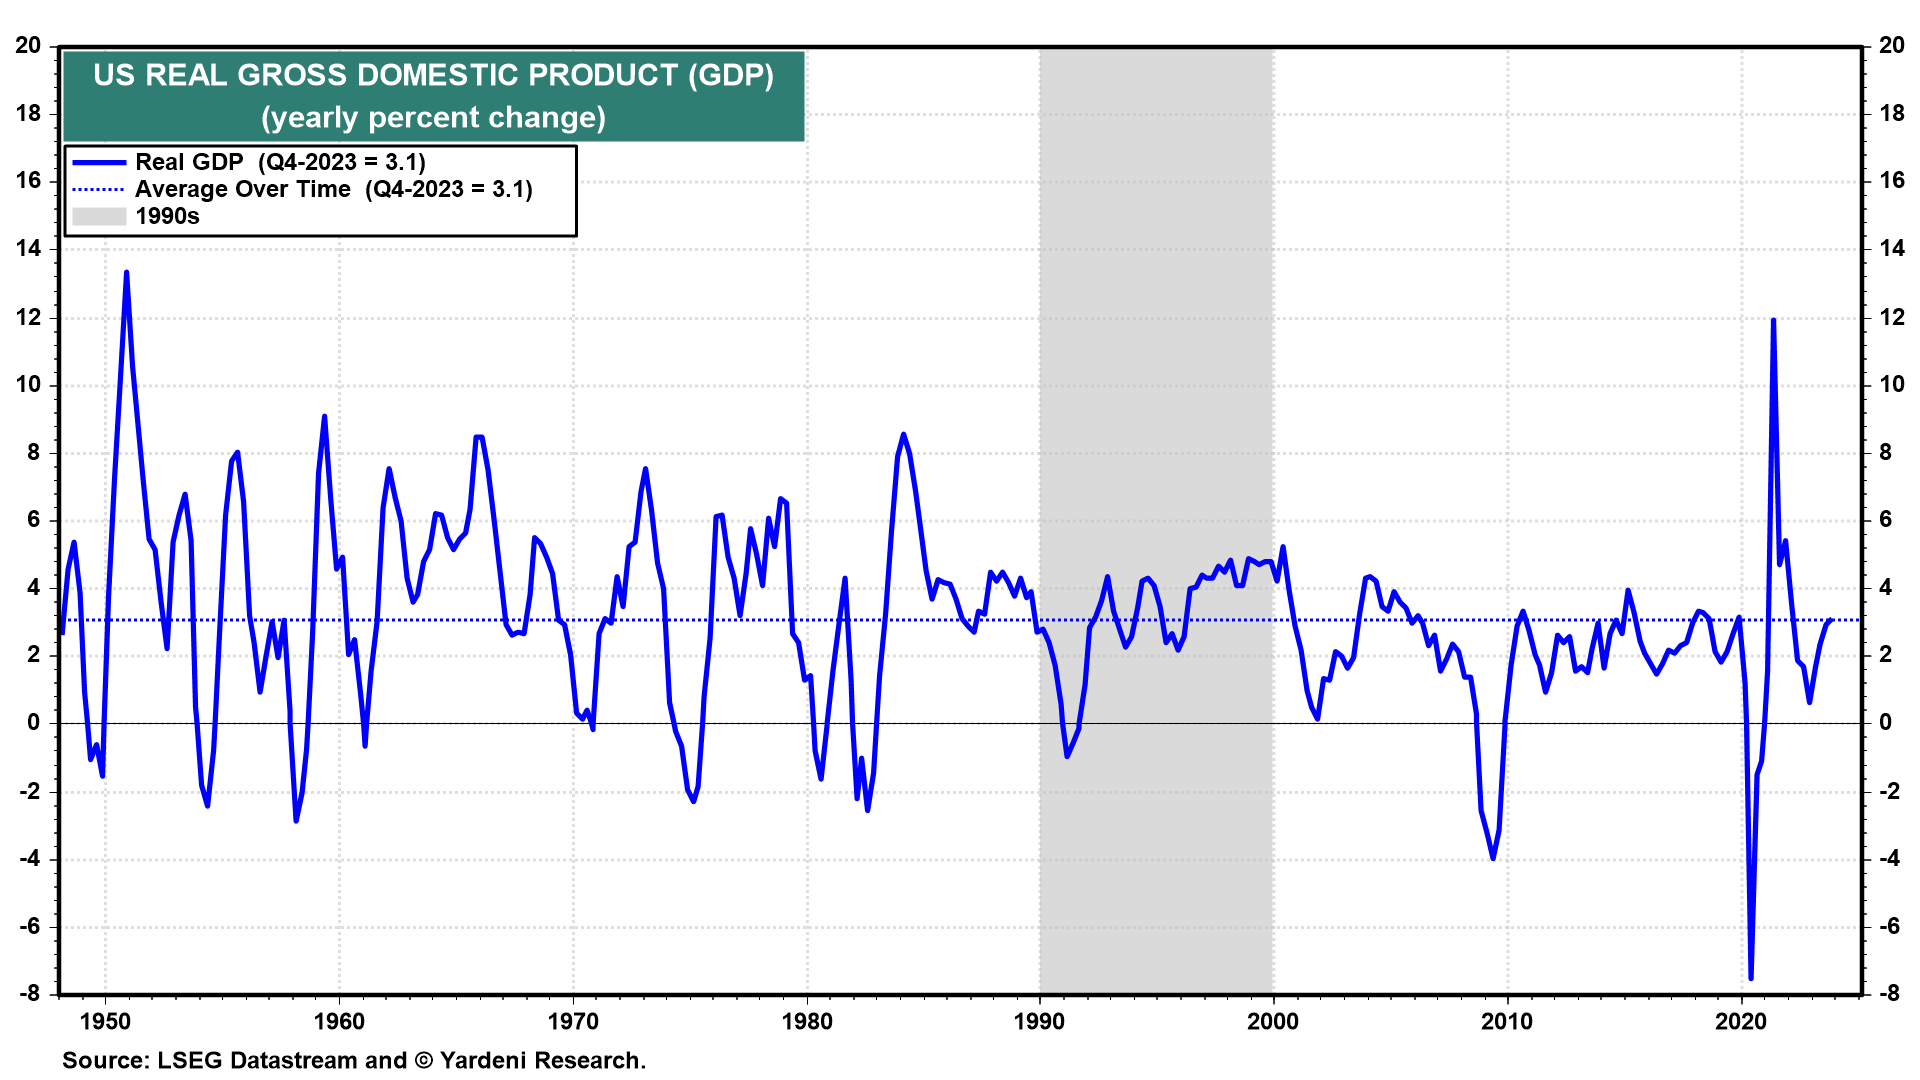
The current decade started out with a brief but severe recession because of the pandemic lockdown in early 2020. It was followed by a very strong recovery. By Q4-2023, real GDP was back to the 3.1% historical average growth rate. Debbie and I expect to see real GDP growing at or above this rate through the end of the decade thanks to solid productivity growth.
(2/8) Productivity. The growth rate of nonfarm business productivity was very volatile during the first half of the 1990s (Fig. 6 below). It soared to 5.0% y/y during Q1-1992. Then it plunged to -0.6% during Q4-1993. During the second half of the decade, it was back over its historical average of 2.0%. It peaked at 4.2% by the end of the decade.
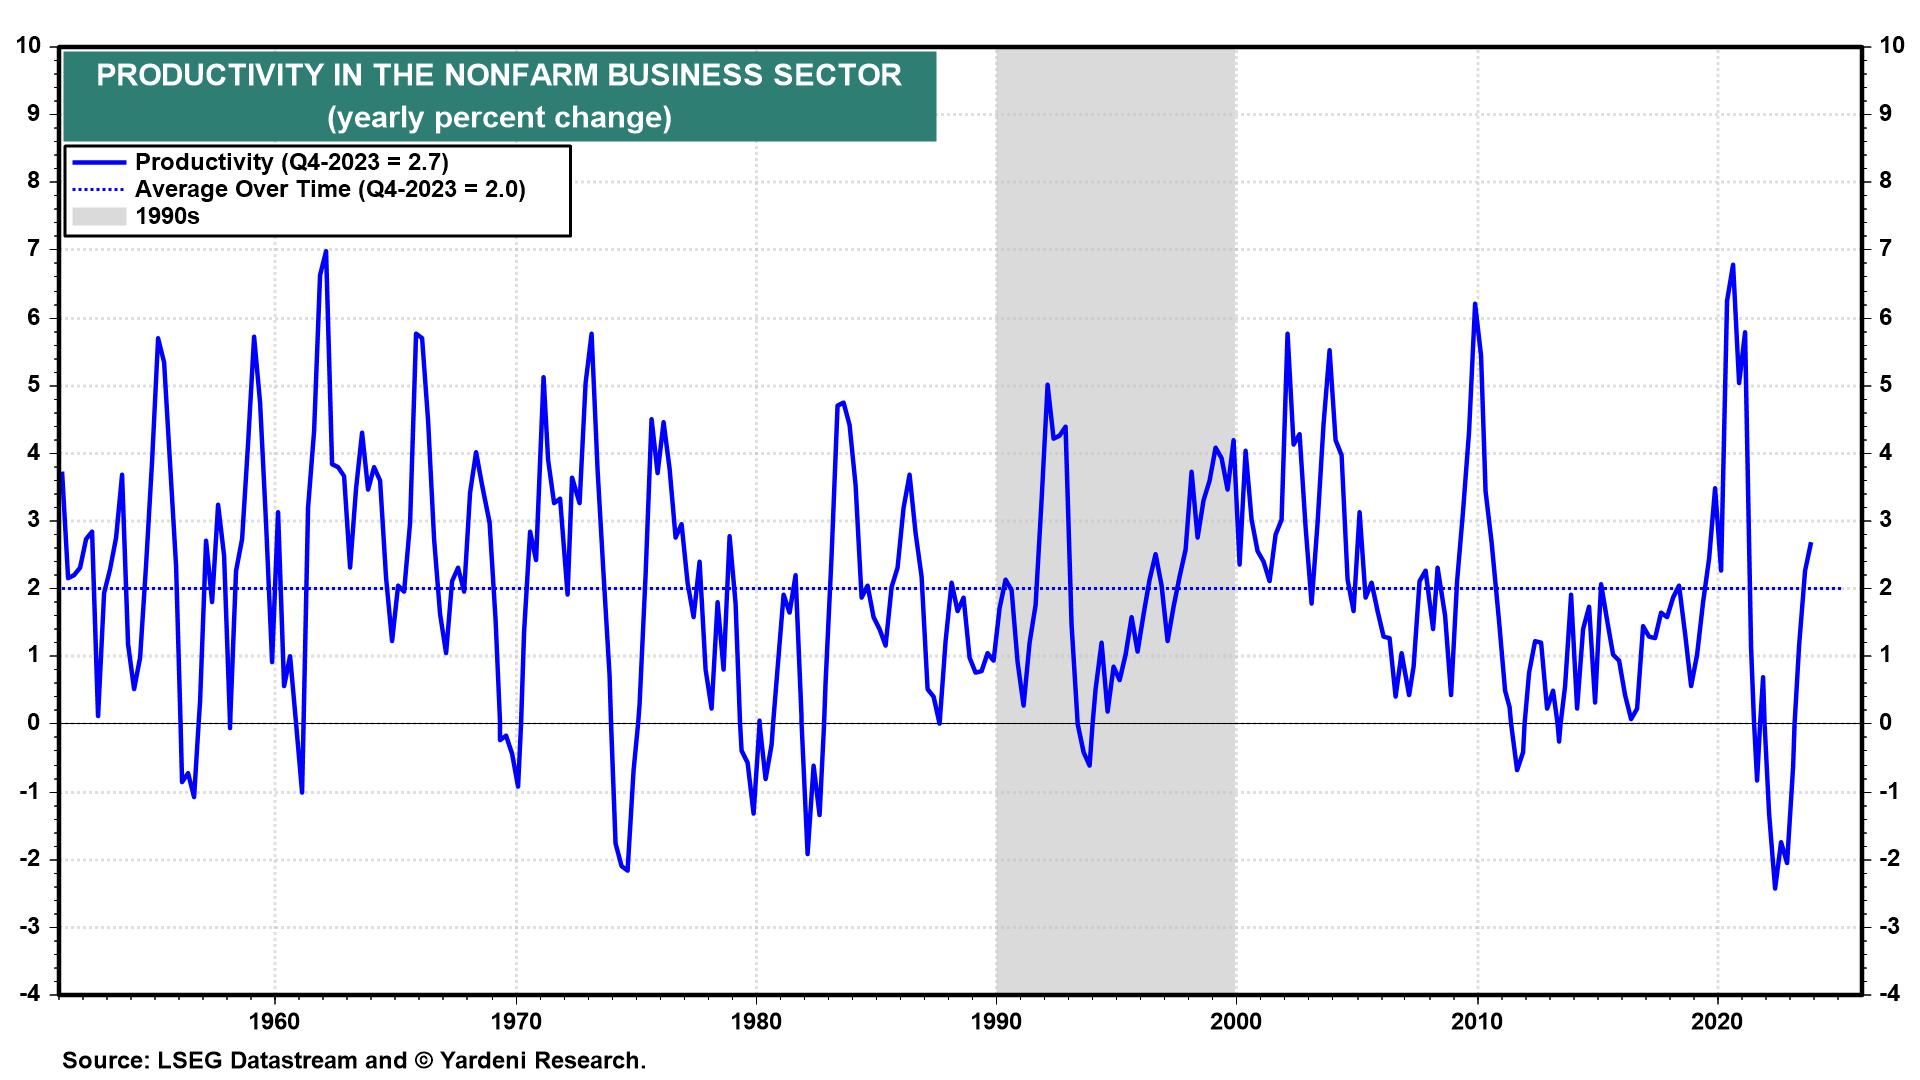
During the first half of the current decade, productivity growth has also fluctuated widely, from 6.8% during Q3-2020 to -2.4% during Q2-2022. But it was back above its historical average at 2.7% at the end of last year. In our Roaring 2020s scenario, we are expecting a productivity growth boom during the second half of the current decade much like the one during the second half of the 1990s.
(3/8) Inflation. In addition to boosting the growth rate of real GDP, productivity (along with hourly compensation) determines unit labor costs (ULC)—the y/y percent change of which is the underlying inflation rate. is the underlying inflation rate. Both ULC and CPI inflation rates fell significantly during the first half of the 1990s (Fig. 7 below). The former dropped from 5.1% in Q4-1990 to -0.2% in Q2-1994. Over this same period, the CPI inflation rate declined from 6.3% to 2.3%. Over the remainder of the decade, it fell to a low of 1.4% in March 1998 and ended the decade at 2.7%.
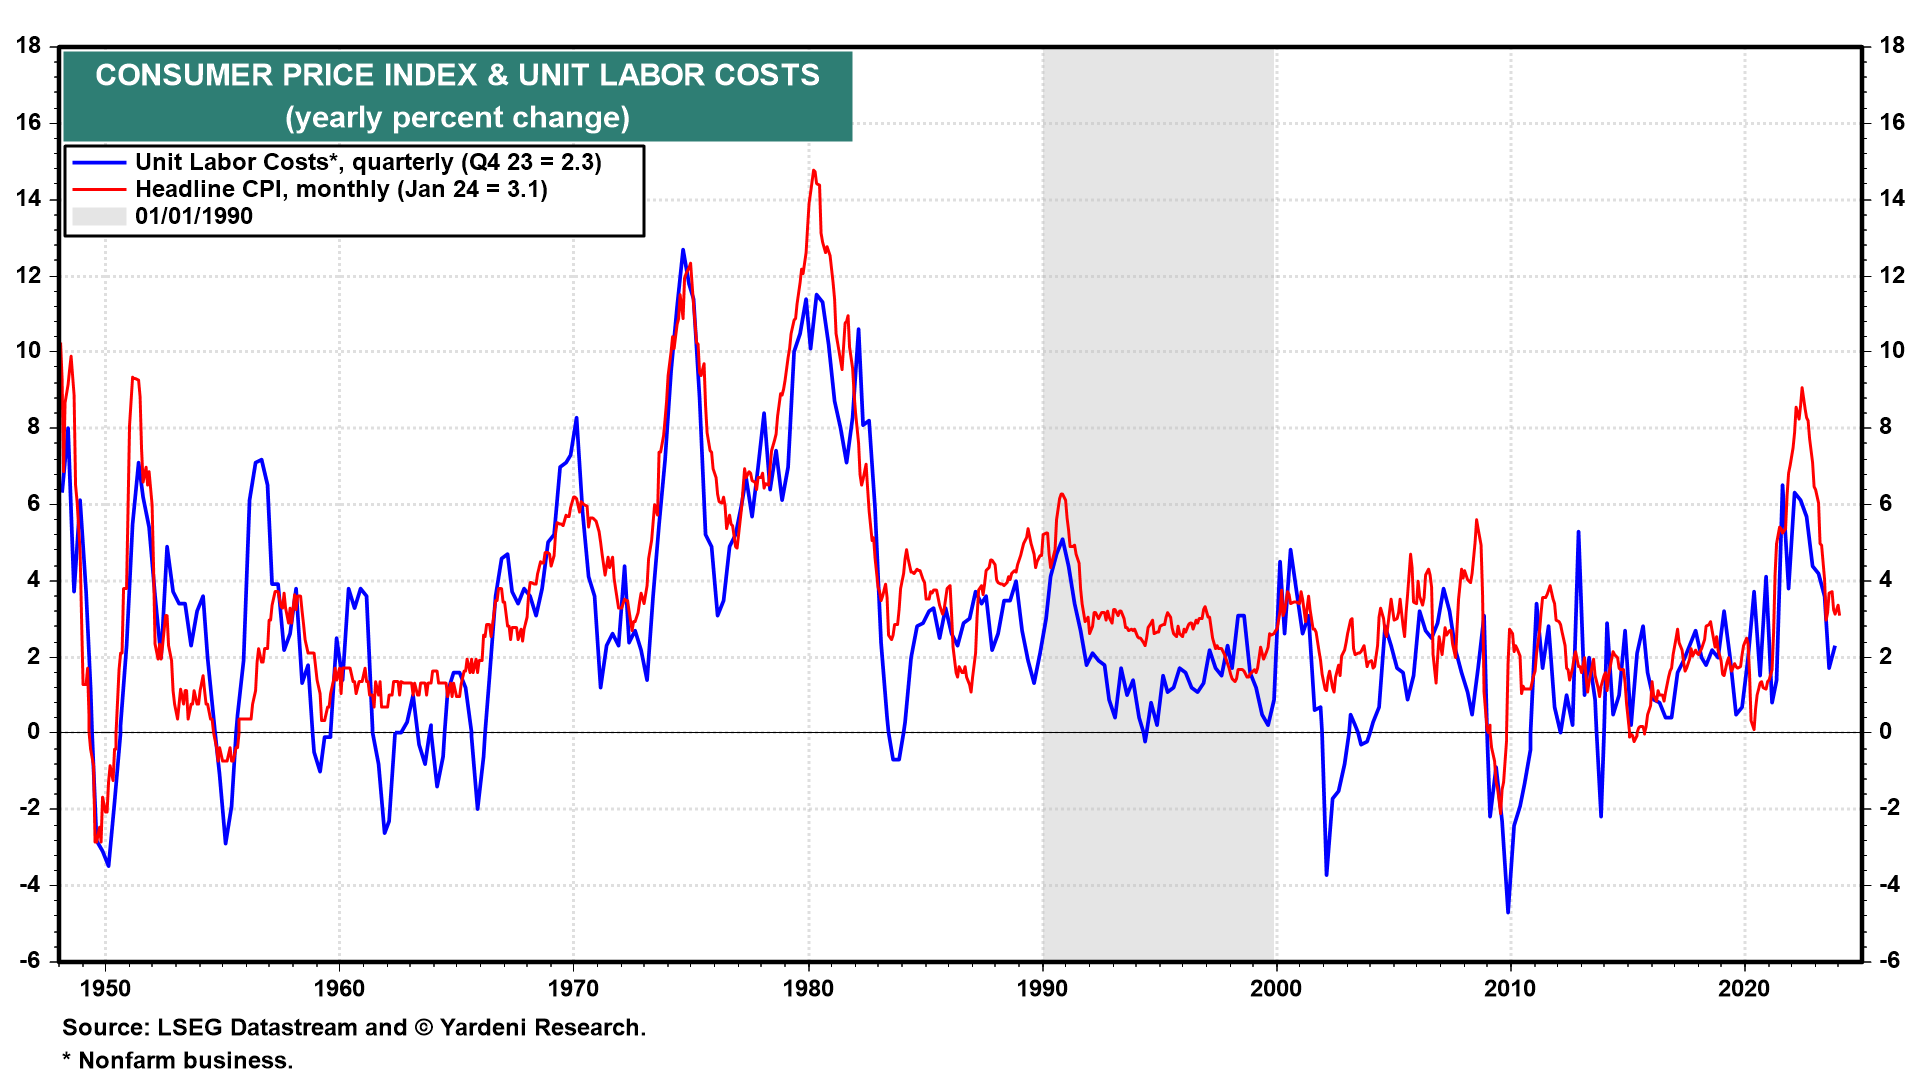
In our Roaring 2020s scenario, CPI inflation continues to moderate along with ULC inflation as productivity growth continues to improve. ULC inflation was down to 2.3% y/y during Q4-2023 from 6.3% during Q1-2022. If productivity growth climbs to 3.5%-4.5% over the rest of this decade, as we expect, that would boost the growth rate of real GDP while keeping a tight lid on inflation.