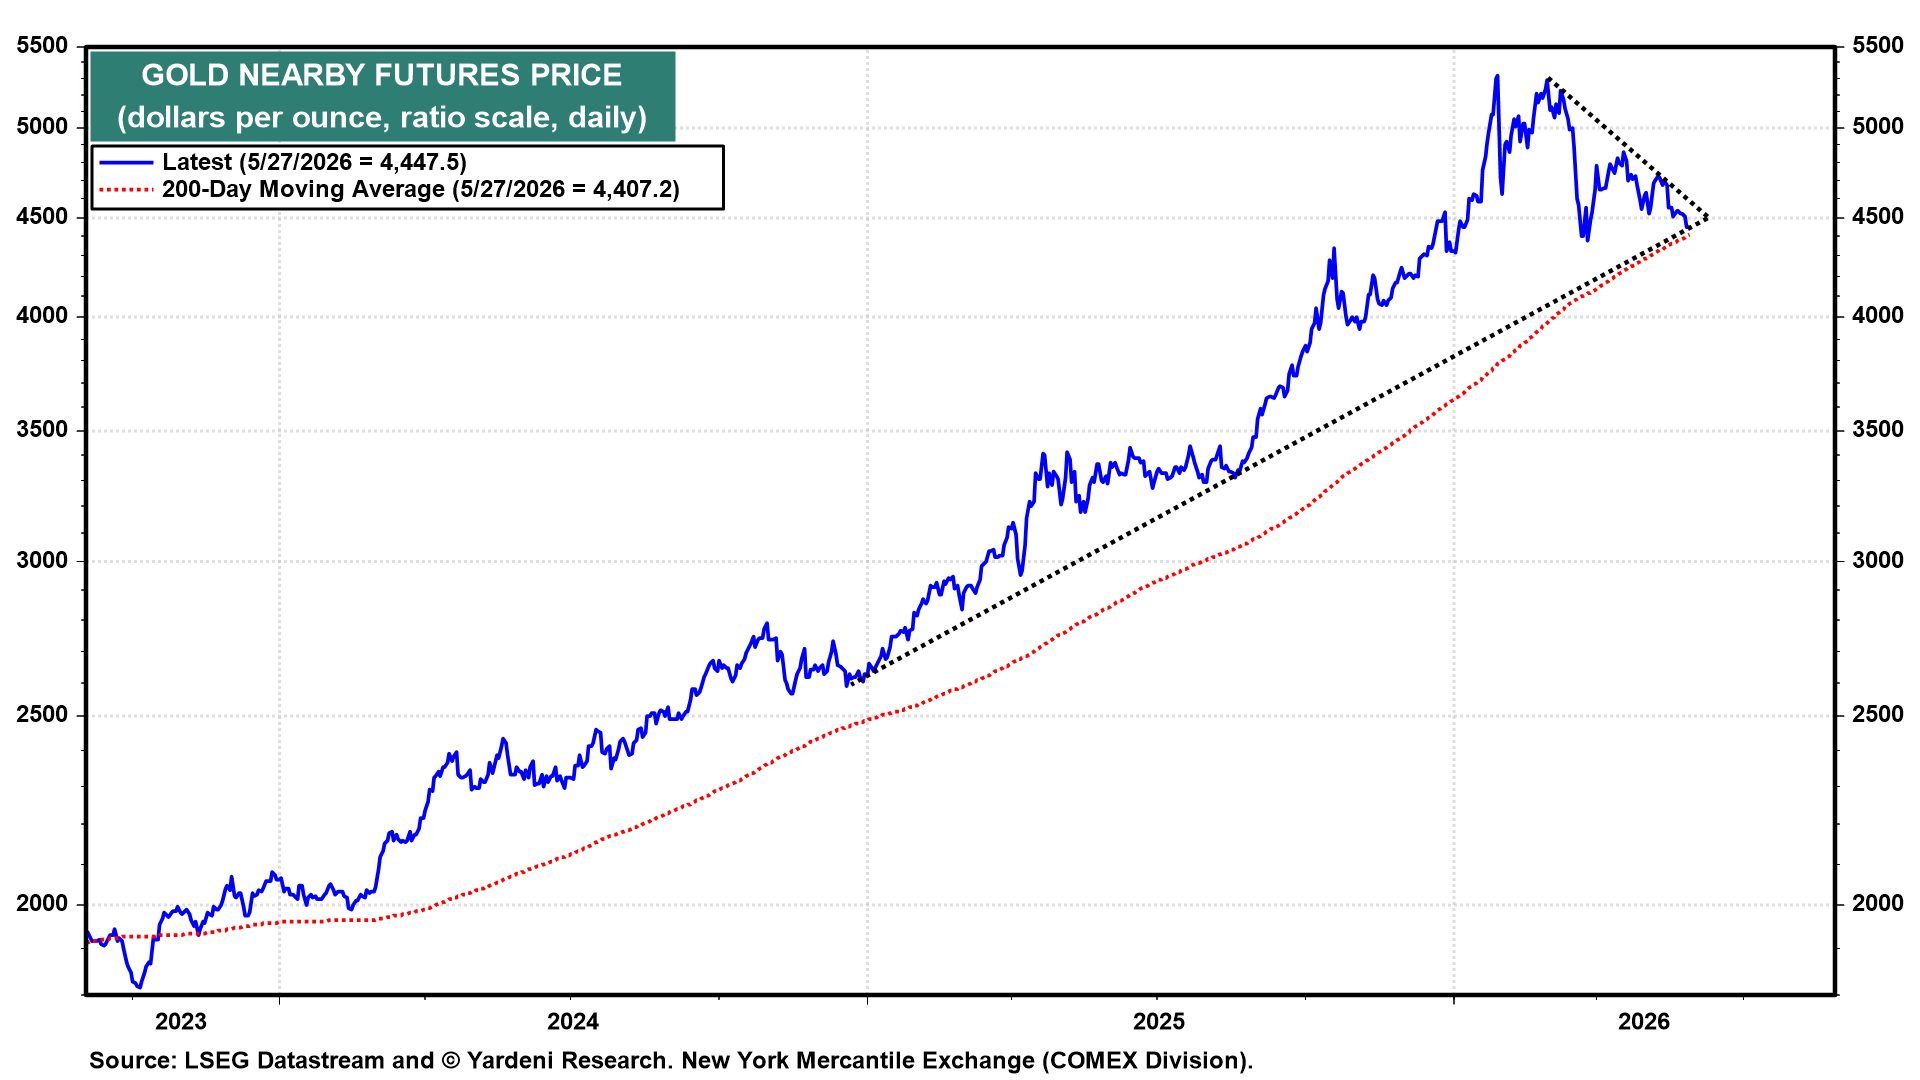
This is a quick QuickTakes on gold. Its price seems to be holding above its 200-day moving average on news that Iran and the US have reached an agreement on a memorandum of understanding to extend their ceasefire for 60 days, but President Donald Trump has yet to approve it, according to Reuters. The price of gold peaked at a record $5,318 per ounce on January 29 (chart). It fell sharply during the war in the Middle East in March to $4,375 near the end of the month. It rebounded through mid-April when a ceasefire was in place. Now it seems to be testing its March 26 low, its 200-day moving average, and its intermediate uptrend line. That's quite a bit of support, which should hold, in our opinion.
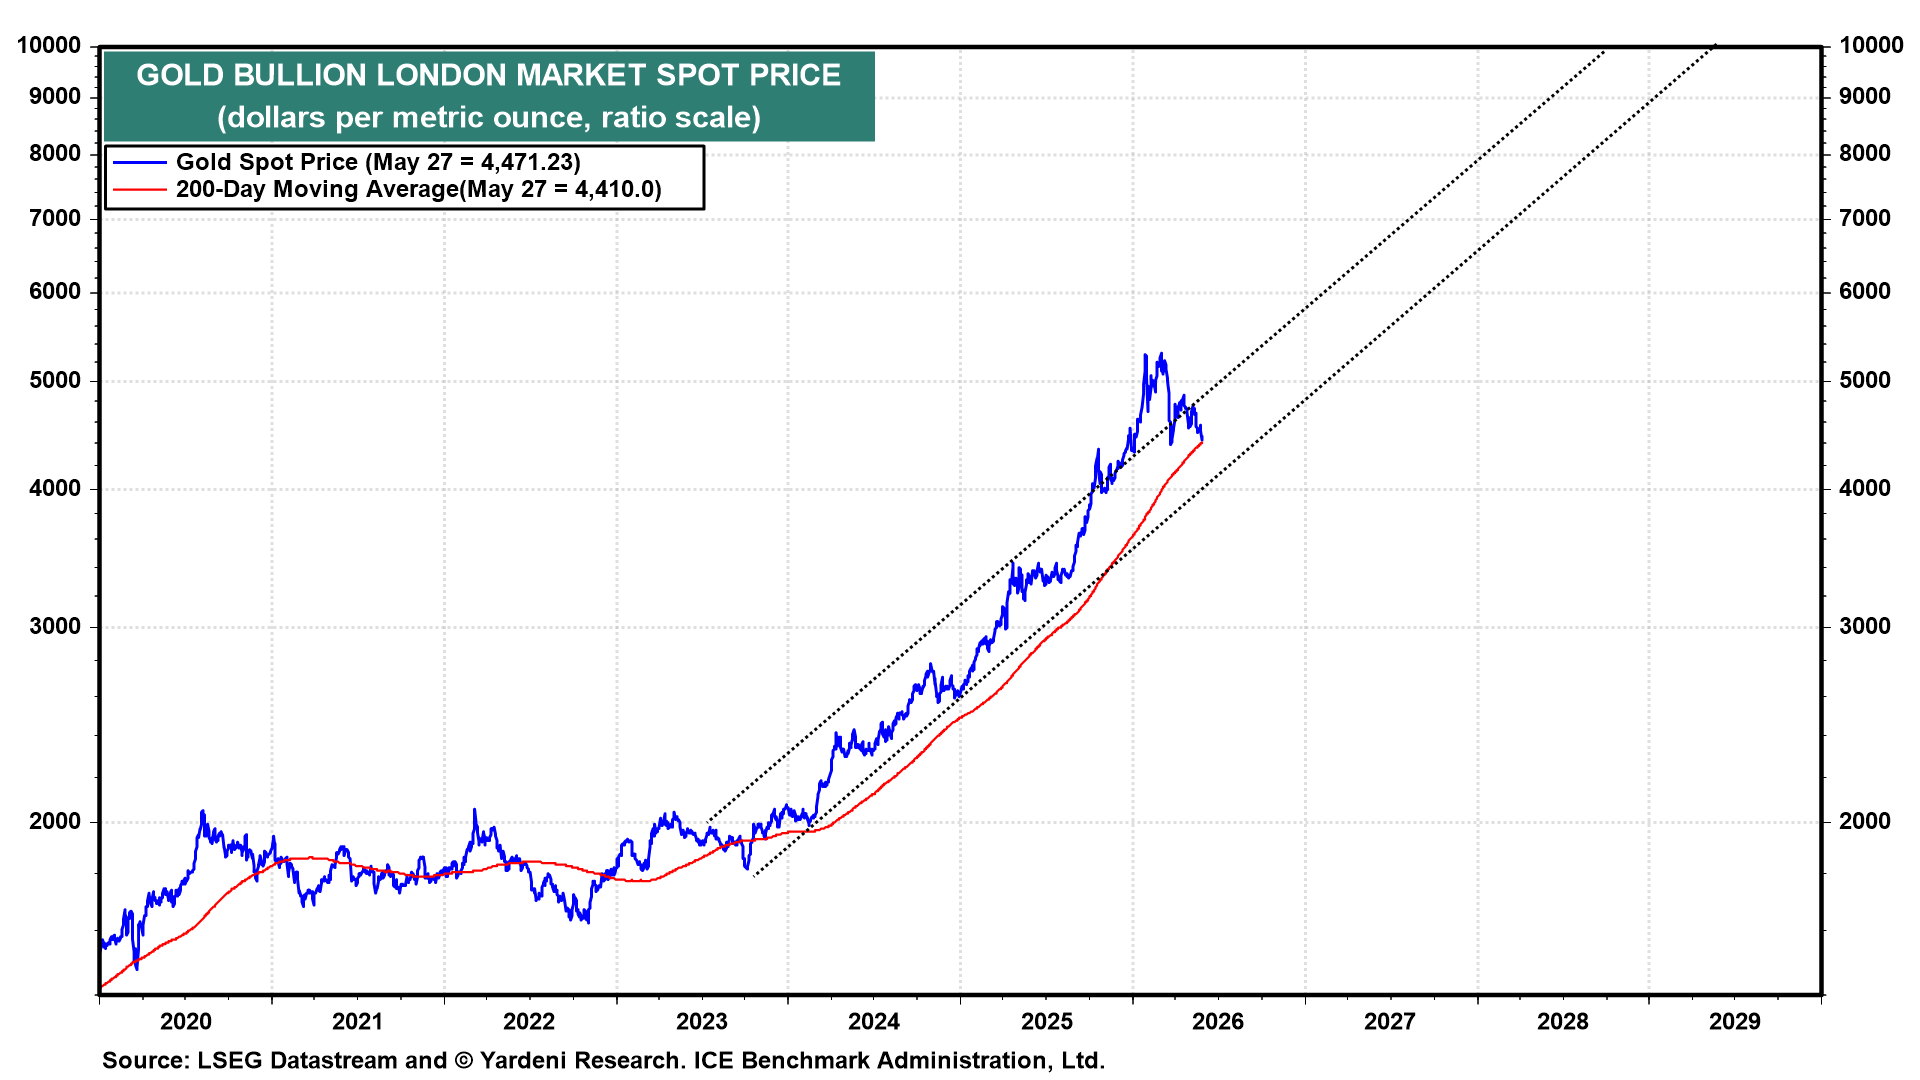
The drop in the price since the end of January has put it back within an upward-trending channel that began in late 2023 (chart). Traders may be anticipating that a 60-day extension of the ceasefire would confirm that neither side wants to resume the shooting war.
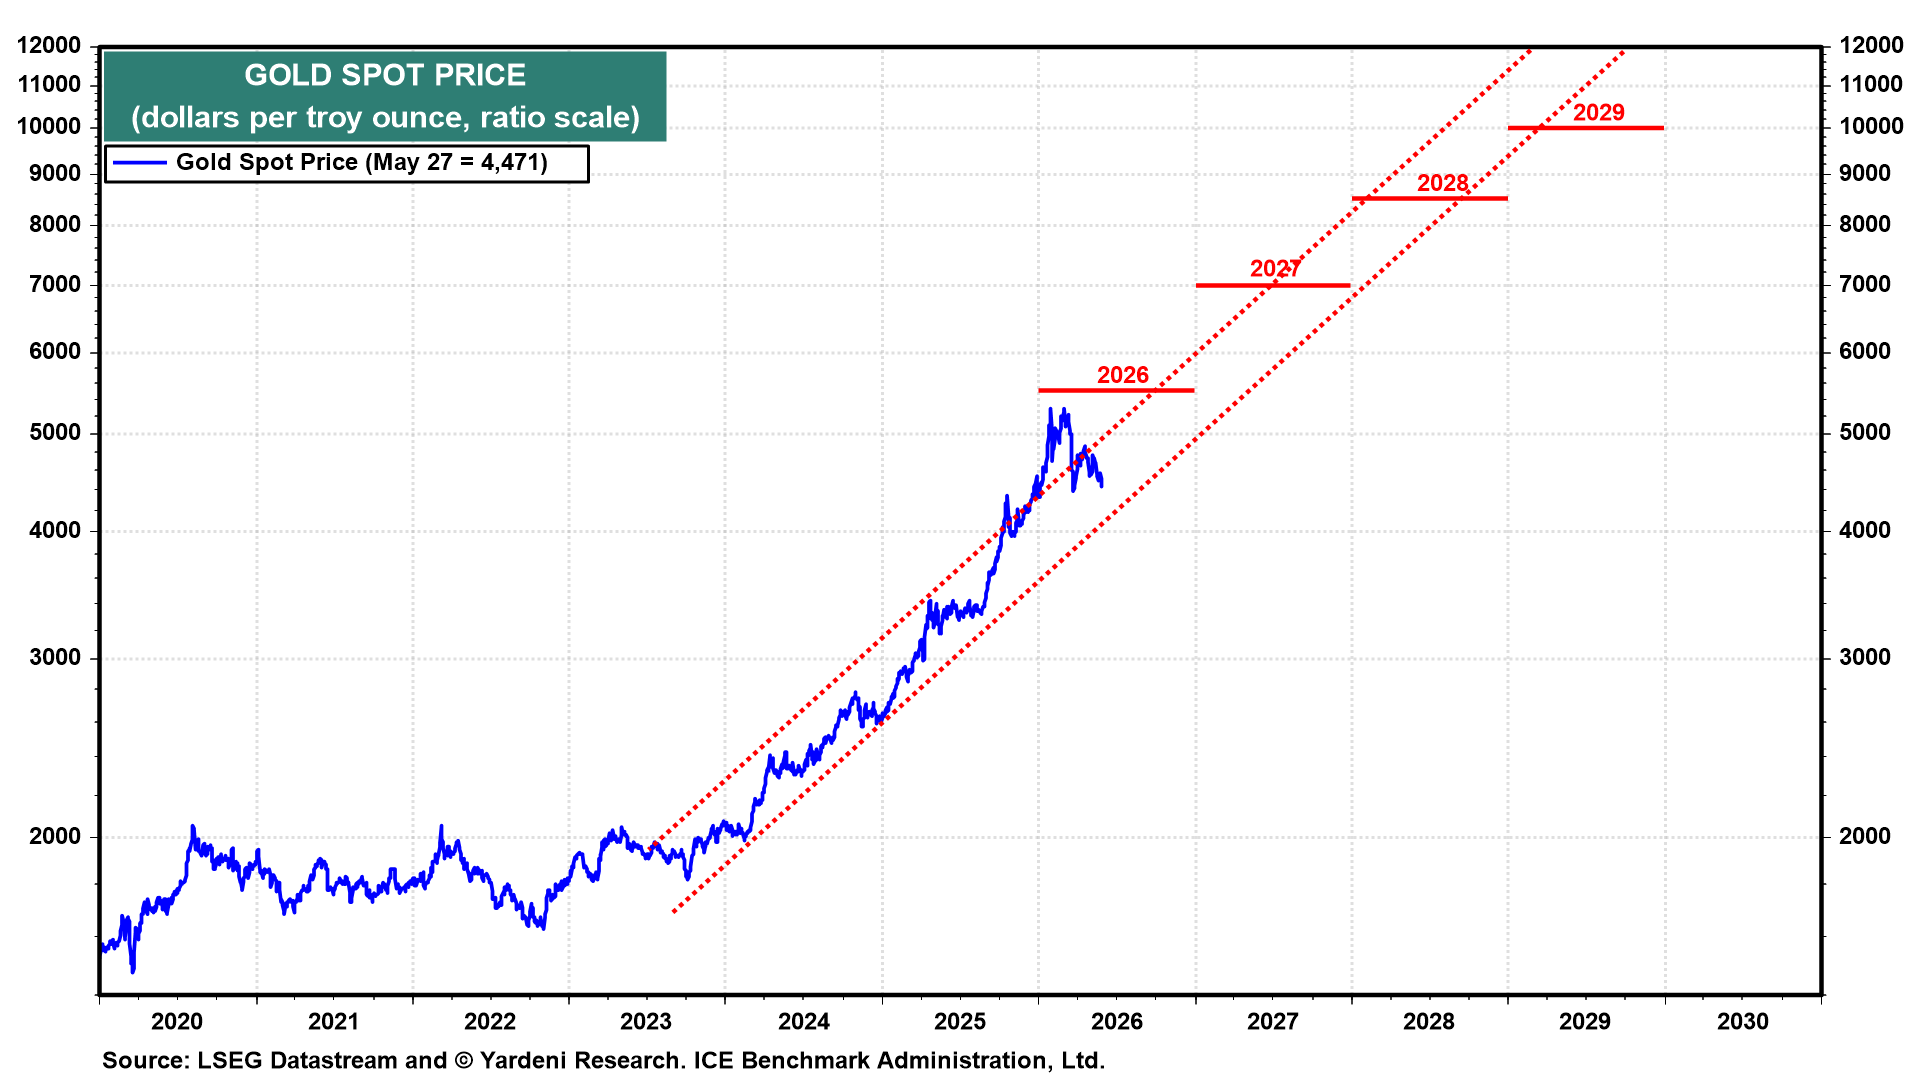
The rally in gold should resume once the war is over. We are currently targeting the gold price to reach $5,500 by the end of this year, and $10,000 by the end of the decade. The war boosted the dollar's foreign-exchange value, which is bearish for gold. It also put upward pressure on interest rates, which is also bearish for gold. A few central banks were forced to sell their gold reserves to support their currencies as higher oil prices weighed on their currencies. The Fed is likely to turn more hawkish during the summer. That could stall any serious rally attempt by gold traders. The end of the war should diminish those bearish factors.
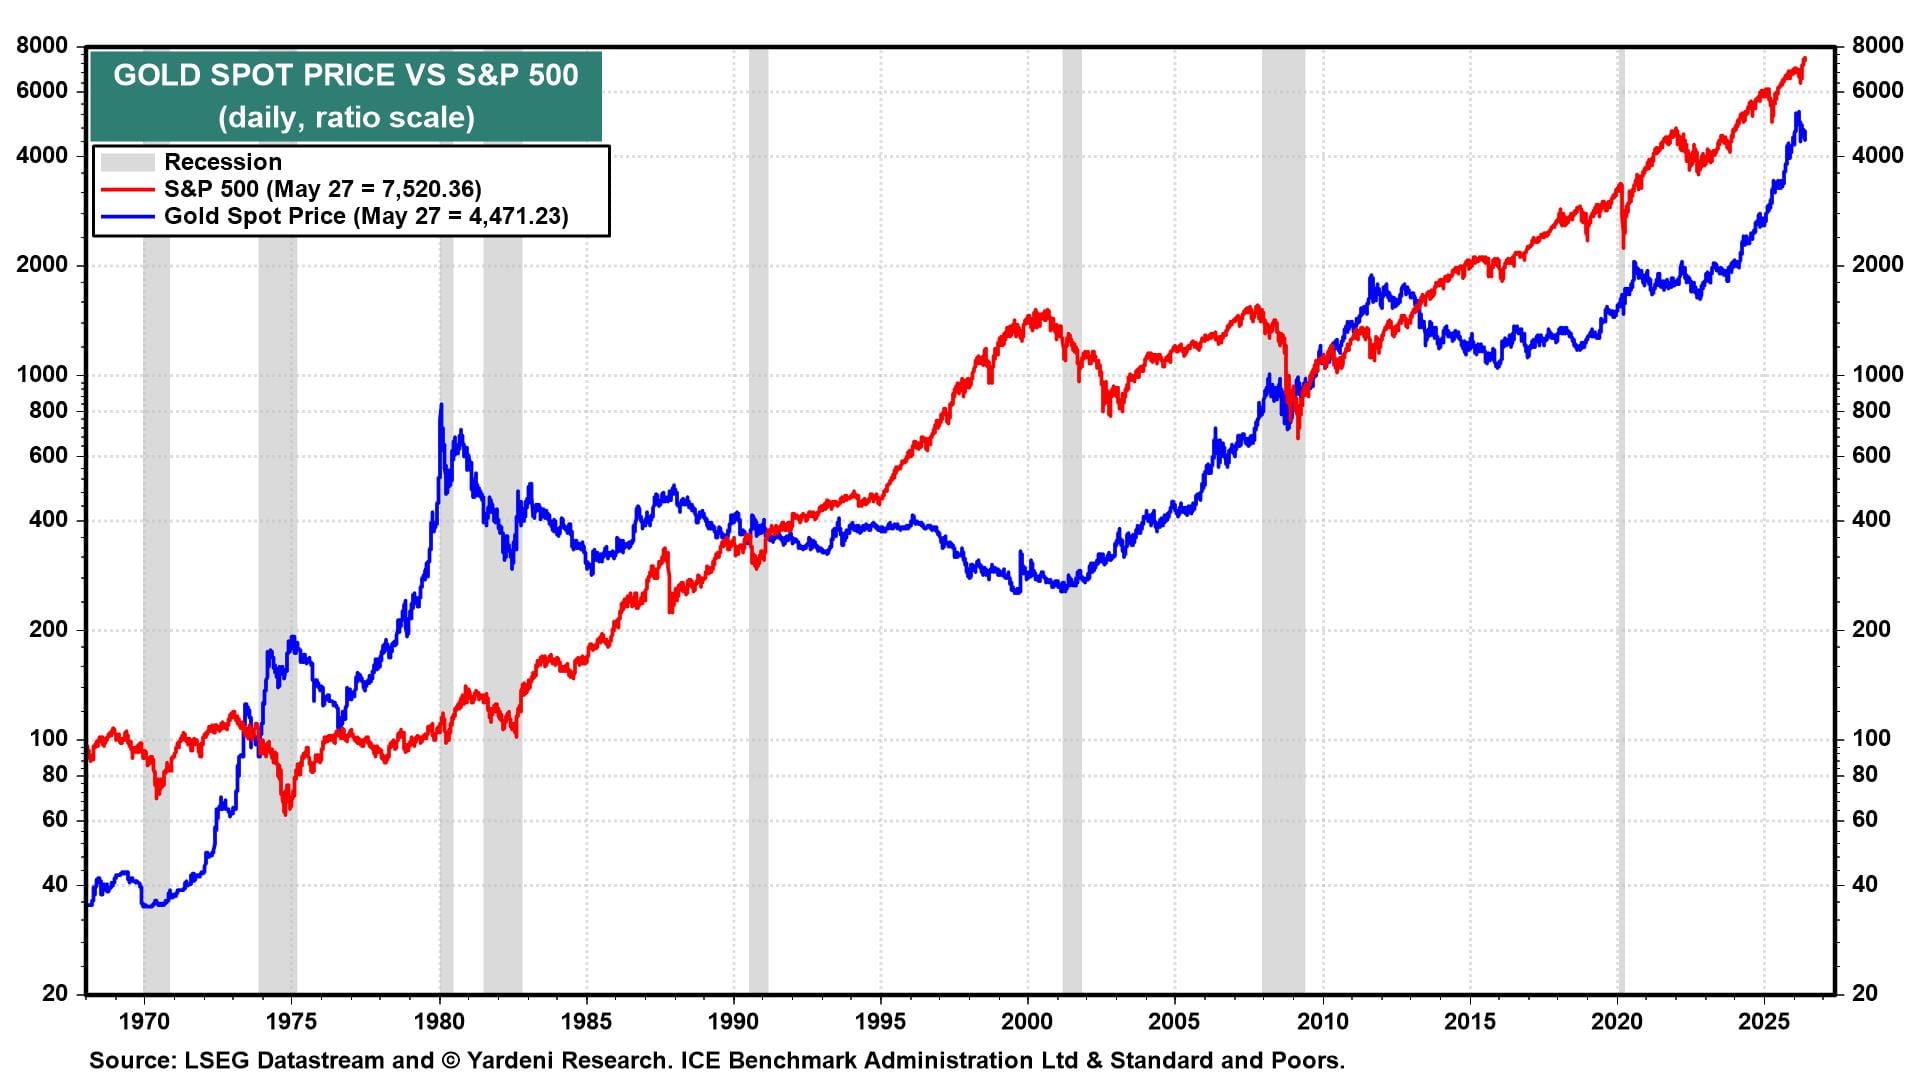
Our long-term bullish stance on gold rests on the idea that the S&P 500 could rally to 10,000 by the end of the decade. We expect that along the way, investors will rebalance into other assets, including gold. The S&P 500 and the price of gold tend to be inversely correlated on a cyclical basis, but in sync on a trend basis (chart). So if and when the S&P 500 reaches 10,000, then the price of gold should reach $10,000.