


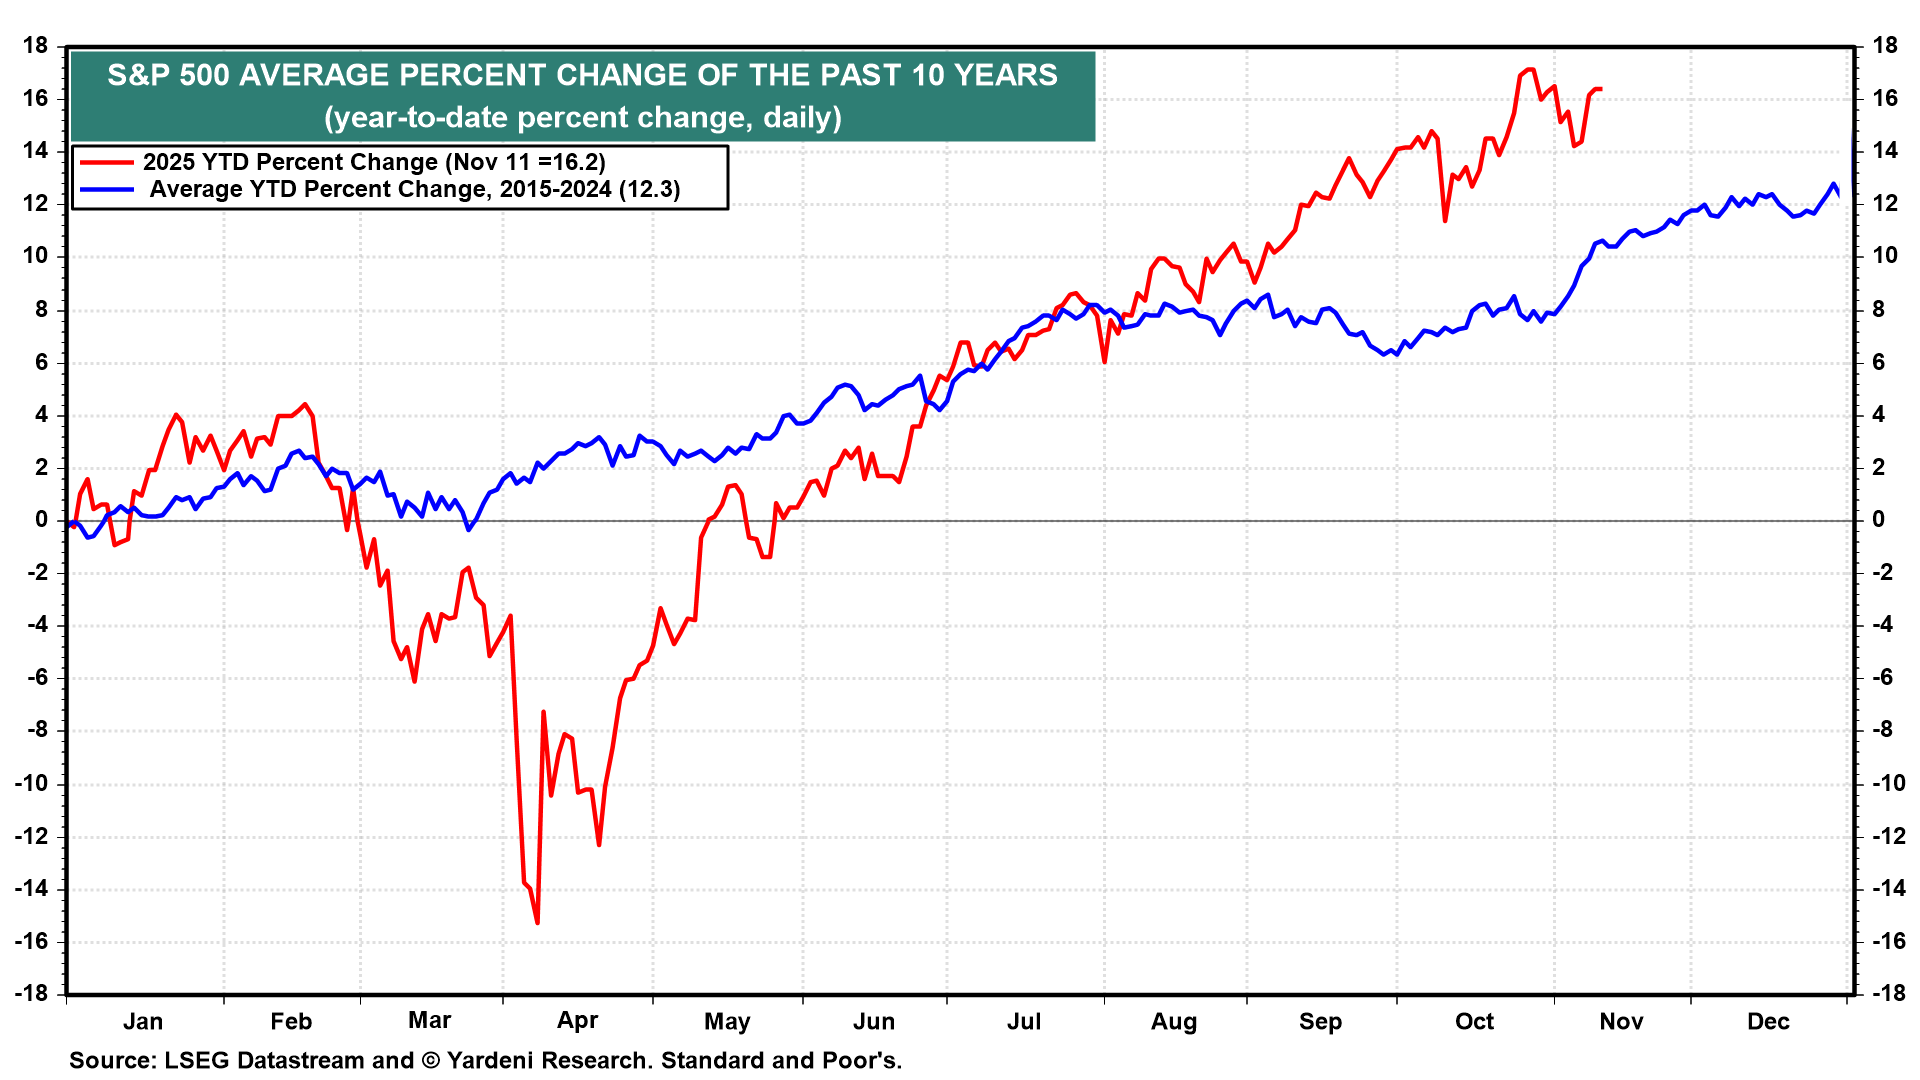
The S&P 500 closed at 5881.63 at the end of last year. It is up 16.2% since then to 6846.61 today (chart). That beats the average 10.4% ytd gain at this point in the year over the past 10 years. The average annual increase over the past 10 years was 12.3%. If this turns out to be an average year, then the S&P 500 would fall 3.5% over the rest of 2025 to 6605.07. On the other hand, it would have to gain just 2.2% to hit our 7000 target at the end of this year, which would be a 19% gain for the year.
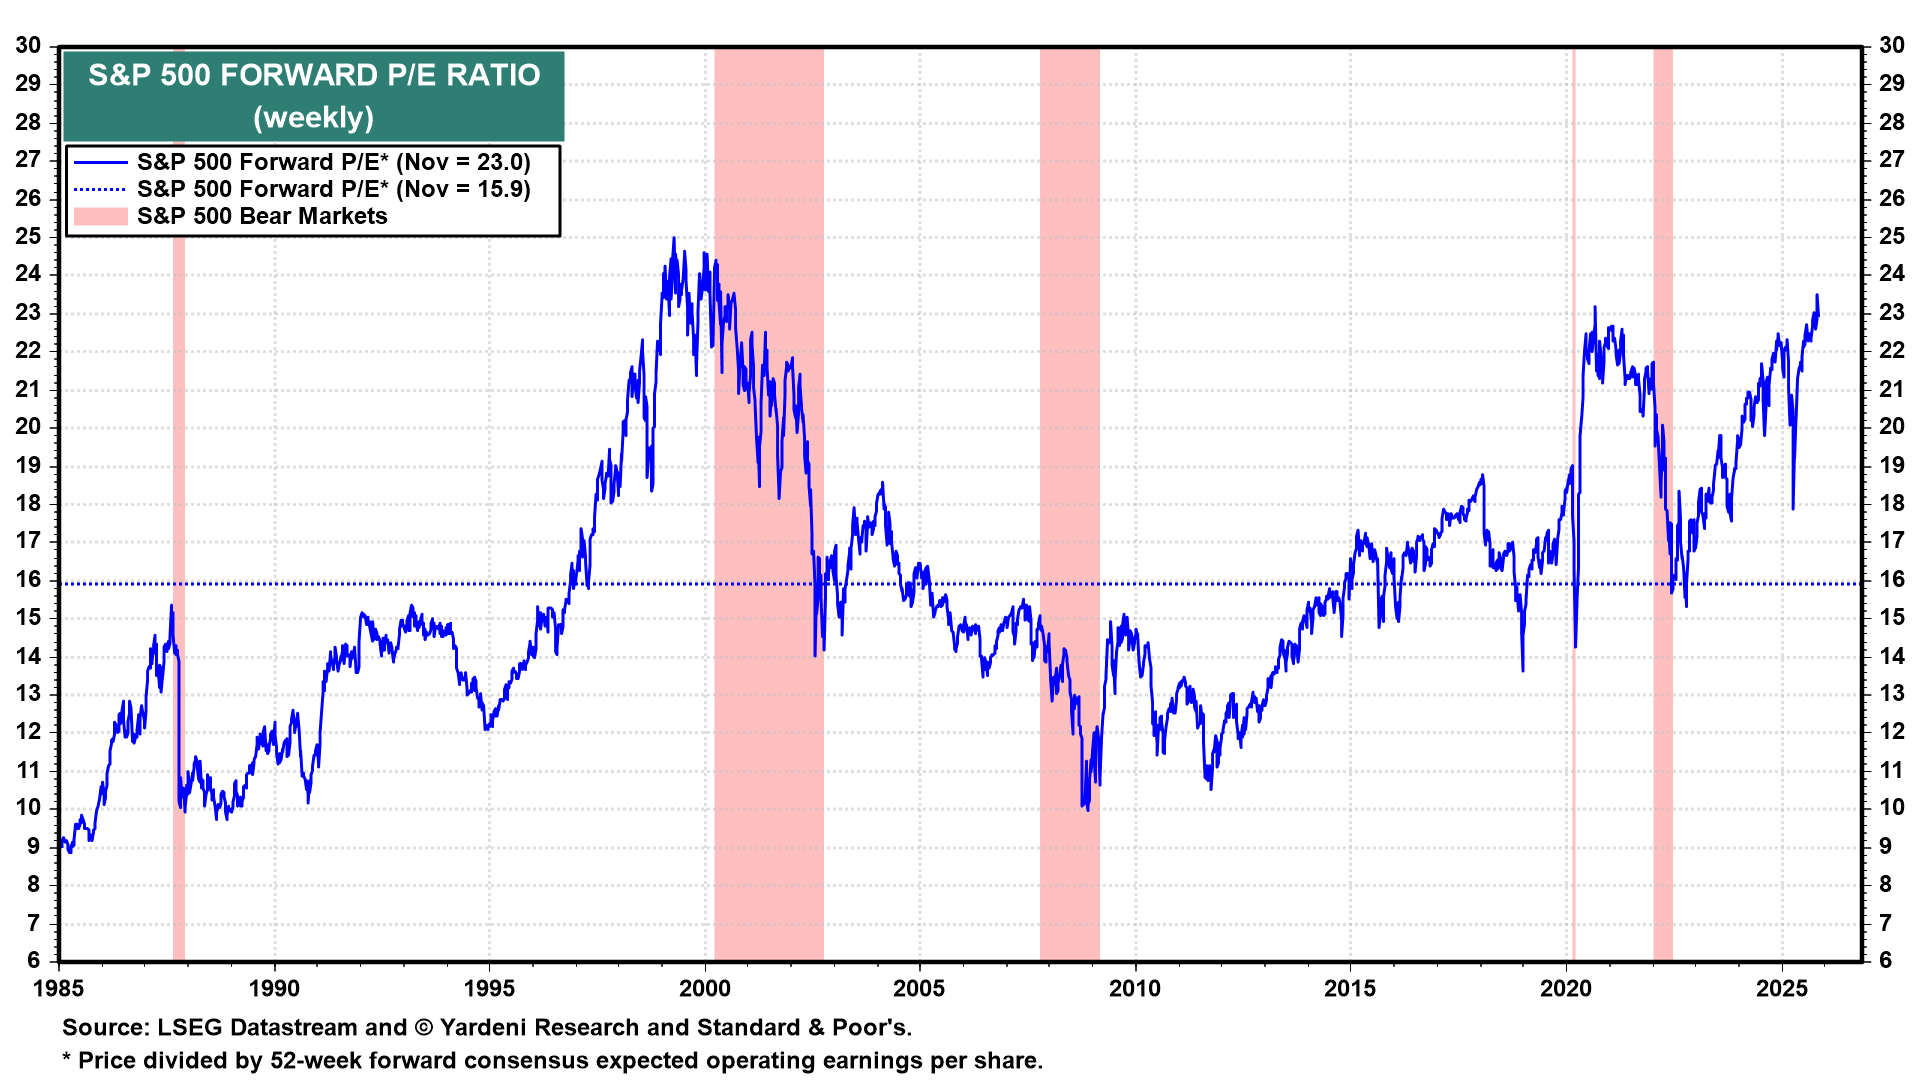
The index could reach our 7000 year-end target before year-end and could be even higher by the end of this year. The S&P 500 has been driven up primarily by forward earnings this year. The index's forward P/E started the year at 22.4 and is up just 2.7% since then to 23.0 currently. It would have to increase to just 23.6 to hit our 7000 target.
We are still targeting 7700 by the end of next year. That's our base case scenario with a 50% subjective probability. We see a 30% chance of a meltup and a 20% chance of a meltdown through the end of next year. We are tracking the meltup scenario by monitoring the ratio of the S&P 100 to the S&P 500 (chart). The rapid rise in this ratio over the past couple of years is reminiscent of what happened during the Tech Bubble of the late 1990s.