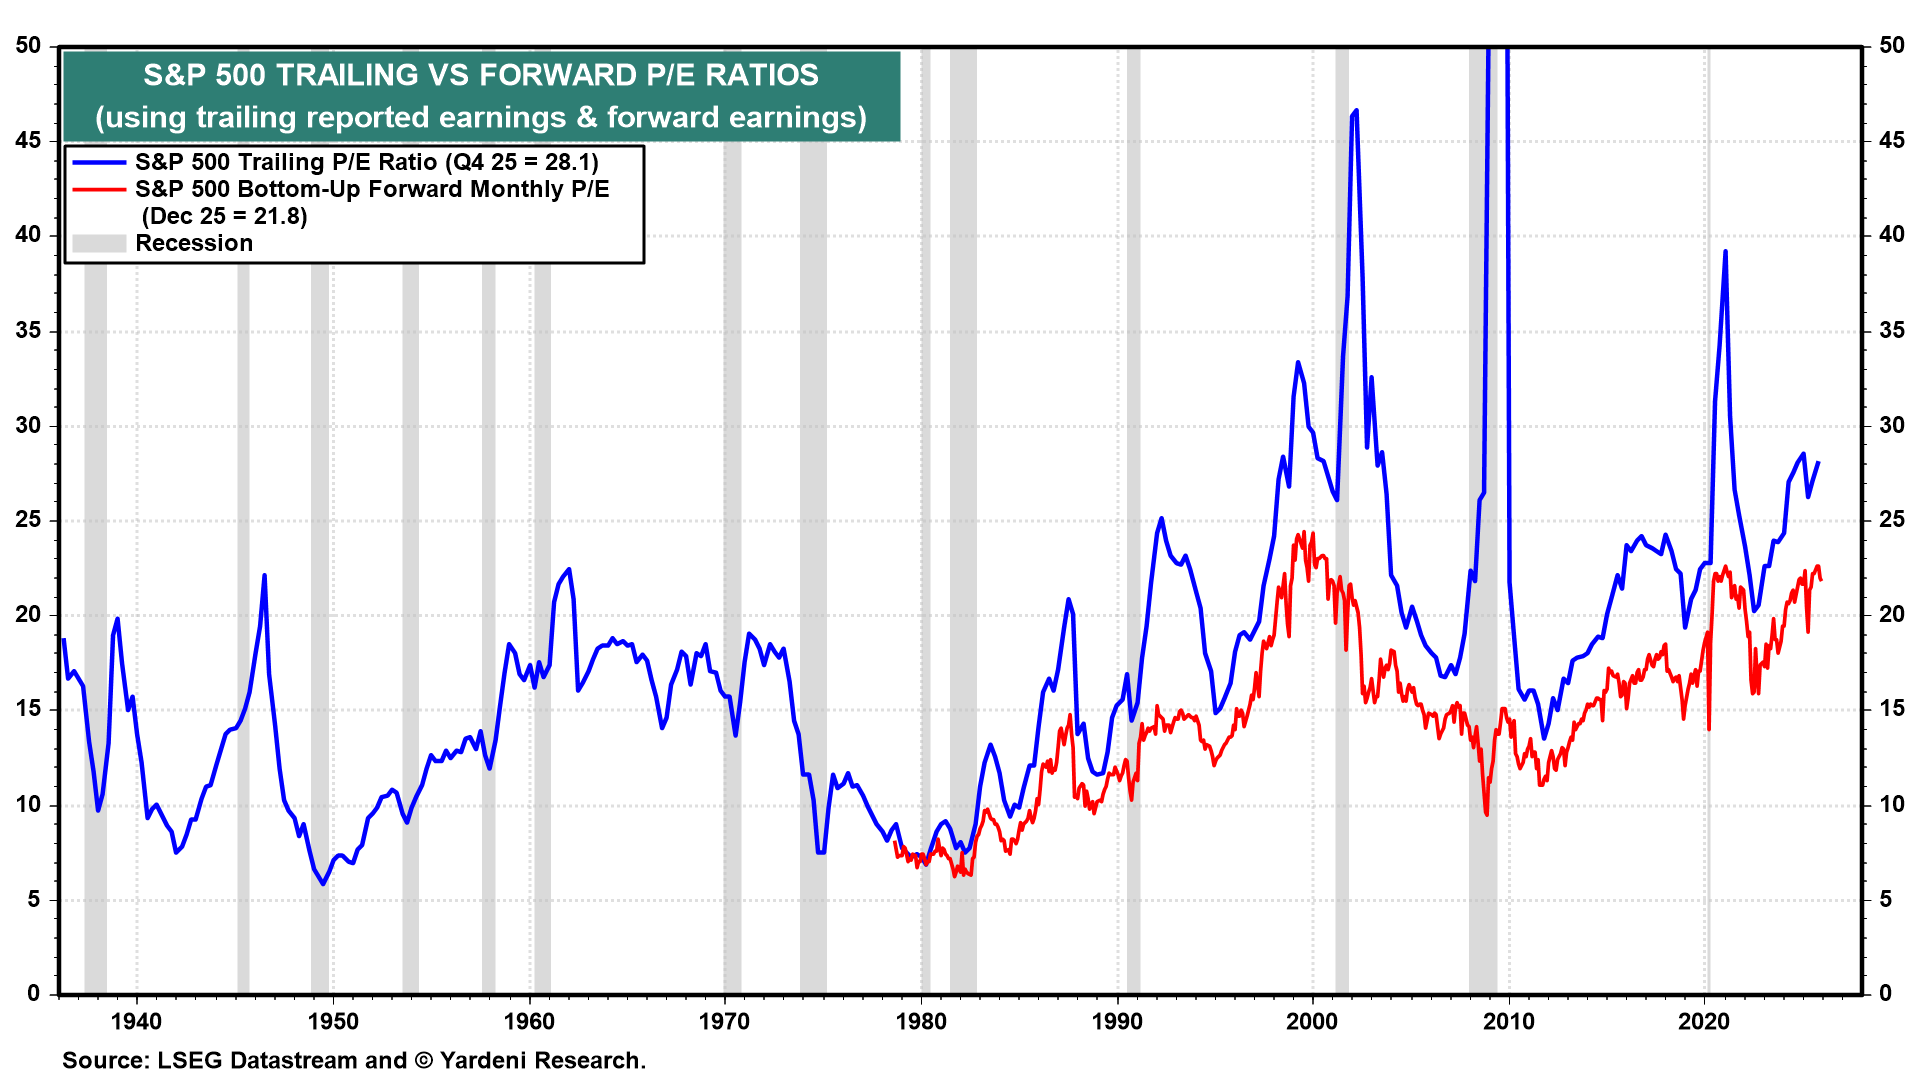
Goldman Sachs has been pushing the view that the stock market's return over the next 10 years is likely to be very low, at only around 3% per year. We disagree. Admittedly, there's logic to that forecast: The forward P/E of the S&P 500 is currently historically high at 21.8 (chart). That suggests that it's likely to fall in the coming years, thereby reducing the upside for the S&P 500—especially if there's another recession over the next 10 years. Past recessions have always caused both earnings and the valuation multiple to crater. In other words, the market is priced for perfection, which increases the odds of disappointing returns.
But we observe that the forward P/E was even higher than it is now on September 1, 2020, just five months after the end of the pandemic lockdown. It was 23.2 back then. Yet the S&P 500 has nearly doubled; it's up 94% since then. That's despite a bear market in 2022.
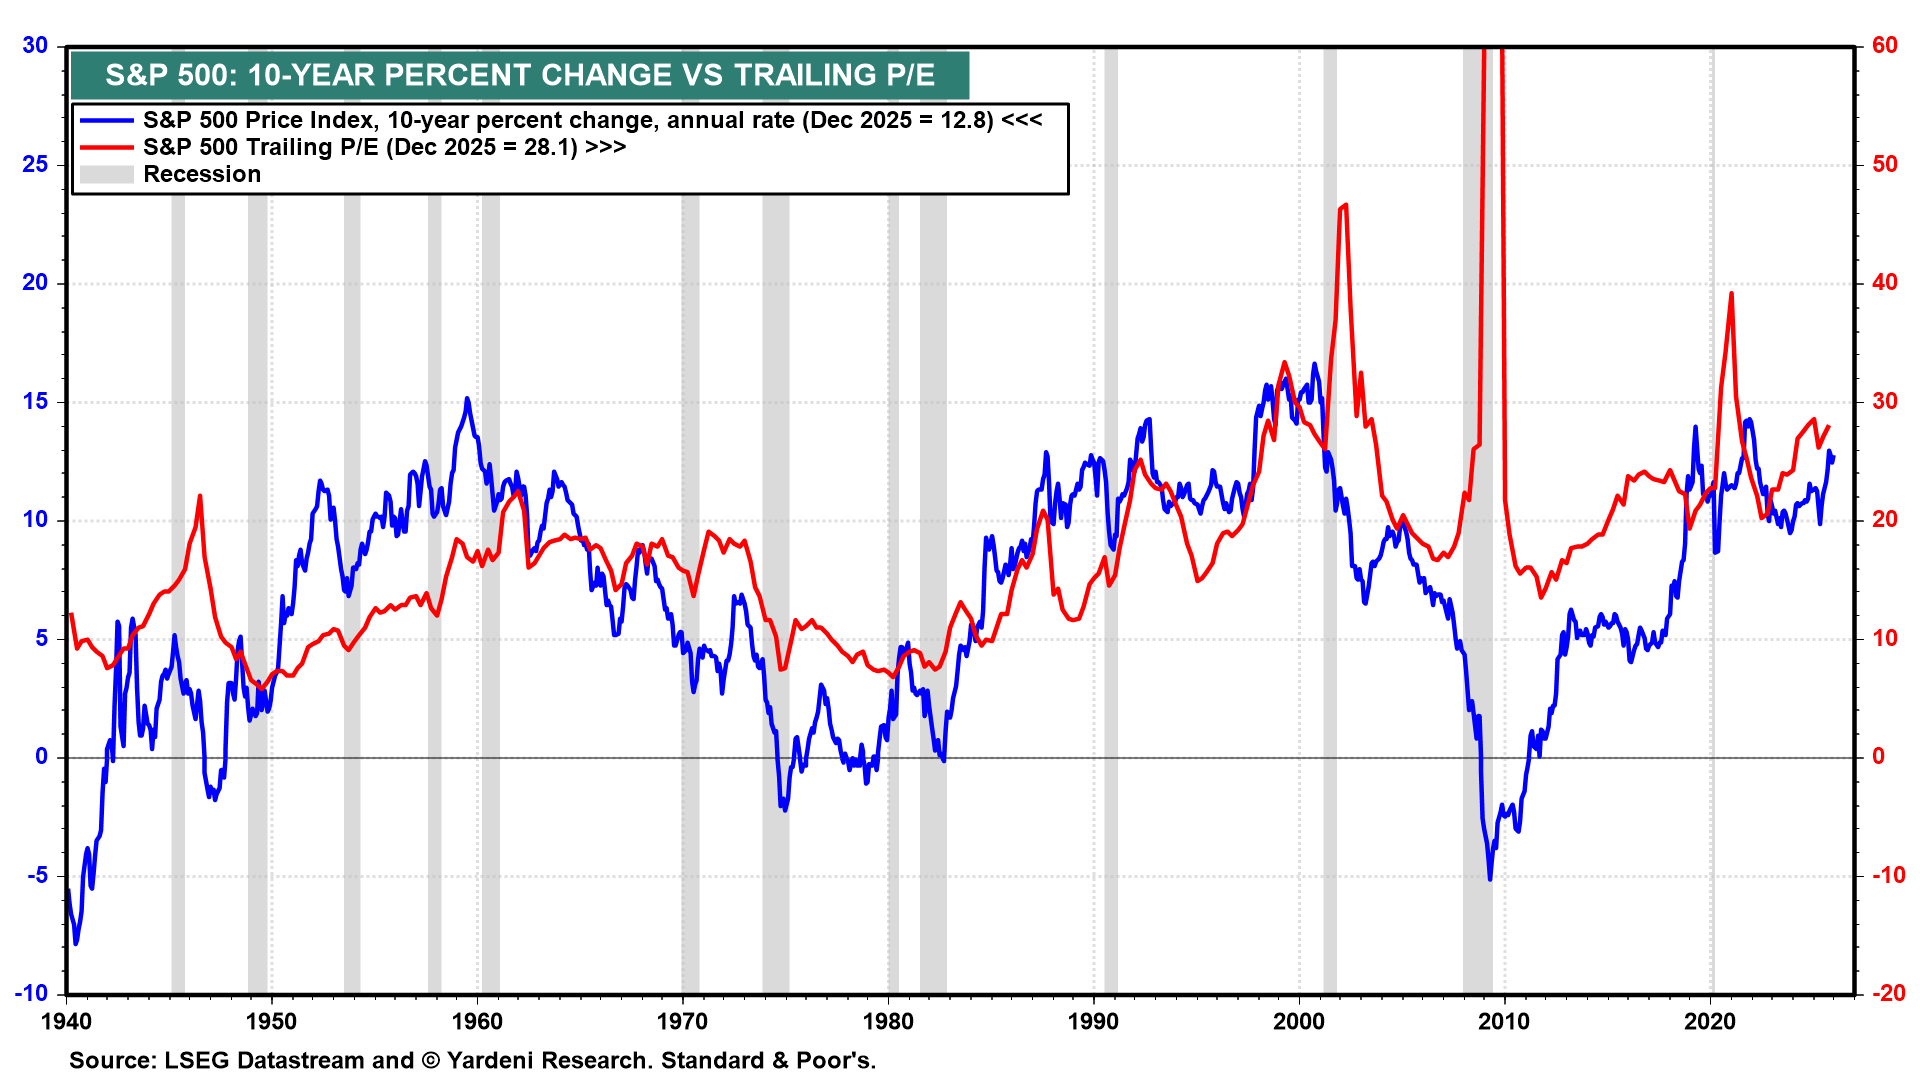
There were indeed "lost decades" in the stock market during the 1970s and 2000s, following historically high P/Es (chart). The first episode was associated with rapidly rising consumer prices, which led to two recessions. The second resulted from the bursting of a housing price bubble, which triggered the Great Financial Crisis and the Great Recession.
We've previously noted that valuation multiples always fall during recessions along with earnings. The economy has demonstrated its resilience since the start of the Roaring 2020s. We expect it to remain resilient through the end of the decade, with the forward P/E remaining elevated at its current level as earnings growth lifts the S&P 500 to 10,000.
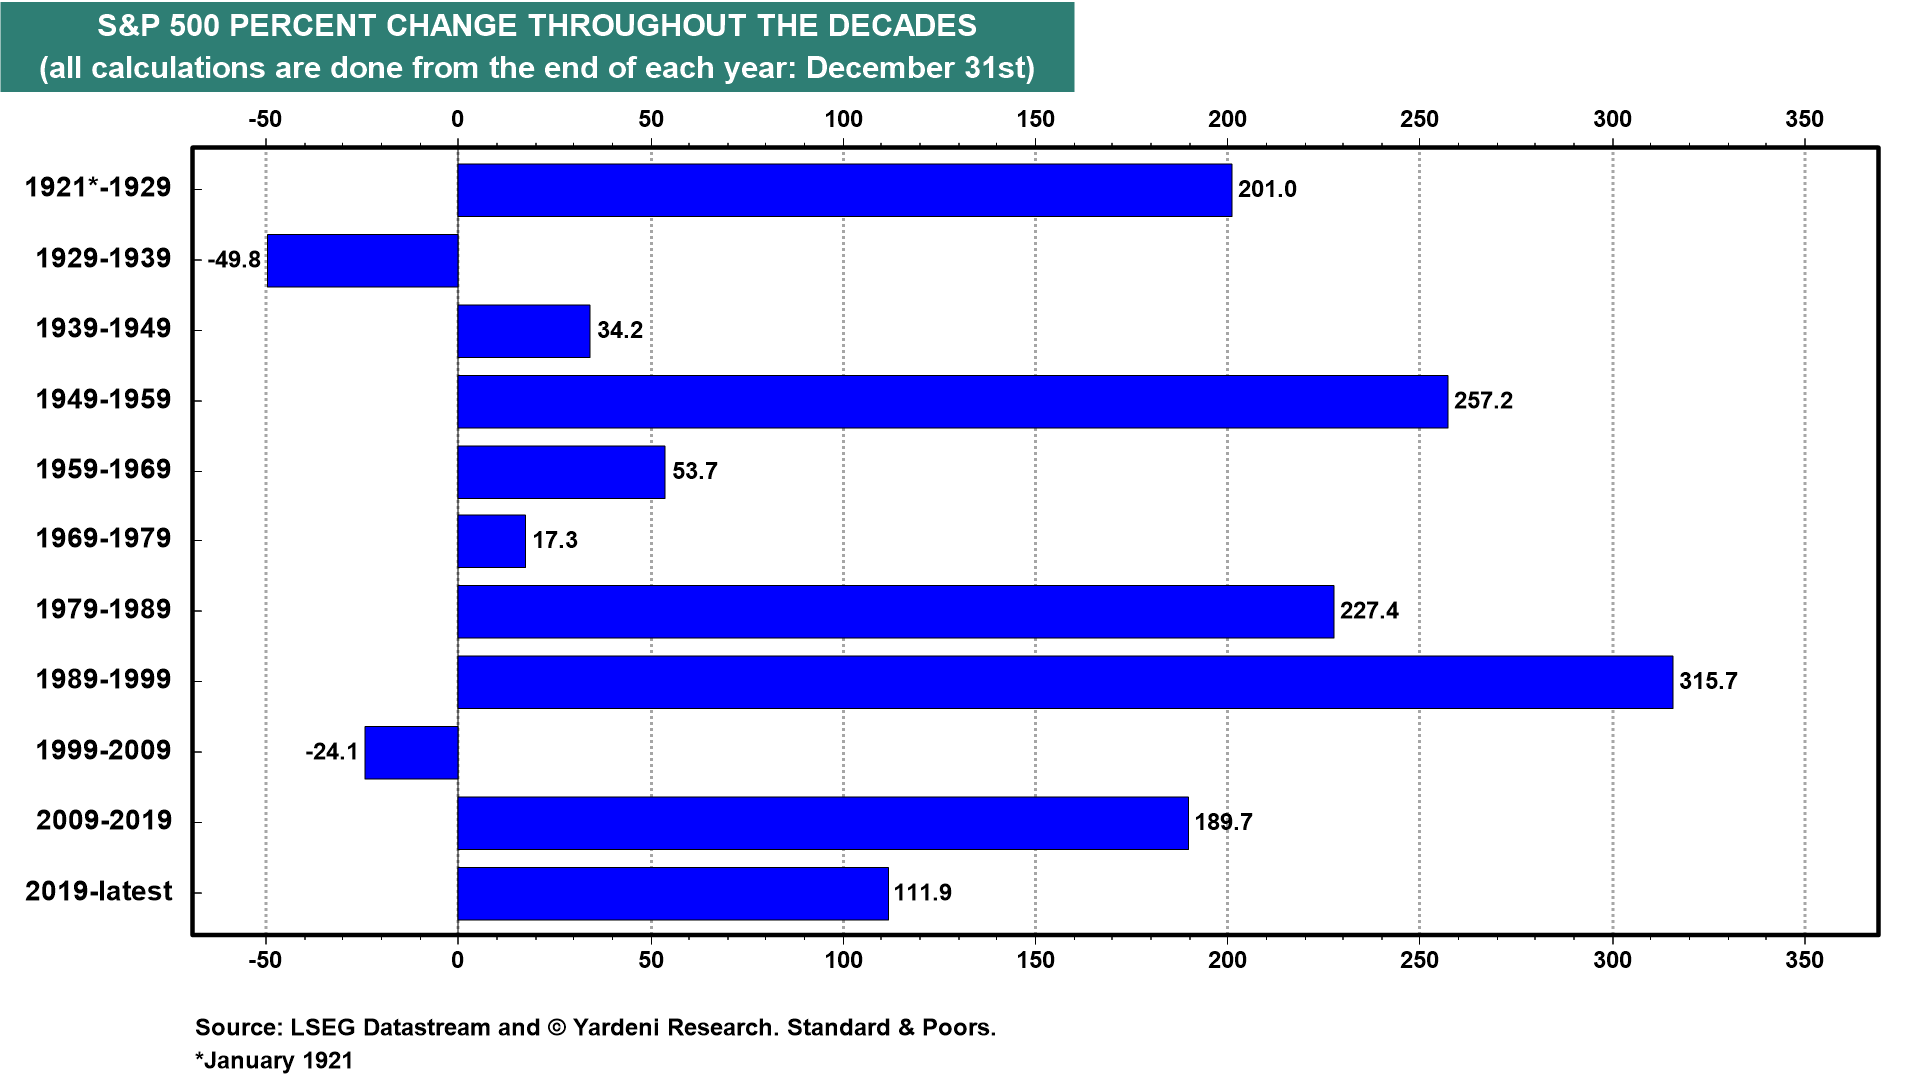
The horrific 1930s followed the Roaring 1920s. If a deep depression were to occur again during the 2030s, then it would undoubtedly result in another lost decade for the stock market. For now, we believe that the 2030s could be another roaring decade for the economy and the stock market. Over the past 10 decades, only two periods had negative returns for the S&P 500, and half had returns of about 200% or more (chart).
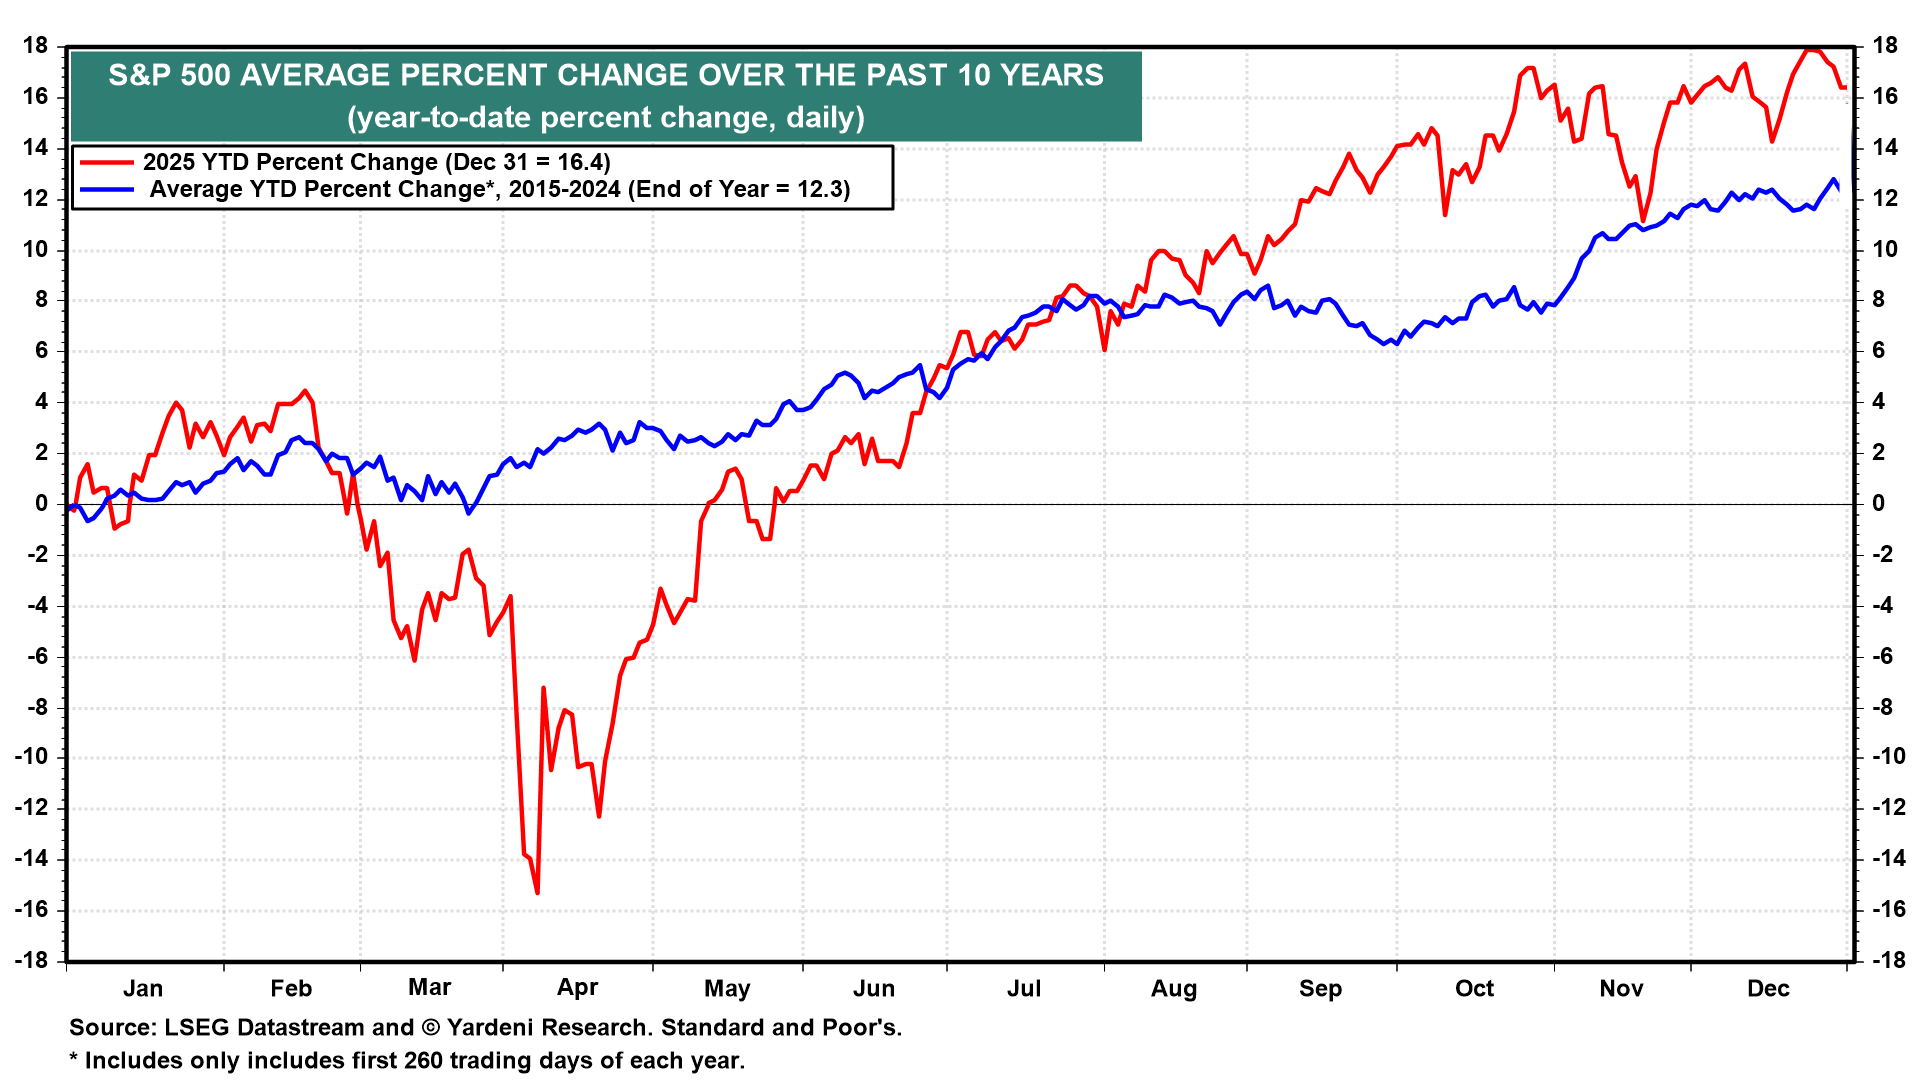
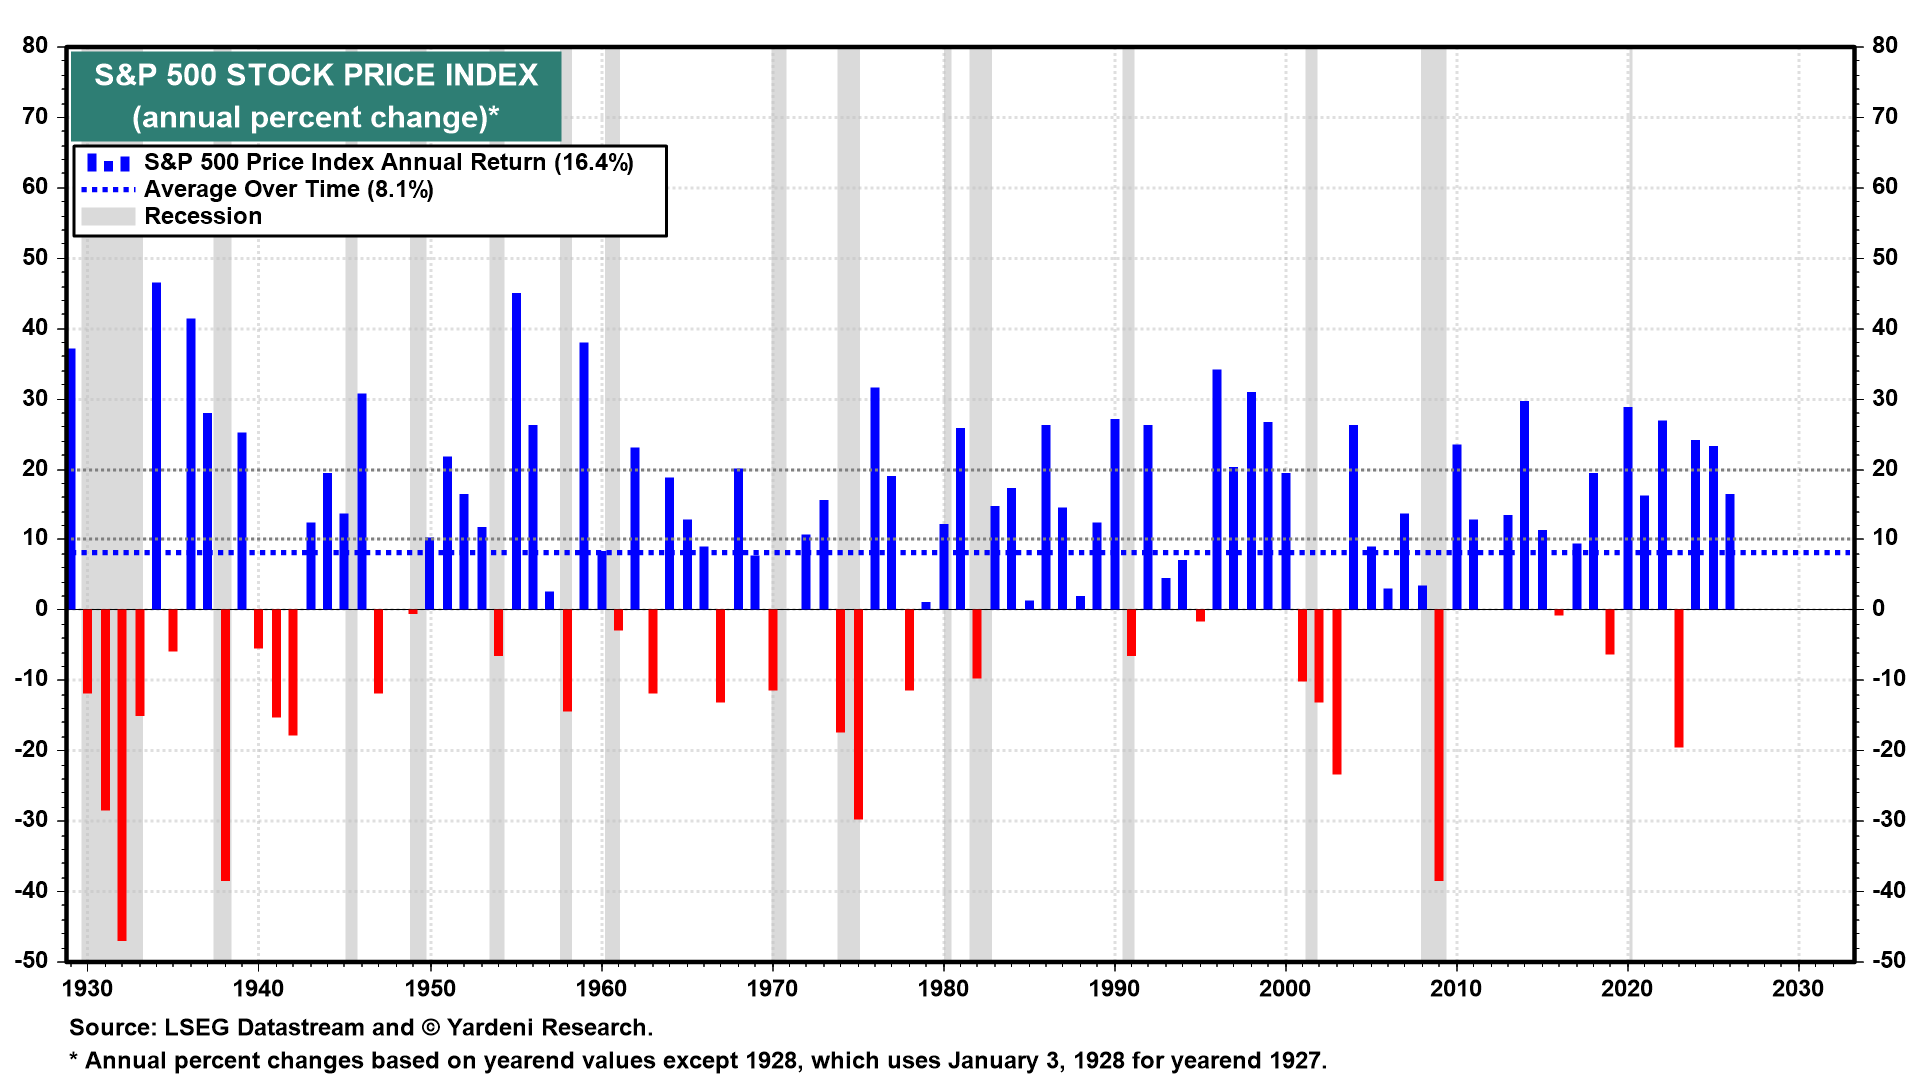
The S&P 500 rose 16.4% last year (chart). We expect it will increase 10% this year. That would make 2026 the fourth consecutive year of gains of 10% or more. The other three were during the 1940s, 1950s, and 1990s.
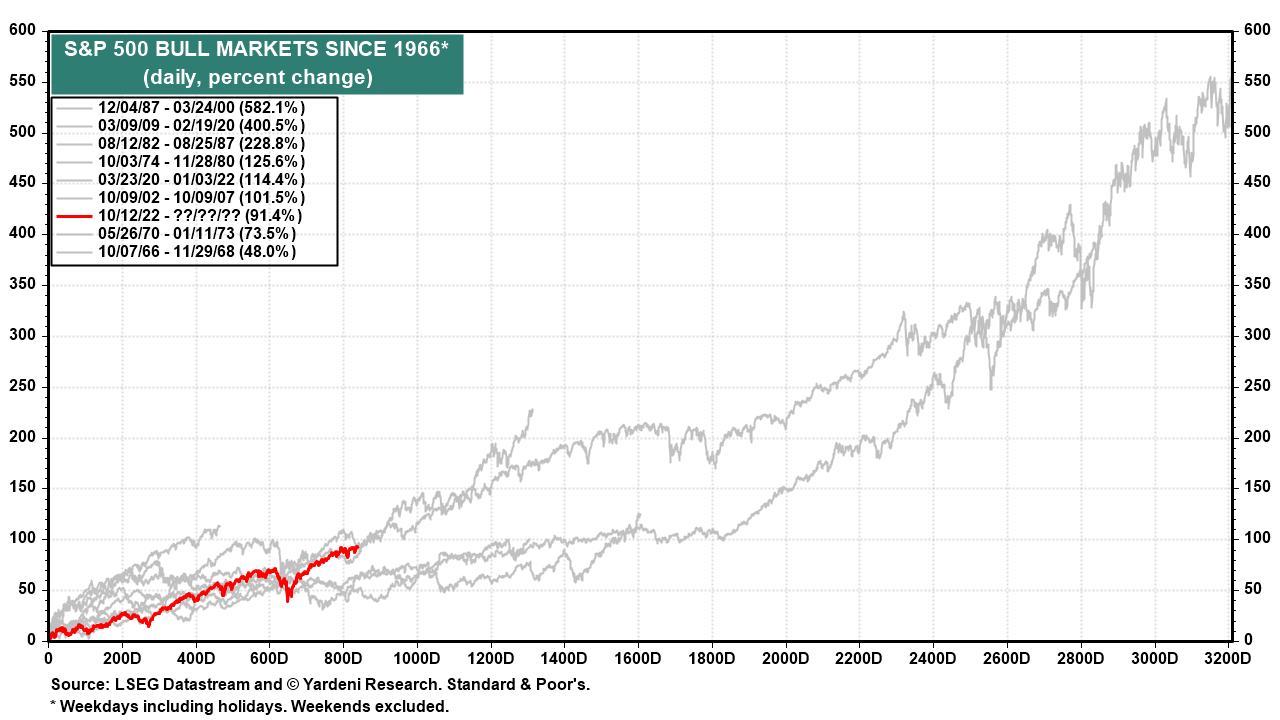
Since the start of the current bull market on October 12, 2022, the S&P 500 is up 91.4% (chart). In our outlook, this bull market could be one of the longer ones.
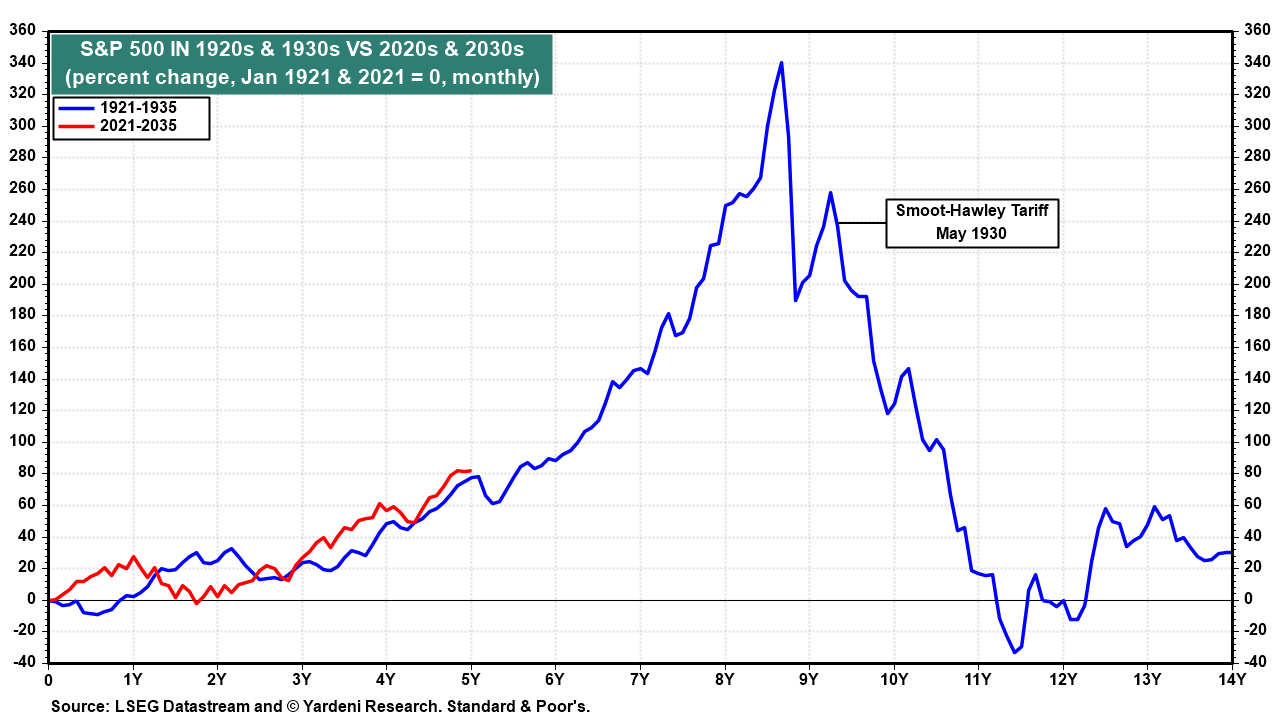
Since 2021, the S&P 500 has closely tracked its performance from 1921 to 1925 (chart). We doubt that it will soar over the next four years and then crash in the 2030s as it did in the late 1920s and early 1930s.
By the way, the Great Crash really started in May 1930 when the Smoot-Hawley Tariff was enacted. Using monthly data, the S&P 500 dropped 34% from September 1929 through November of that year. It then recovered 24% by April 1930, matching its level in April 1929! The S&P 500 lost 81% of its value between April 1930 and July 1932.
The economy's resilience this decade was demonstrated yet again in 2025, as it showed no signs of weakening in response to Trump's Tariff Turmoil.
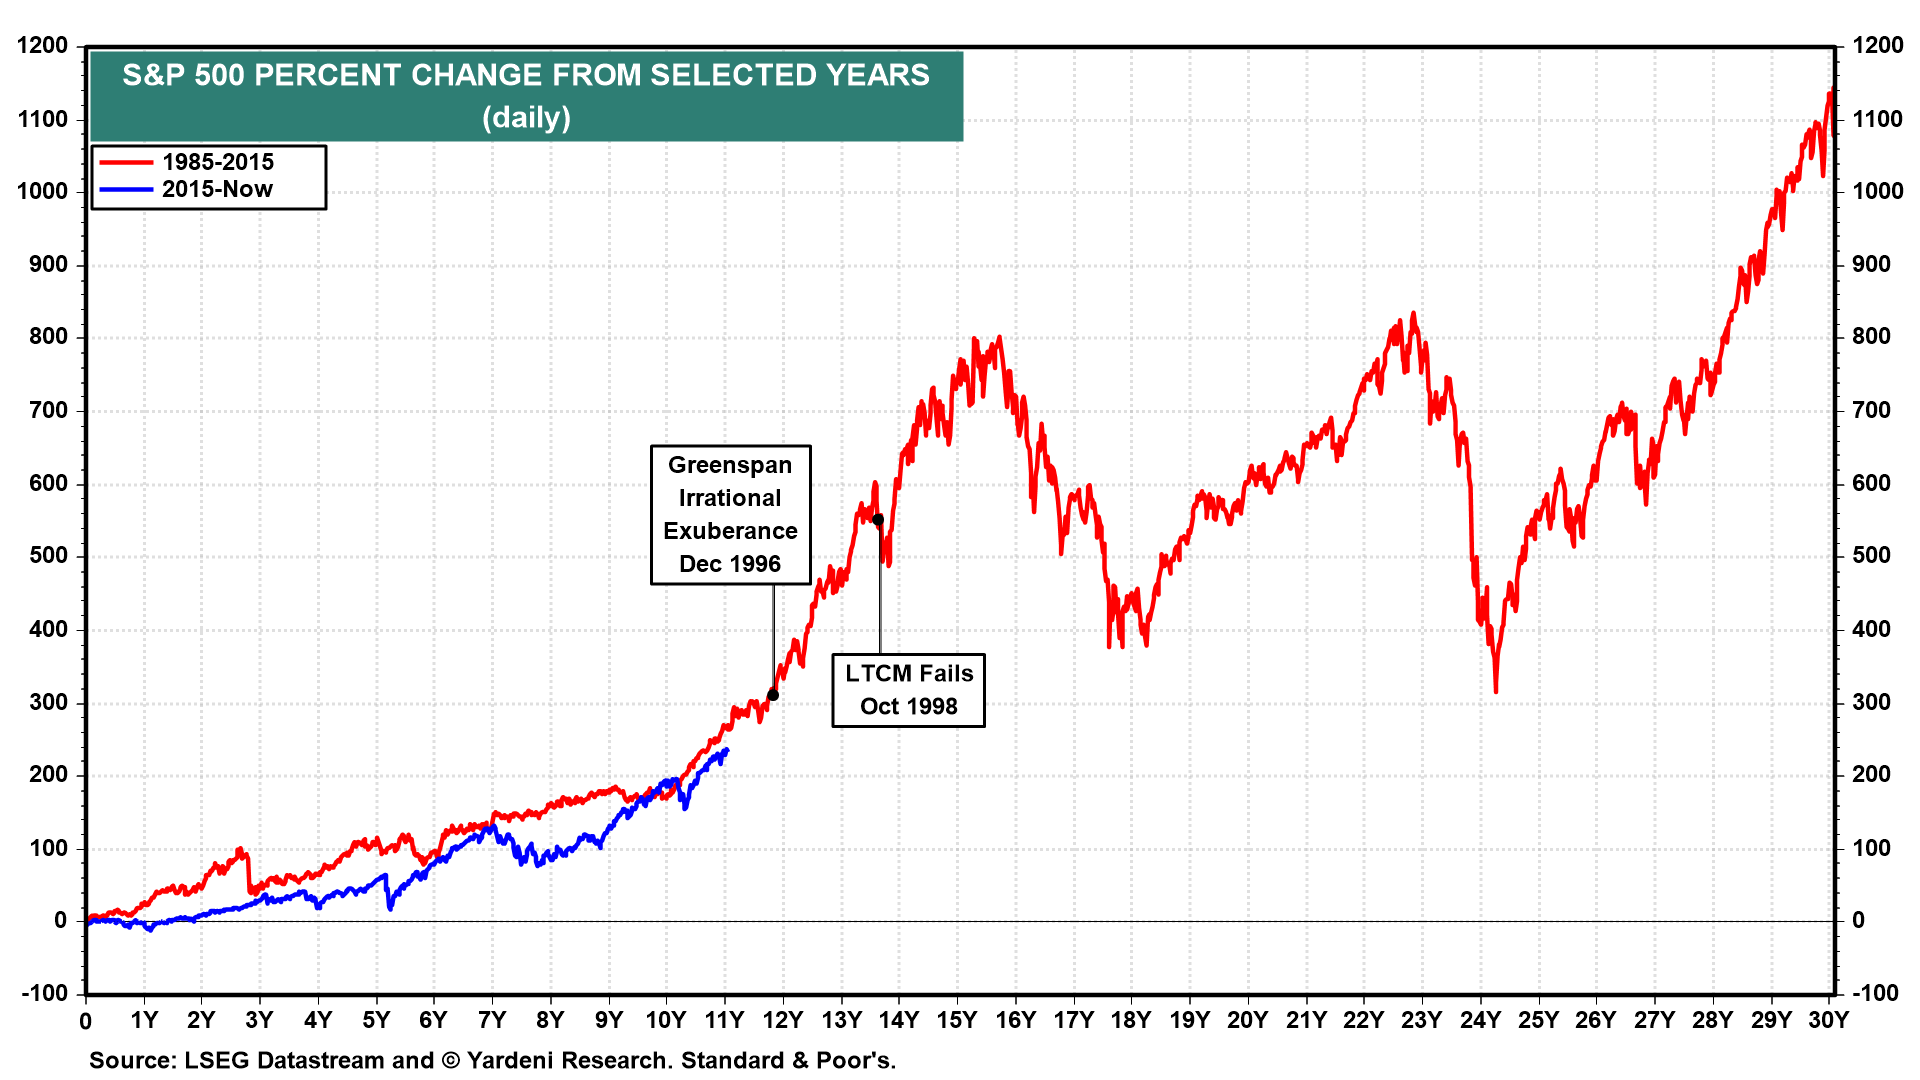
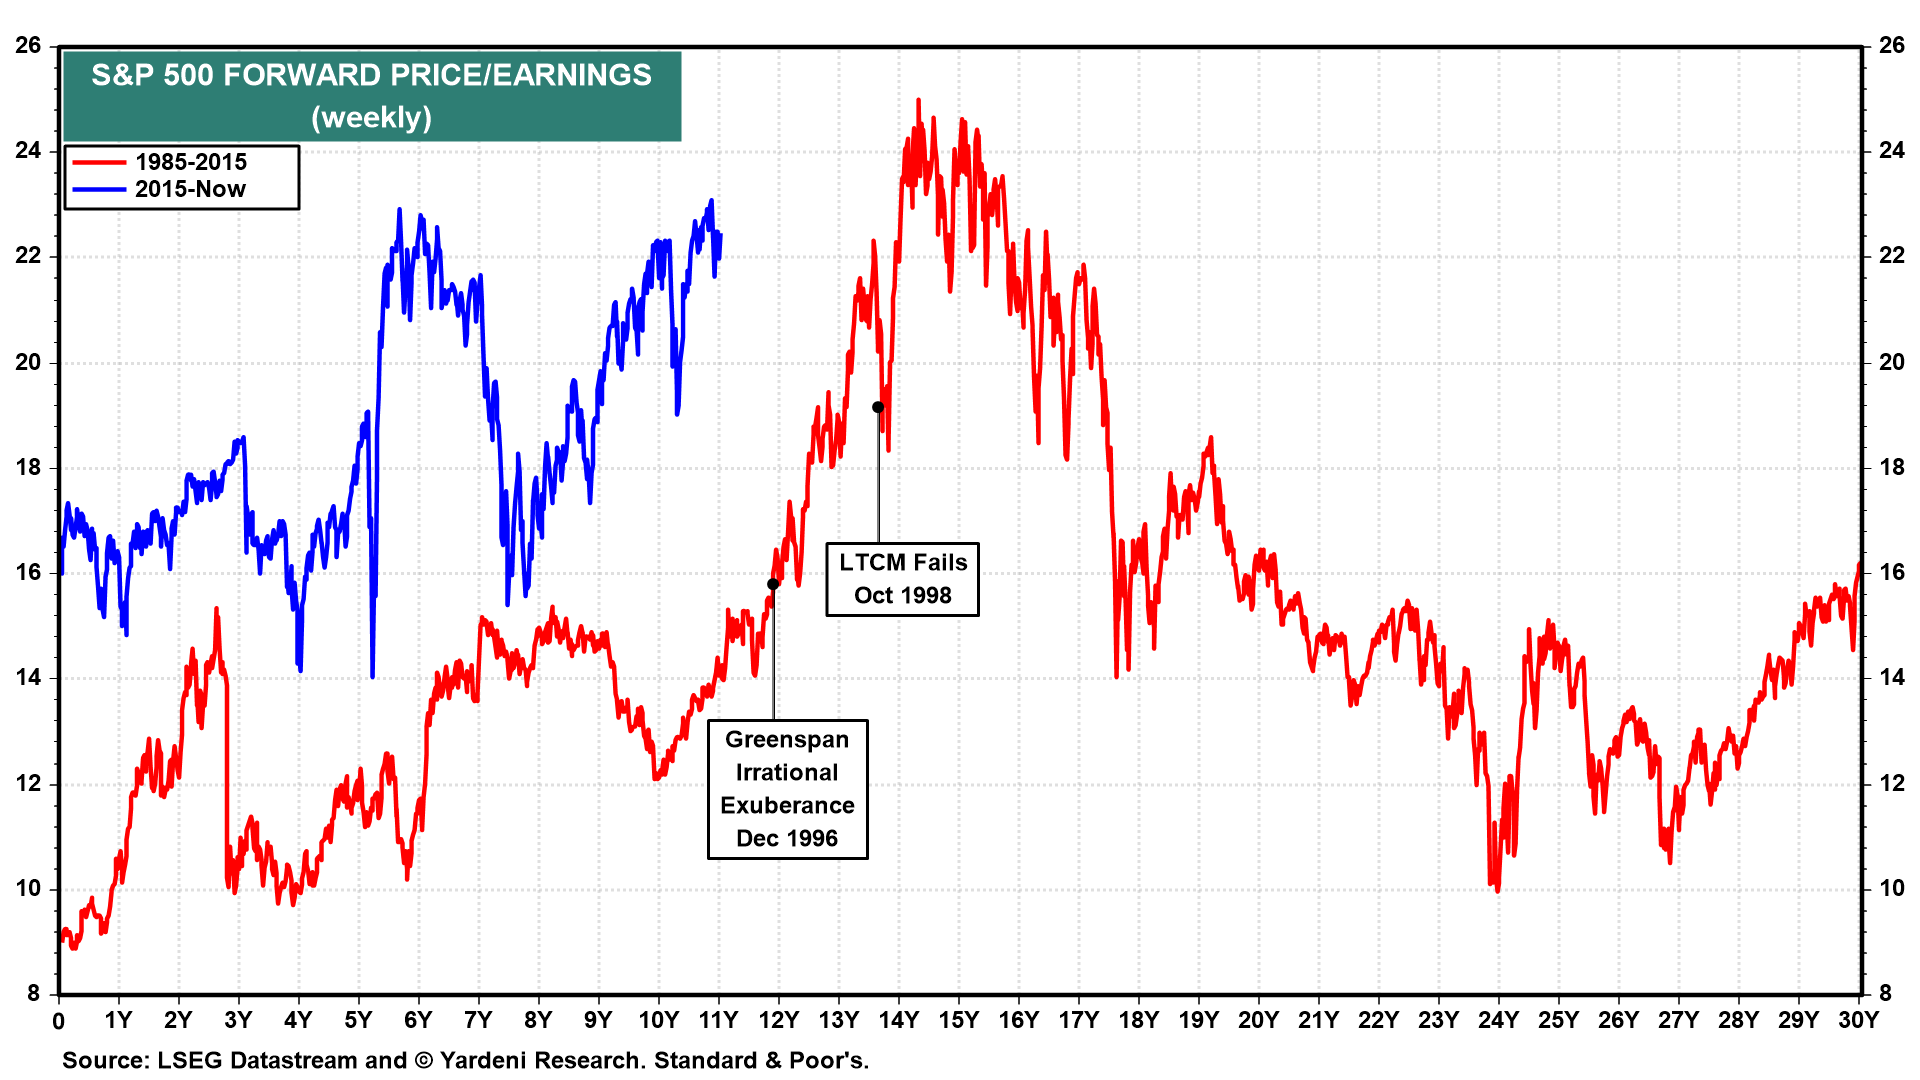
Since 2015, the S&P 500 also has tracked its performance since 1985 (chart).
The difference between these two periods is that the forward P/E is now substantially higher than it was back then (chart).
The S&P 500 rose 16.4% last year, beating its previous 10-year average gain of 12.3%.