Last year, in the December 7 QT, we wrote: "It no longer makes much sense for us to continue recommending overweighting the Information Technology and Communication Services sectors in an S&P 500 portfolio .... The same can be said about overweighting the United States in the All Country World MSCI portfolio." It was time to rebalance, in our opinion, because the two sectors accounted for a remarkable record 46.7% of the S&P 500's market-cap weight on November 5, 2025, while the US accounted for a staggering 65.0% of the market-cap weight of the All Country World MSCI at about the same time.
In the December 13 QT, we wrote: "The S&P 500's Magnificent-7 might be less magnificent in 2026 as their fierce competition in the AI race starts to erode the monopolies they have enjoyed in search (Google), software (Microsoft), retailing (Amazon), advertising (Meta), electric vehicles (Tesla), smartphones (Apple), and GPU chips (Nvidia). The beneficiaries of that competition are likely to be the S&P 500's Impressive 493."
So far, so good. The leadership of both the S&P 500 and the All Country World MSCI has been broadening away from last year’s outperformers, which we expect to continue:
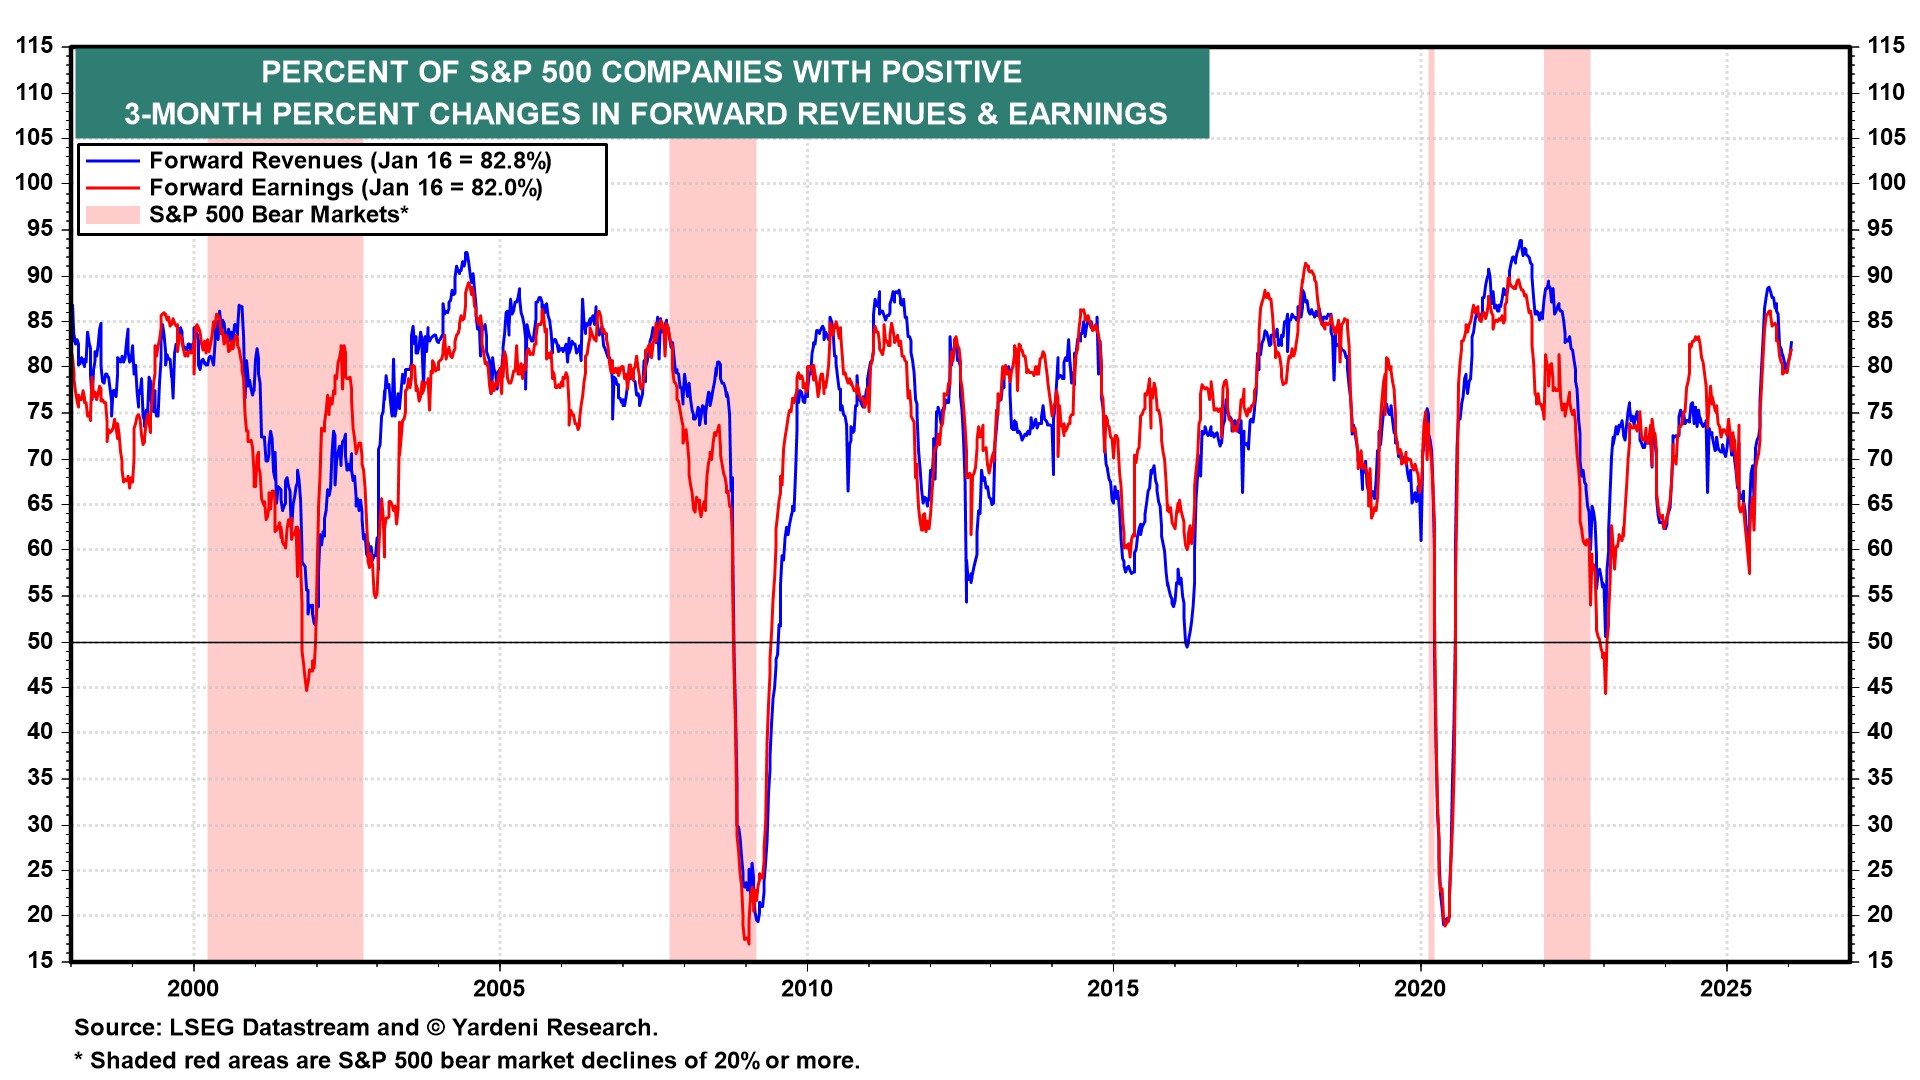
(1) S&P 500 earnings breadth remains high. The percentages of S&P 500 companies with positive three-month percentage changes in their forward revenues and earnings per share remain high at 82.8% and 82.0% (chart). This should underpin the broadening of the bull market in stocks.
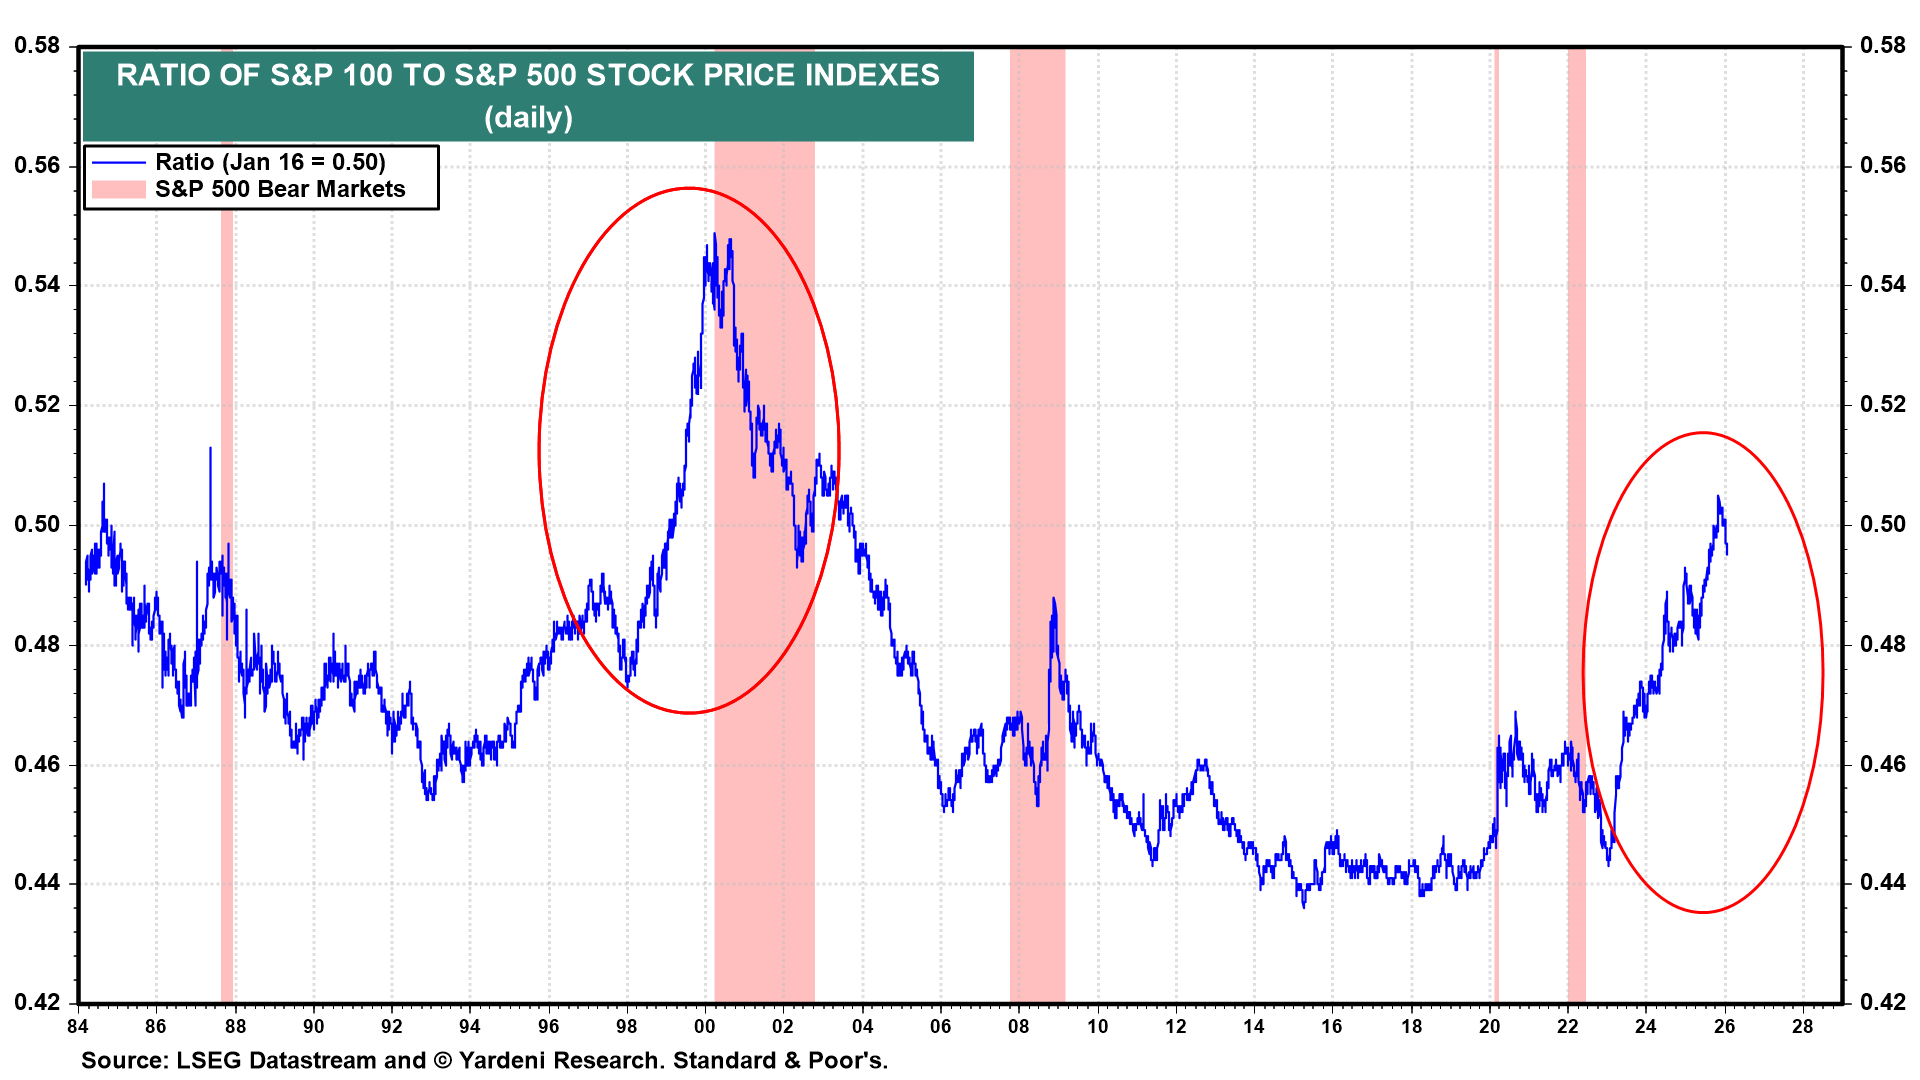
(2) The bull market in the S&P 500 is showing signs of broadening. The ratio of the S&P 100 to the S&P 500 might have peaked at the end of last year, well below the peak during the tech bubble of 1999 (chart). If so, then the odds of a bubble bursting now are much lower than they were back then, when the stock market was much more concentrated in tech names than it is now, according to this ratio. So instead of a bursting bubble, we may be seeing a broadening bull market.
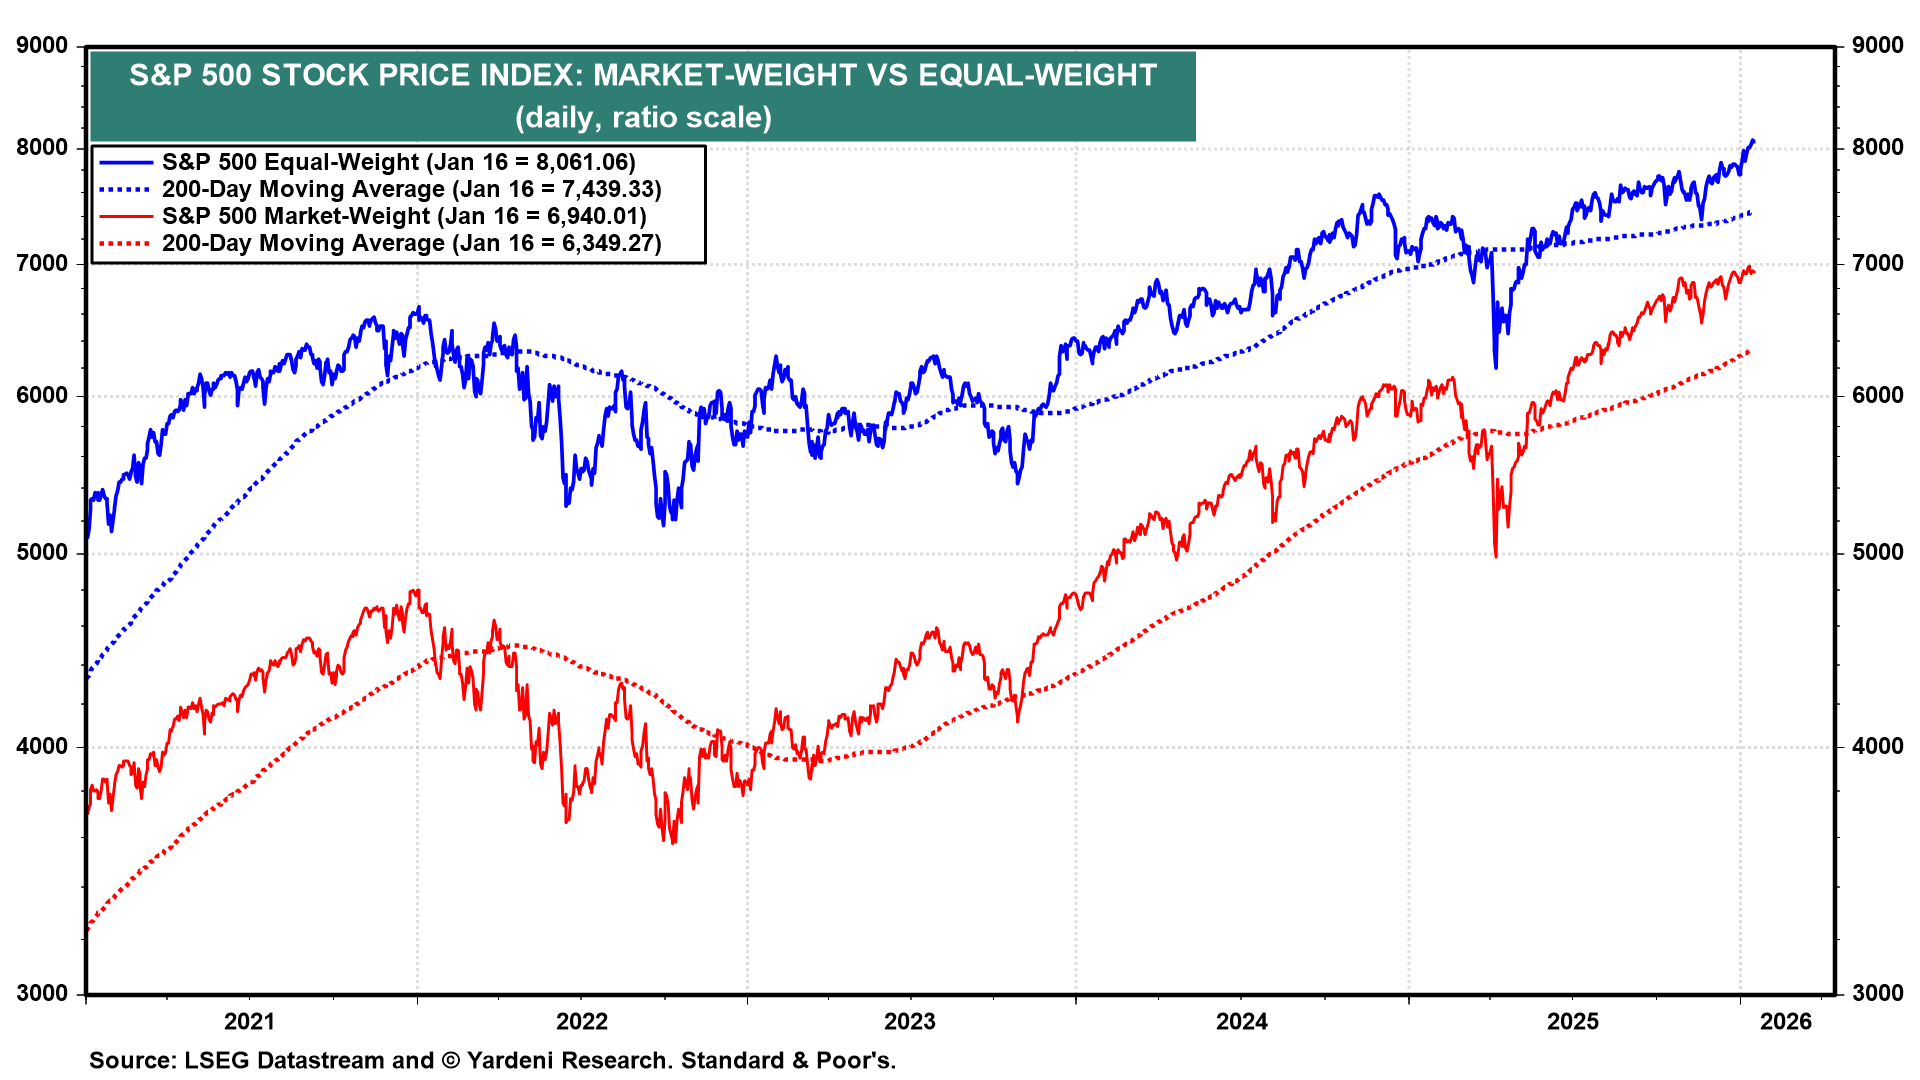
The same can be said for the ratio of the S&P 500 market-weight to equal-weight indexes (chart). The recent drop in the ratio might be the latest head-fake. However, we're betting that the ratio will continue to trend lower in 2026 as the bull market broadens.
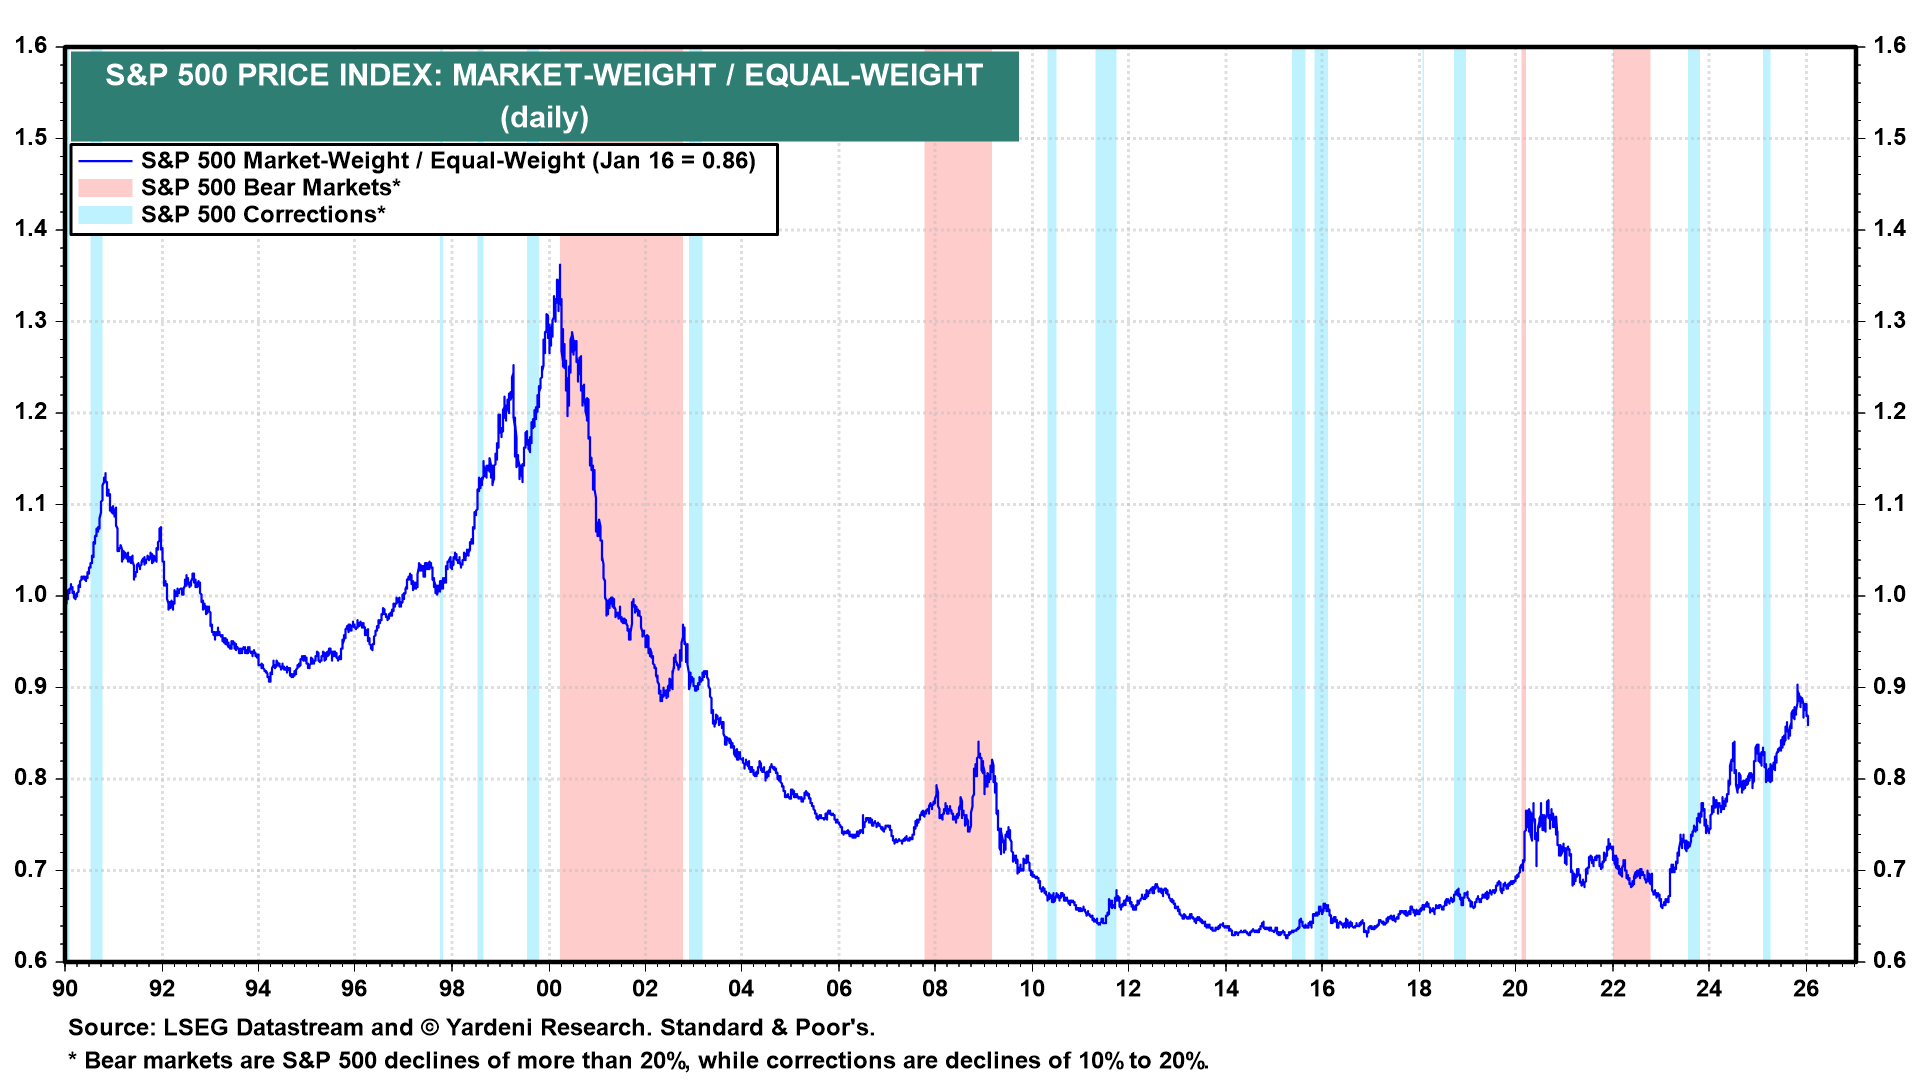
The equal-weight S&P 500 has been setting record highs recently, while the market-weight S&P 500 has yet to do so (chart).
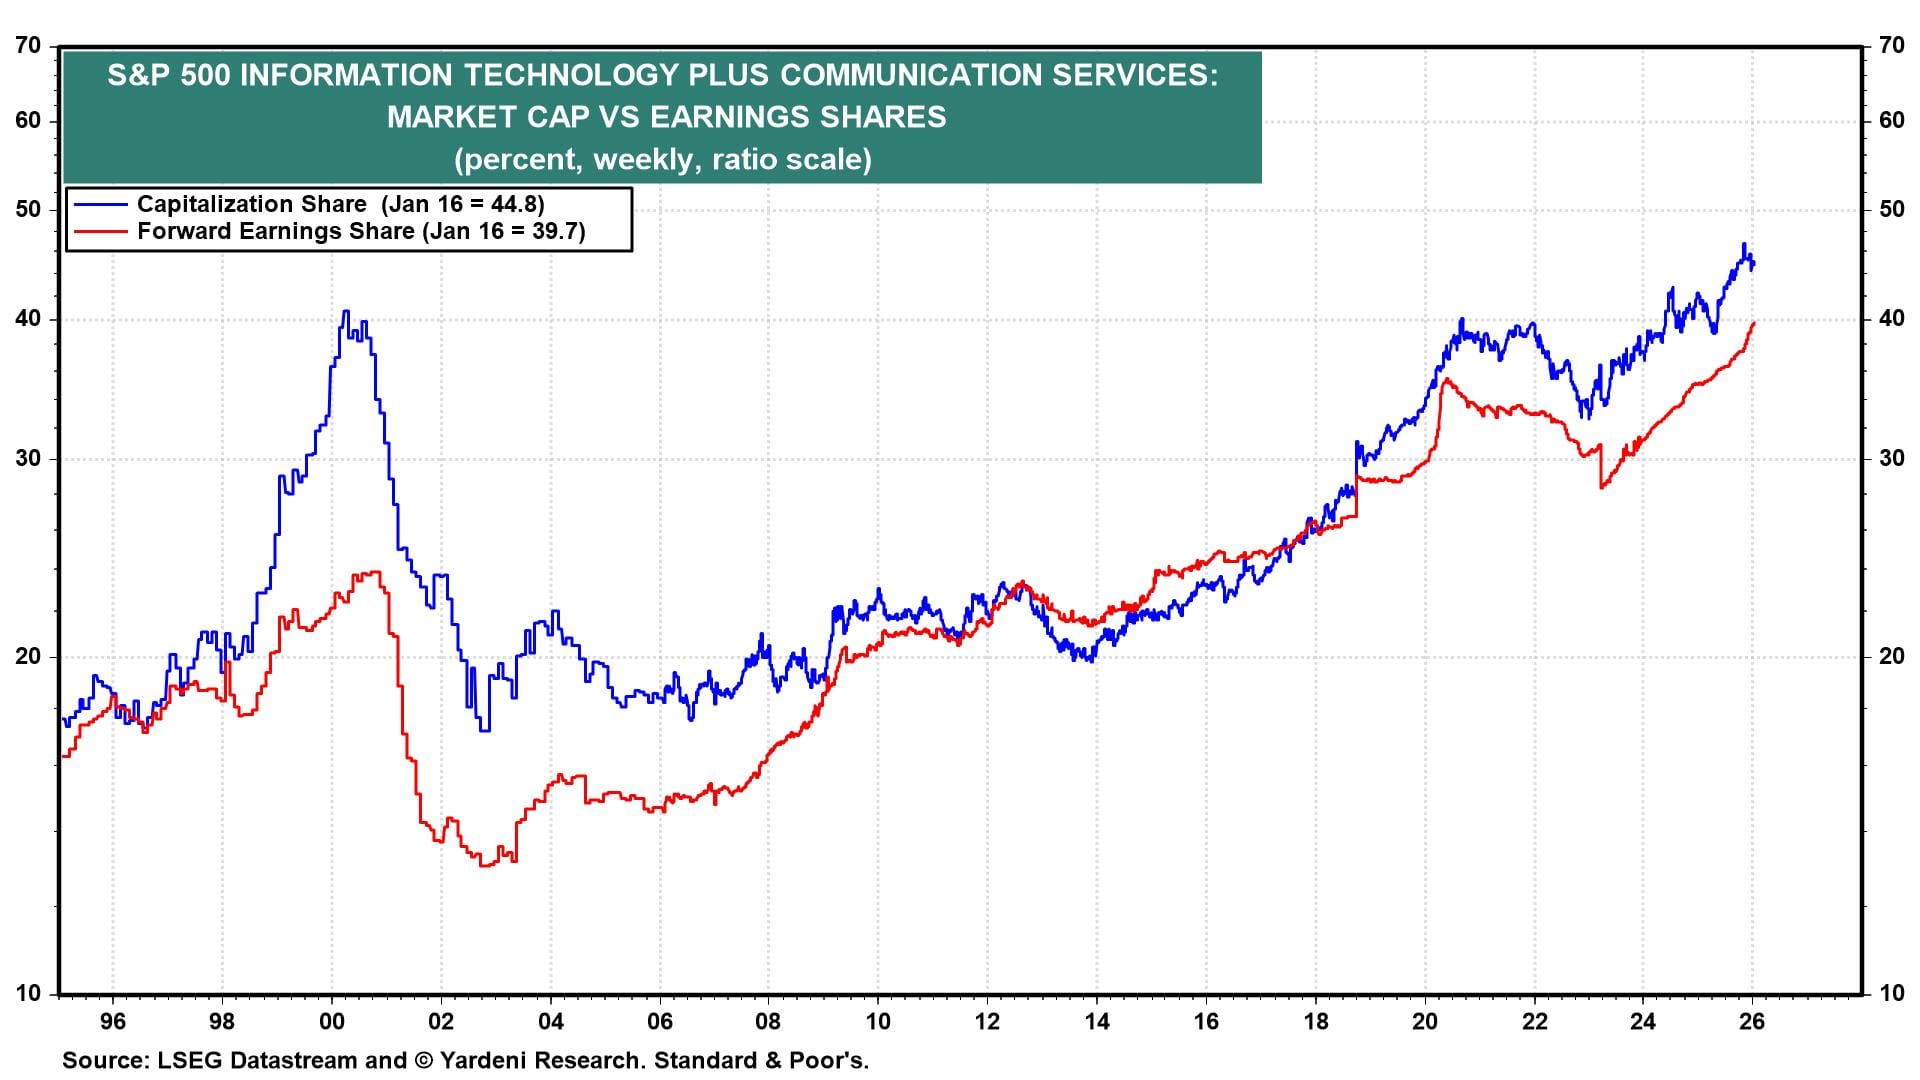
(3) Will S&P 500 Information Technology and Communication Services sectors continue to gain market-cap share of the index? We started to doubt that they would late last year, when together the two sectors had risen to a record 46.7% share of the S&P 500’s total market cap; we were skeptical even though their combined earnings share had reached a record 40.0% of the index (chart). The current market-cap share of the two sectors combined exceeds that at the peak of the tech bubble in 2000, but so does their combined earnings share. We expect that huge AI capital spending and margin pressures will turn both sectors from outperformers to market performers.
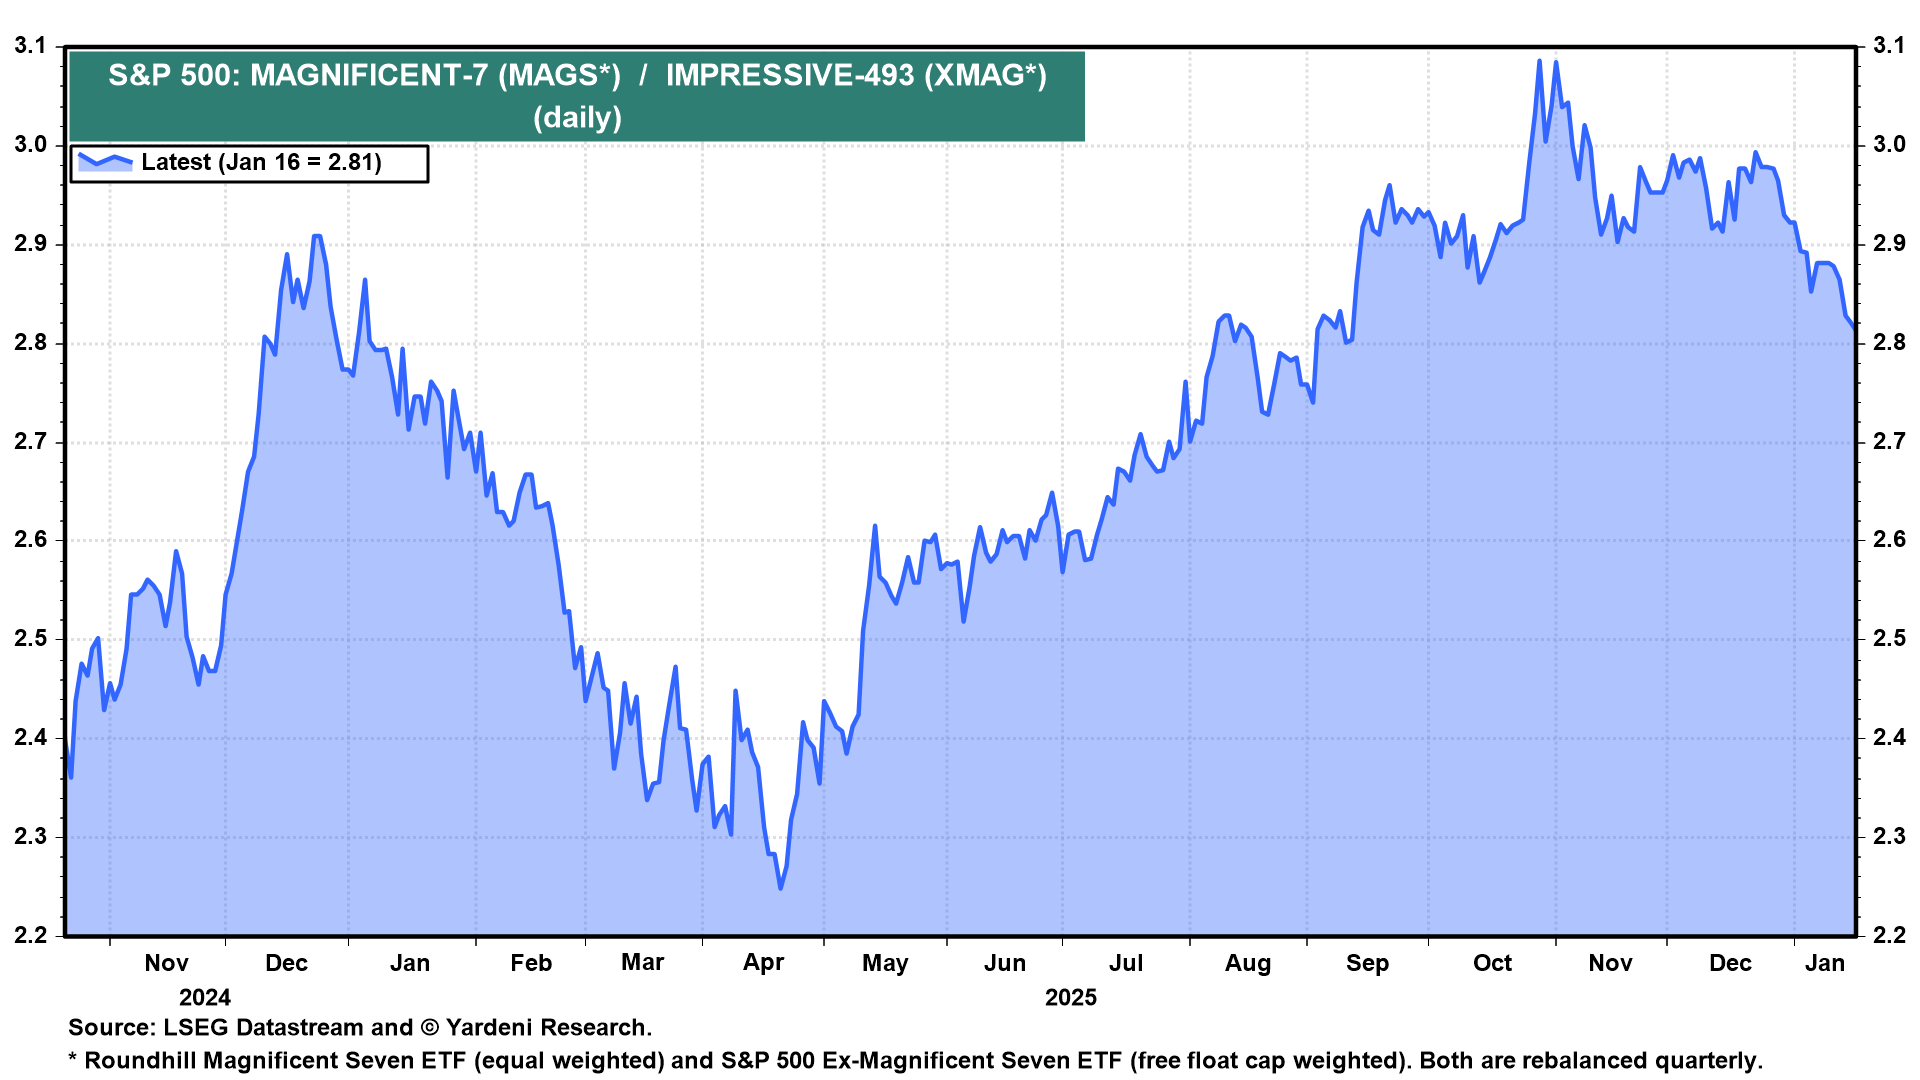
Our "Game of Thrones" thesis is working, so far. Until late last year, the Magnificent-7 operated as seven independent kingdoms protected by large moats. Each prospered with its own unique monopoly. However, the AI arms race has upended that peaceful coexistence by greatly increasing competition among them. The ratio of the S&P 500 MAGS to XMAG ETFs peaked after Michael Burry famously tweeted on October 31, 2025, "Sometimes, we see bubbles. Sometimes, there is something to do about it."
(4) SMidCaps are beating LargeCaps. Also confirming a broadening bull market in stocks is the outperformance of the SmallCap and MidCap stock price indexes (a.k.a. the SMidCaps) so far this year (chart). Again, this development may be the latest head-fake, of which there have been several in recent years.
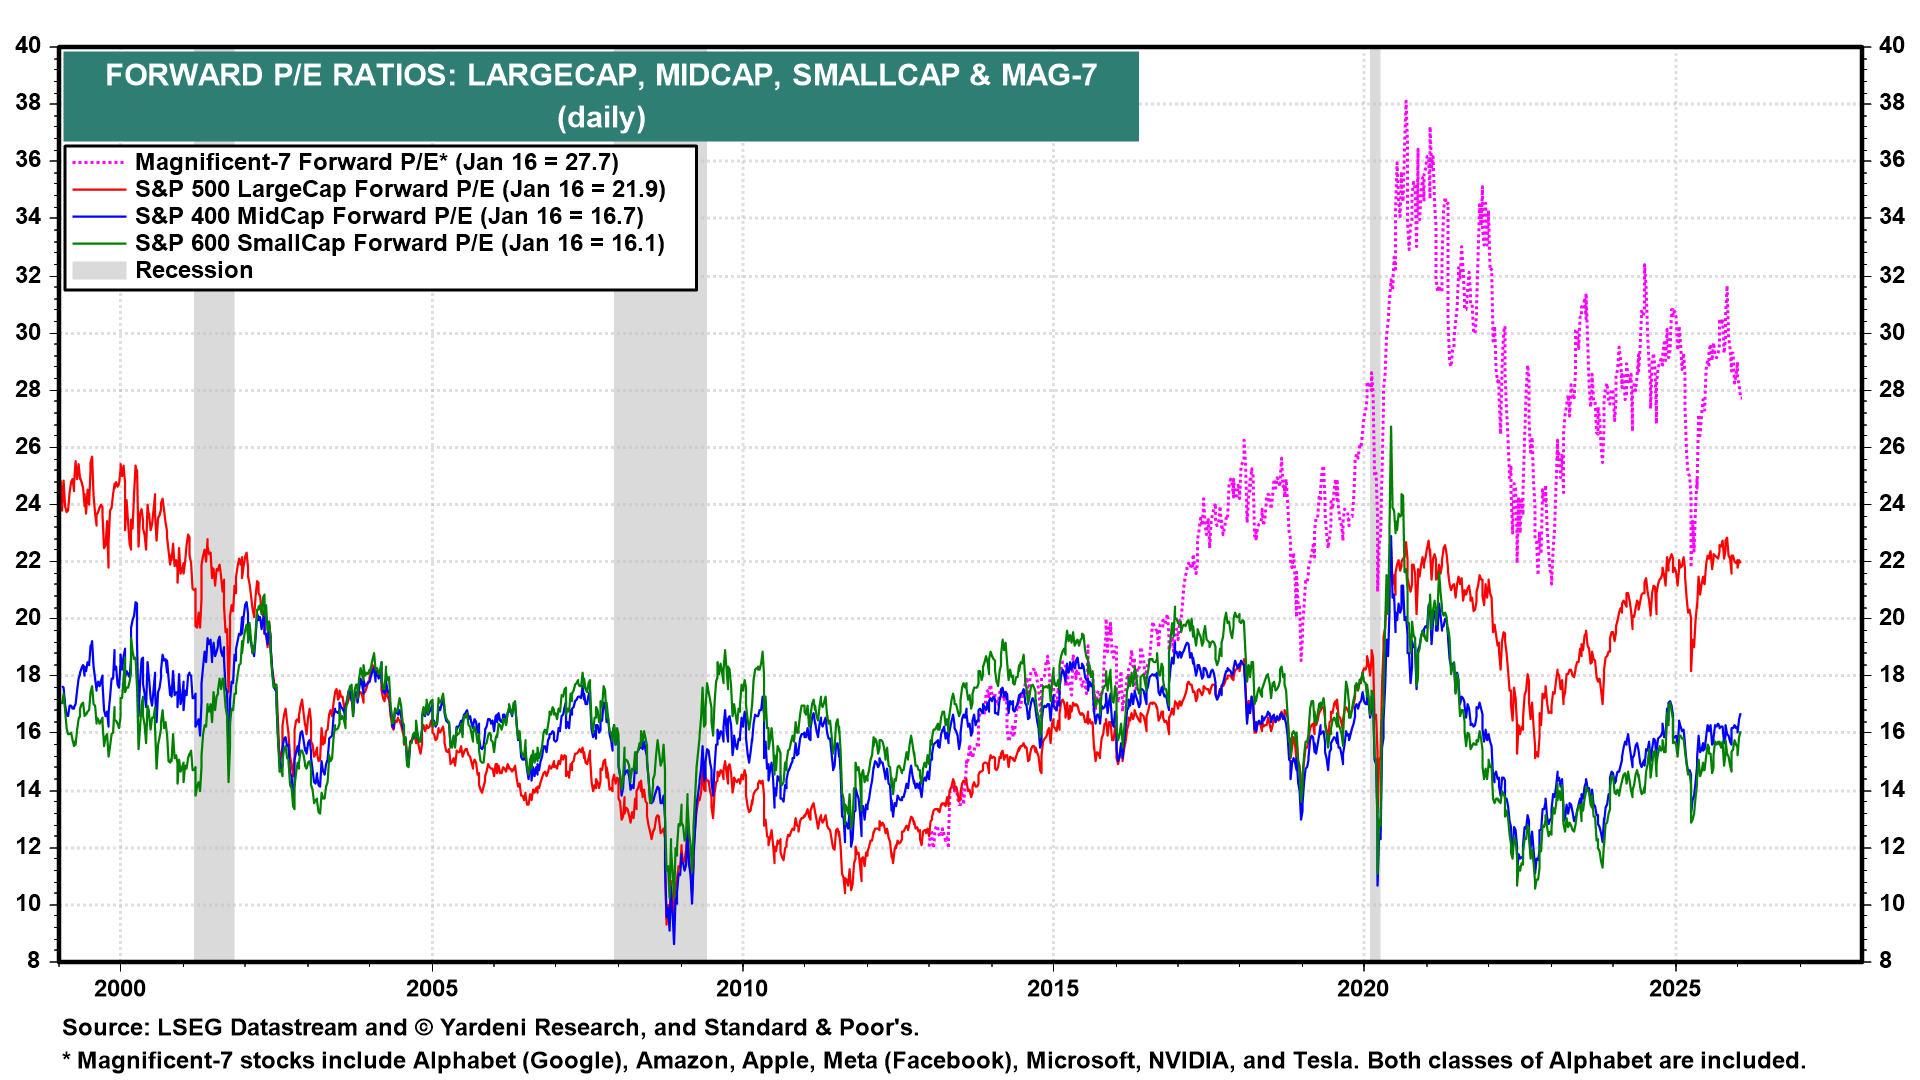
However, the SMidCaps are still cheaper than the LargeCaps based on their forward P/Es (chart).
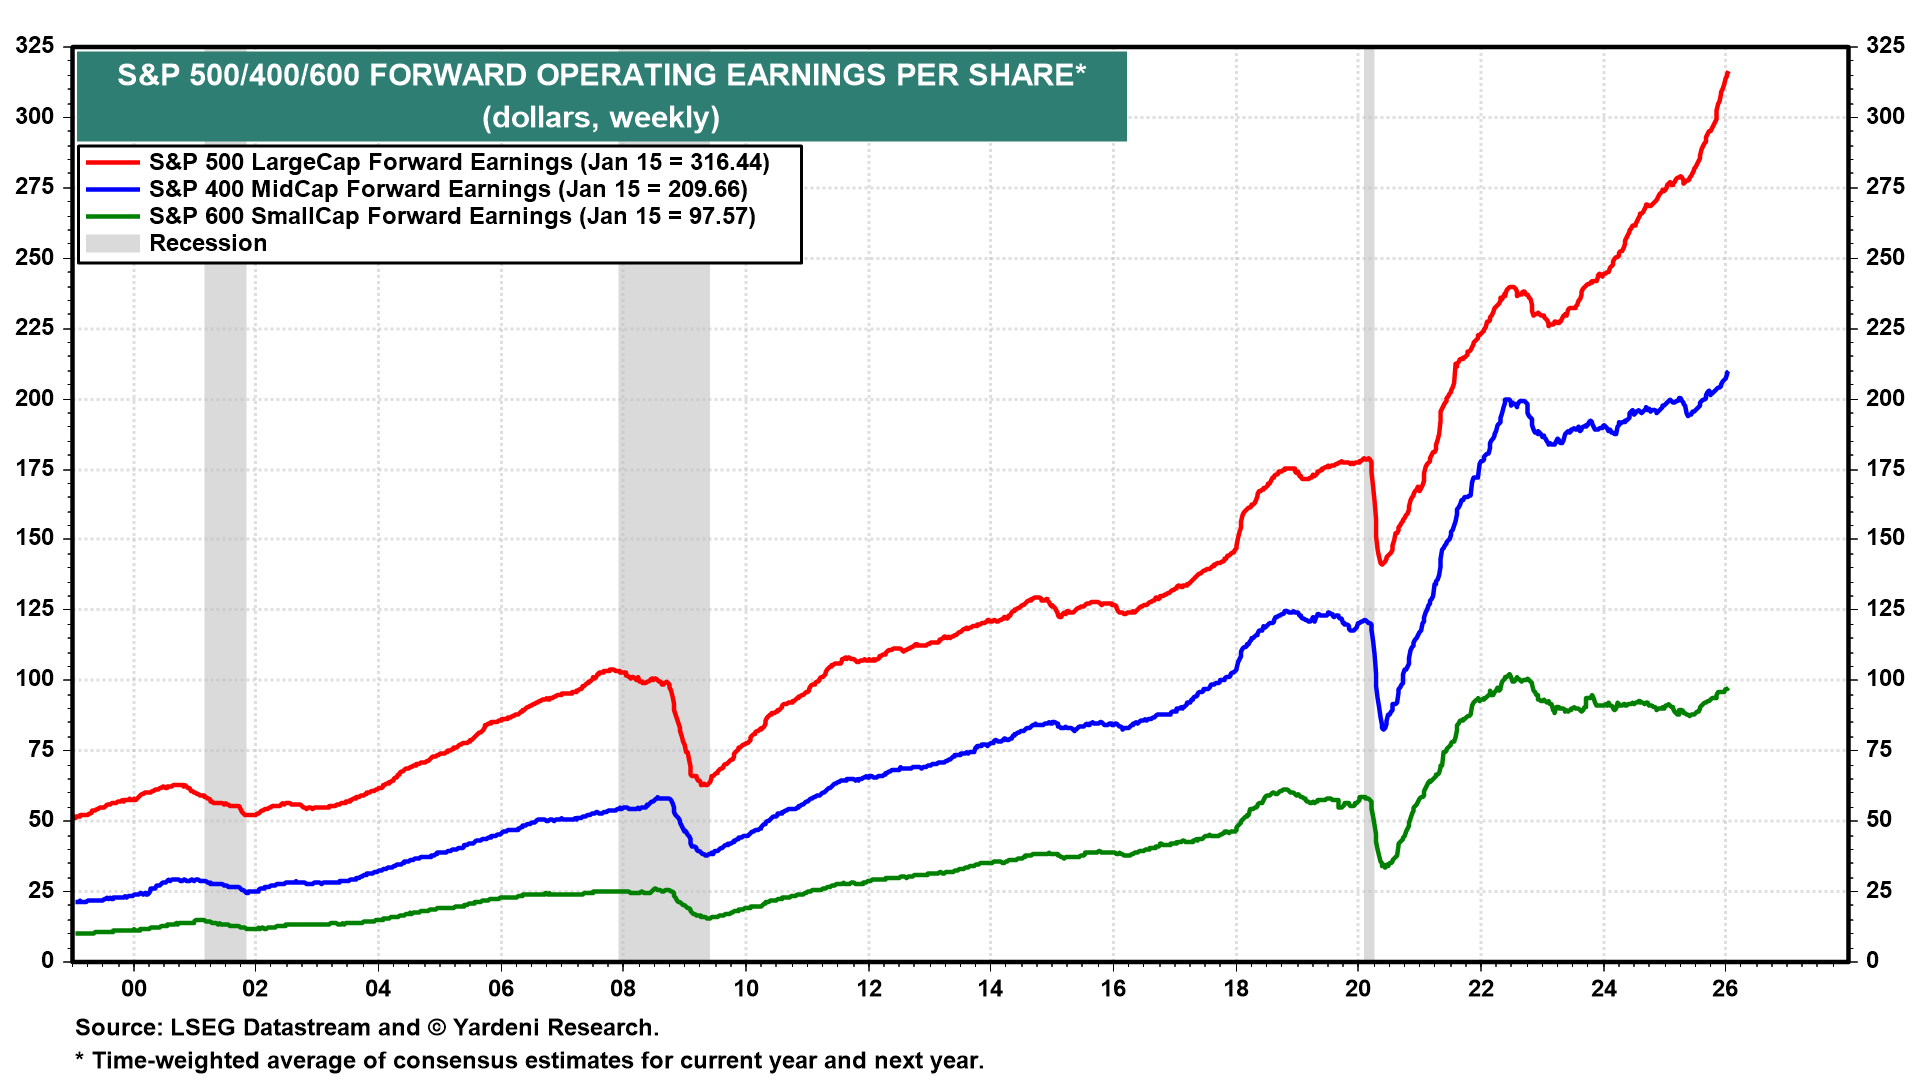
In addition, the forward earnings per share of the SMidCaps, which have been in a coma since late 2022, finally have been showing signs of life (chart).
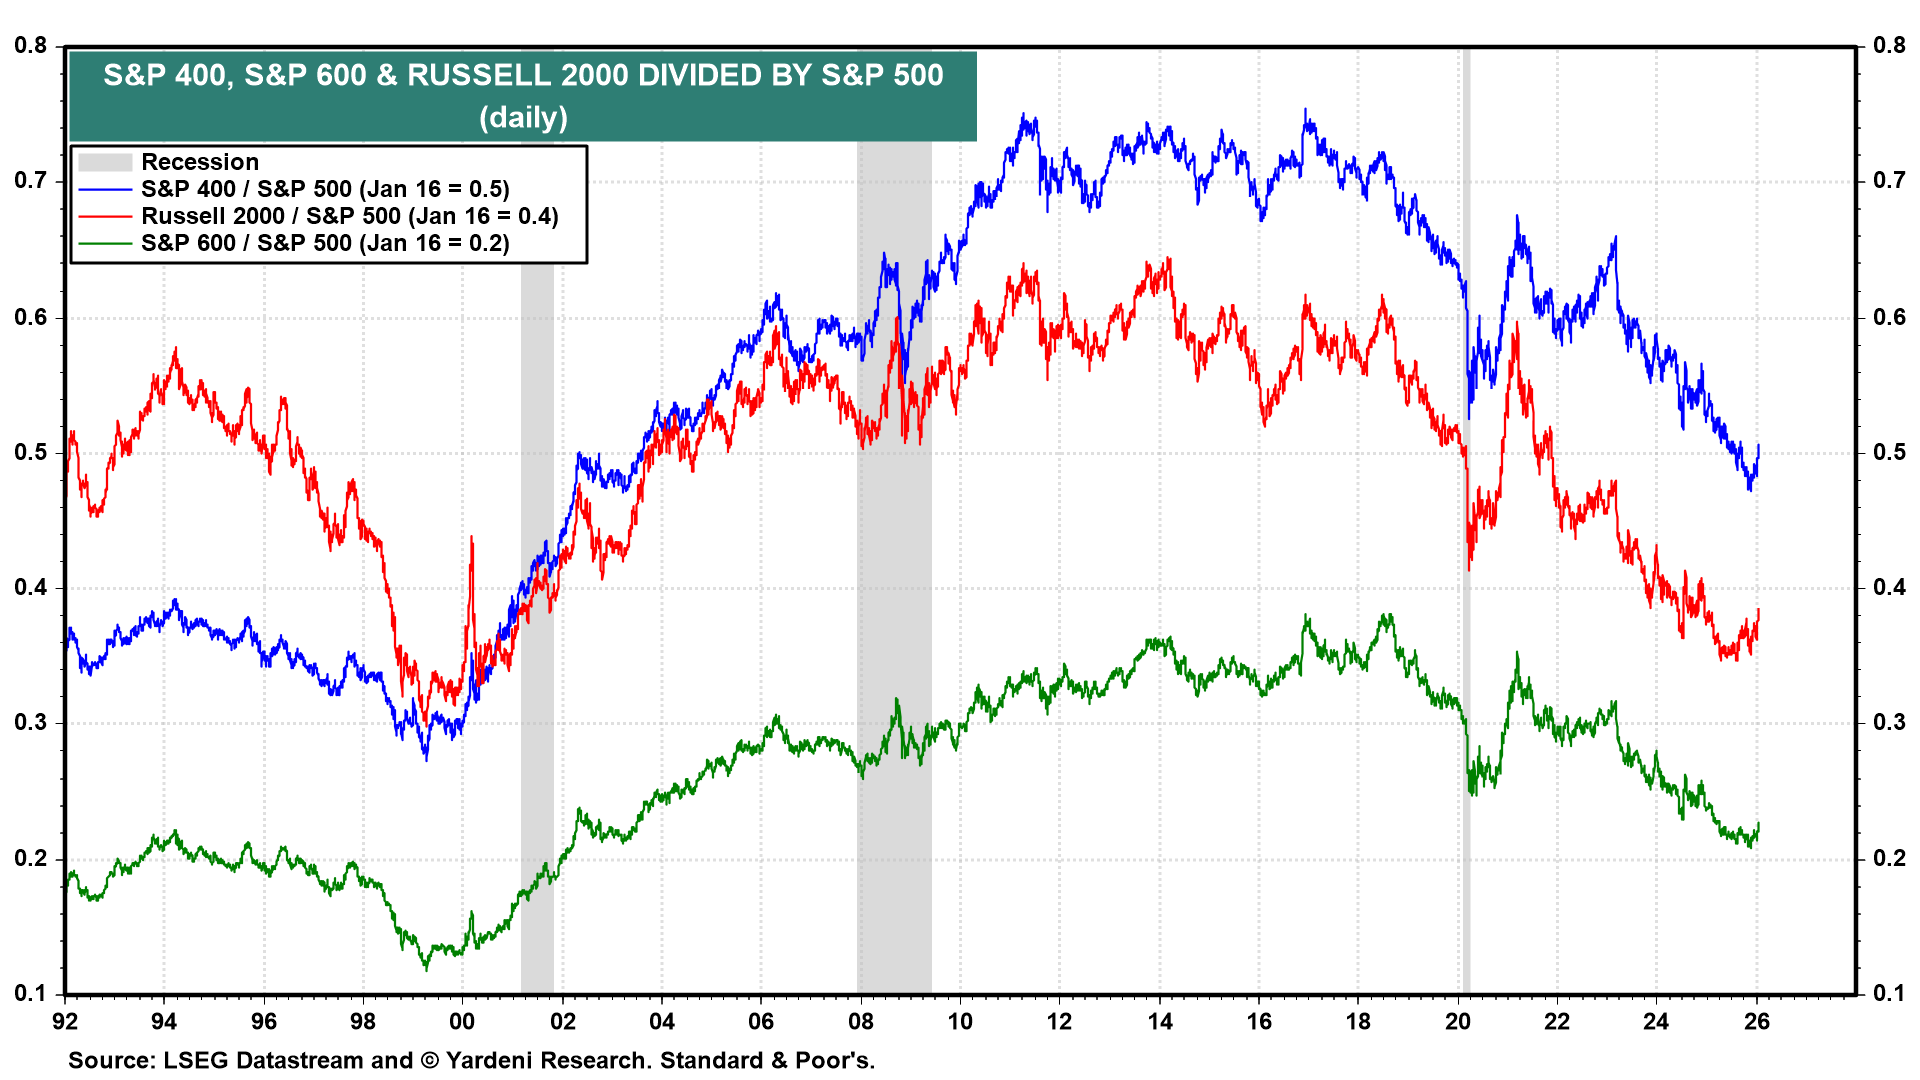
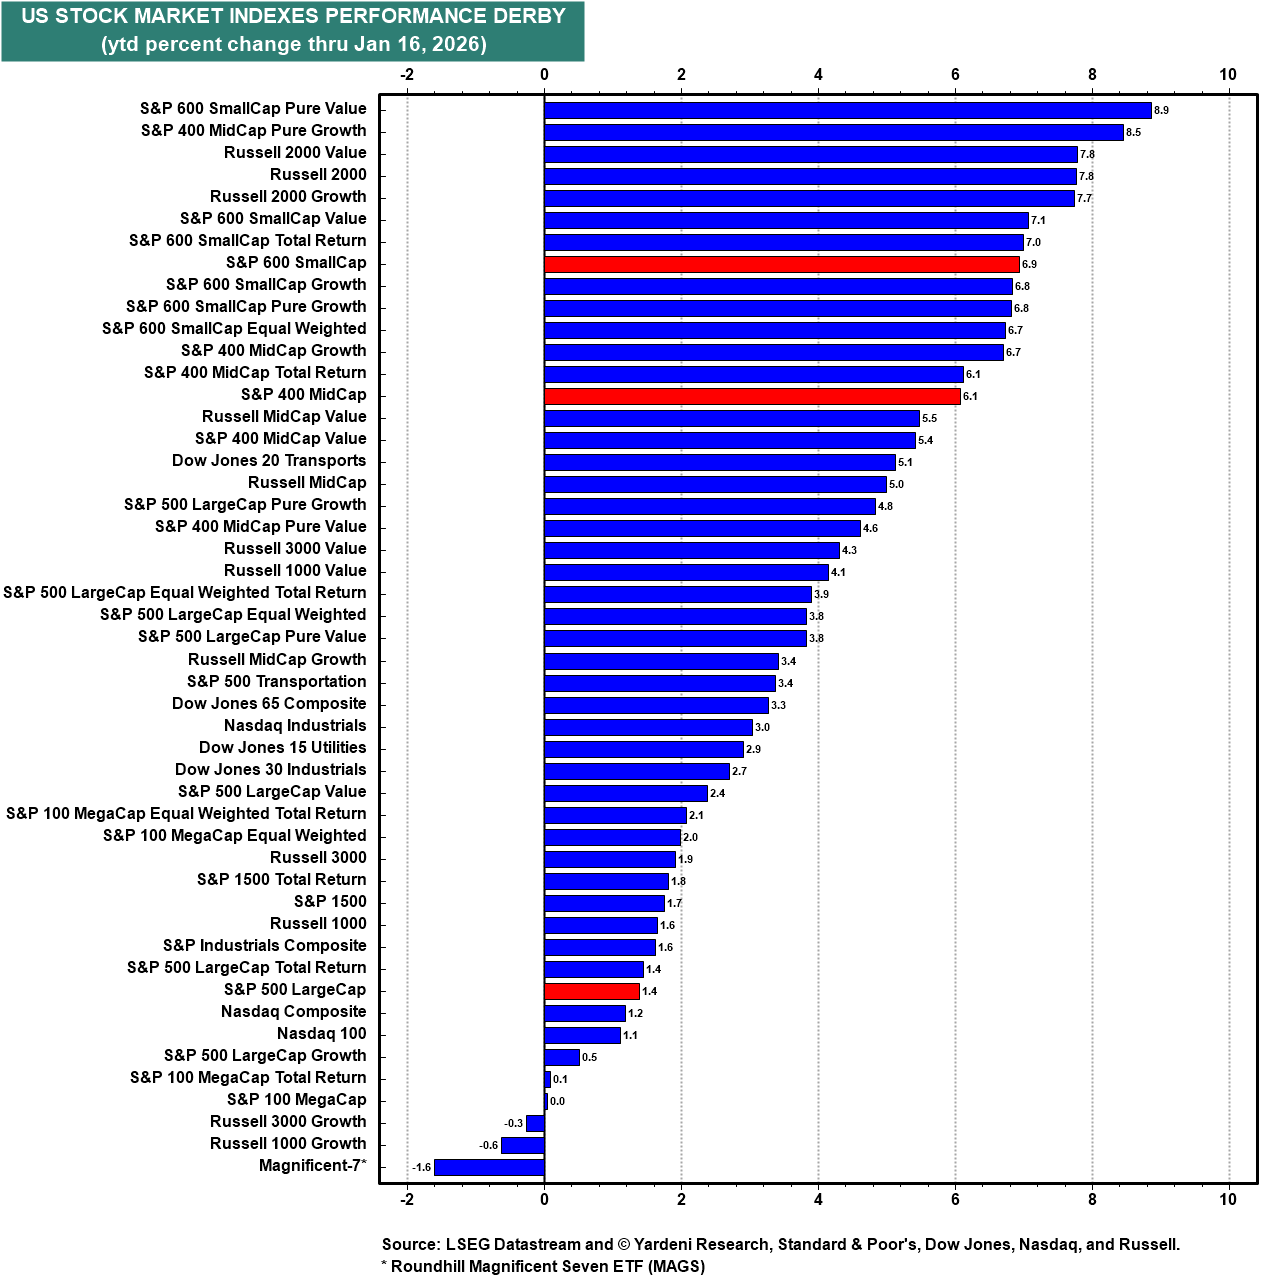
So far this year, the S&P 600 SmallCap and S&P 400 MidCap indexes are solidly beating the S&P 500 LargeCap index (chart).
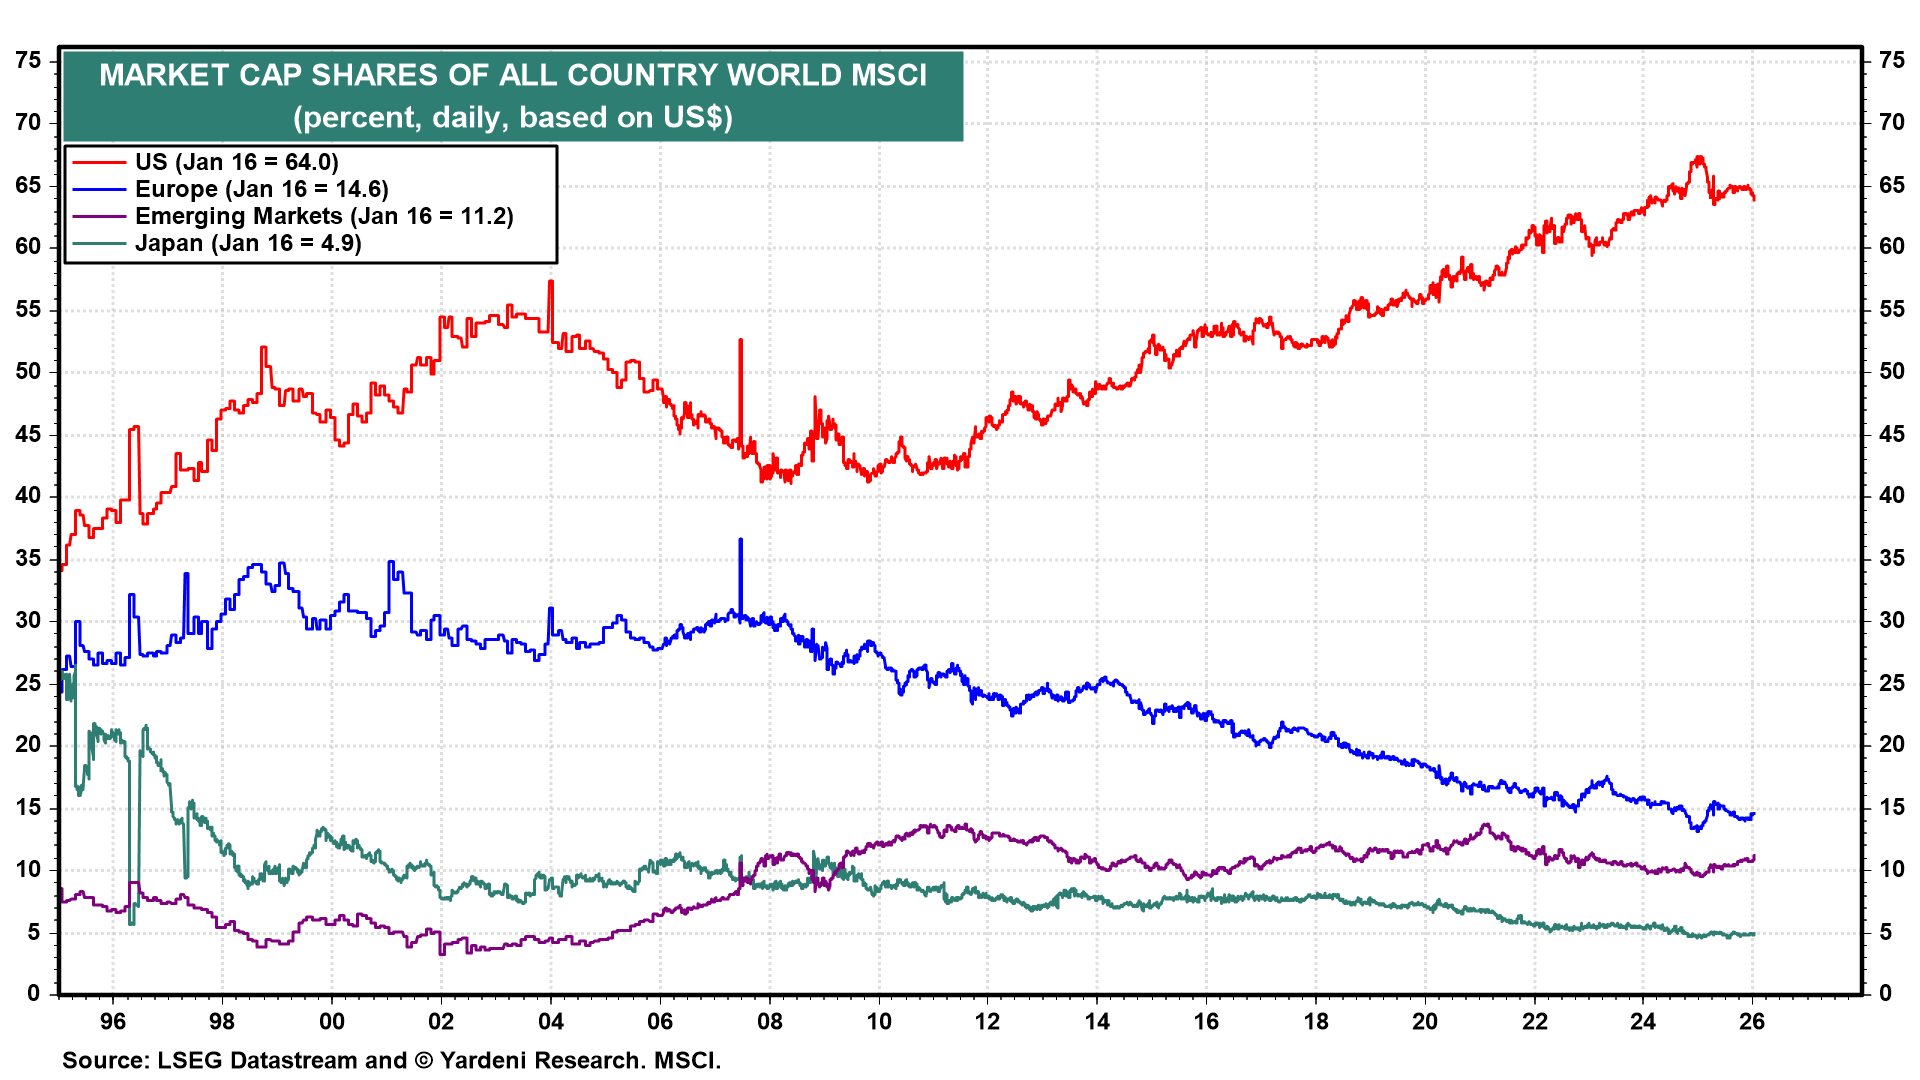
(5) On a global basis, the US might be at peak exceptionalism as measured by its market-cap share of the All Country World MSCI. The US undoubtedly will remain exceptional in many ways. However, that might be fully discounted by the US MSCI’s current market-cap share of the All Country World MSCI, at 64.0% (chart). Meanwhile, rapidly growing middle classes in emerging market economies clearly aspire to achieve greater prosperity.
The forward P/E of the All Country World MSCI has been rising over the past three years (chart). However it remains well below that of the US.

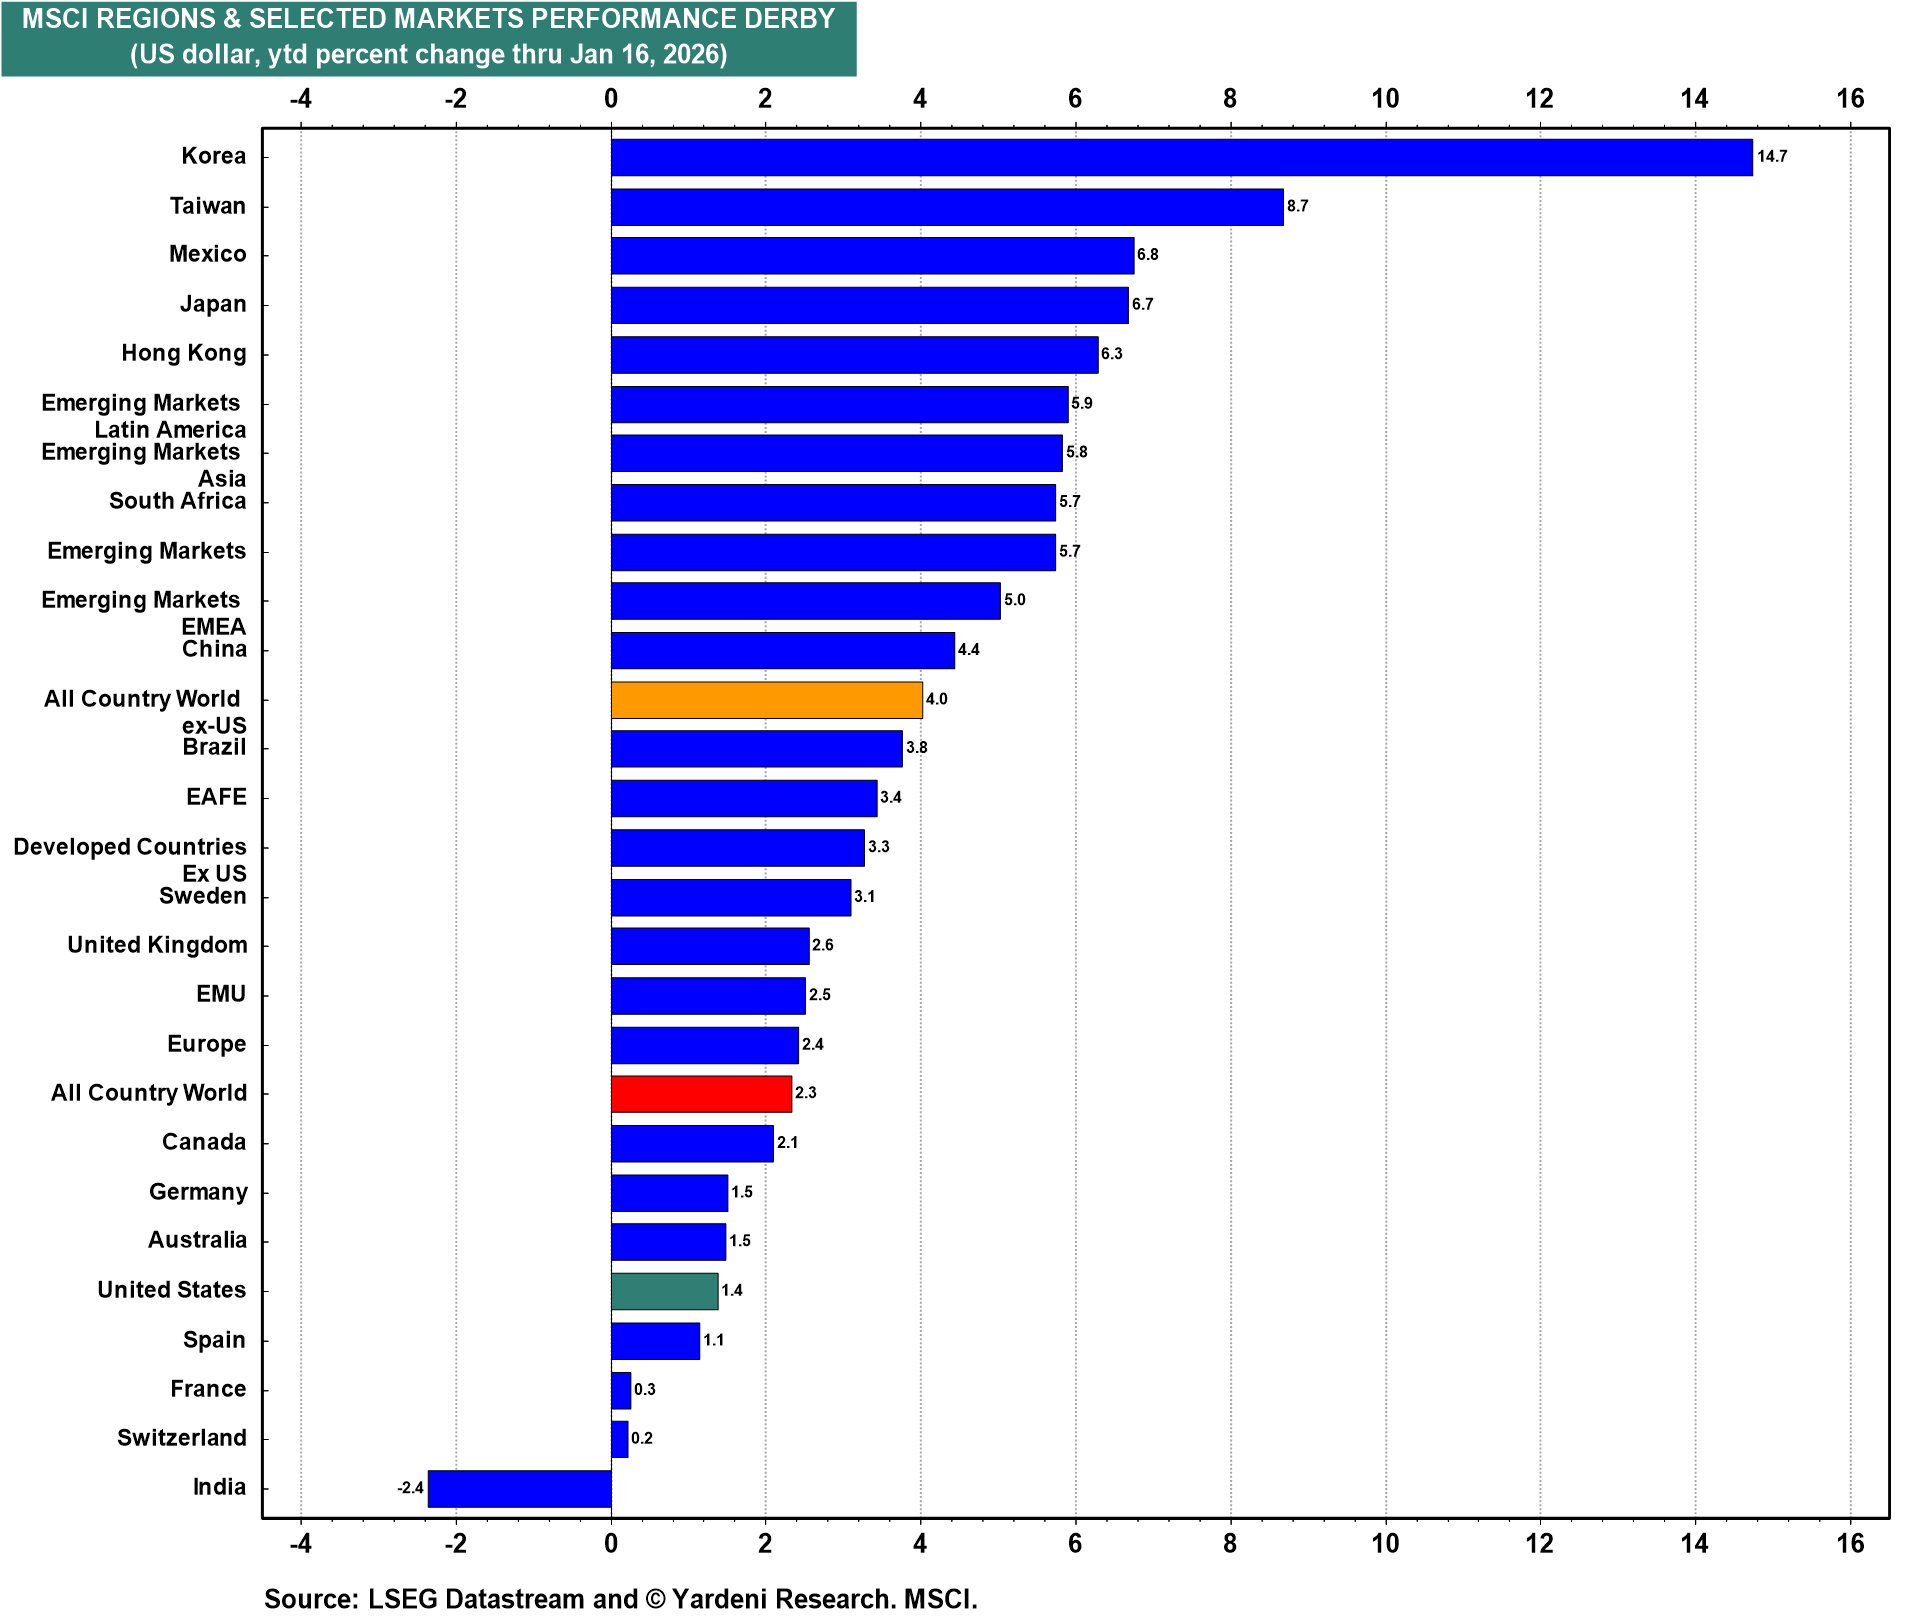
As occurred last year, the US MSCI stock price index continues to underperform many of the world's other MSCI stock price indexes so far in 2026 (chart).