


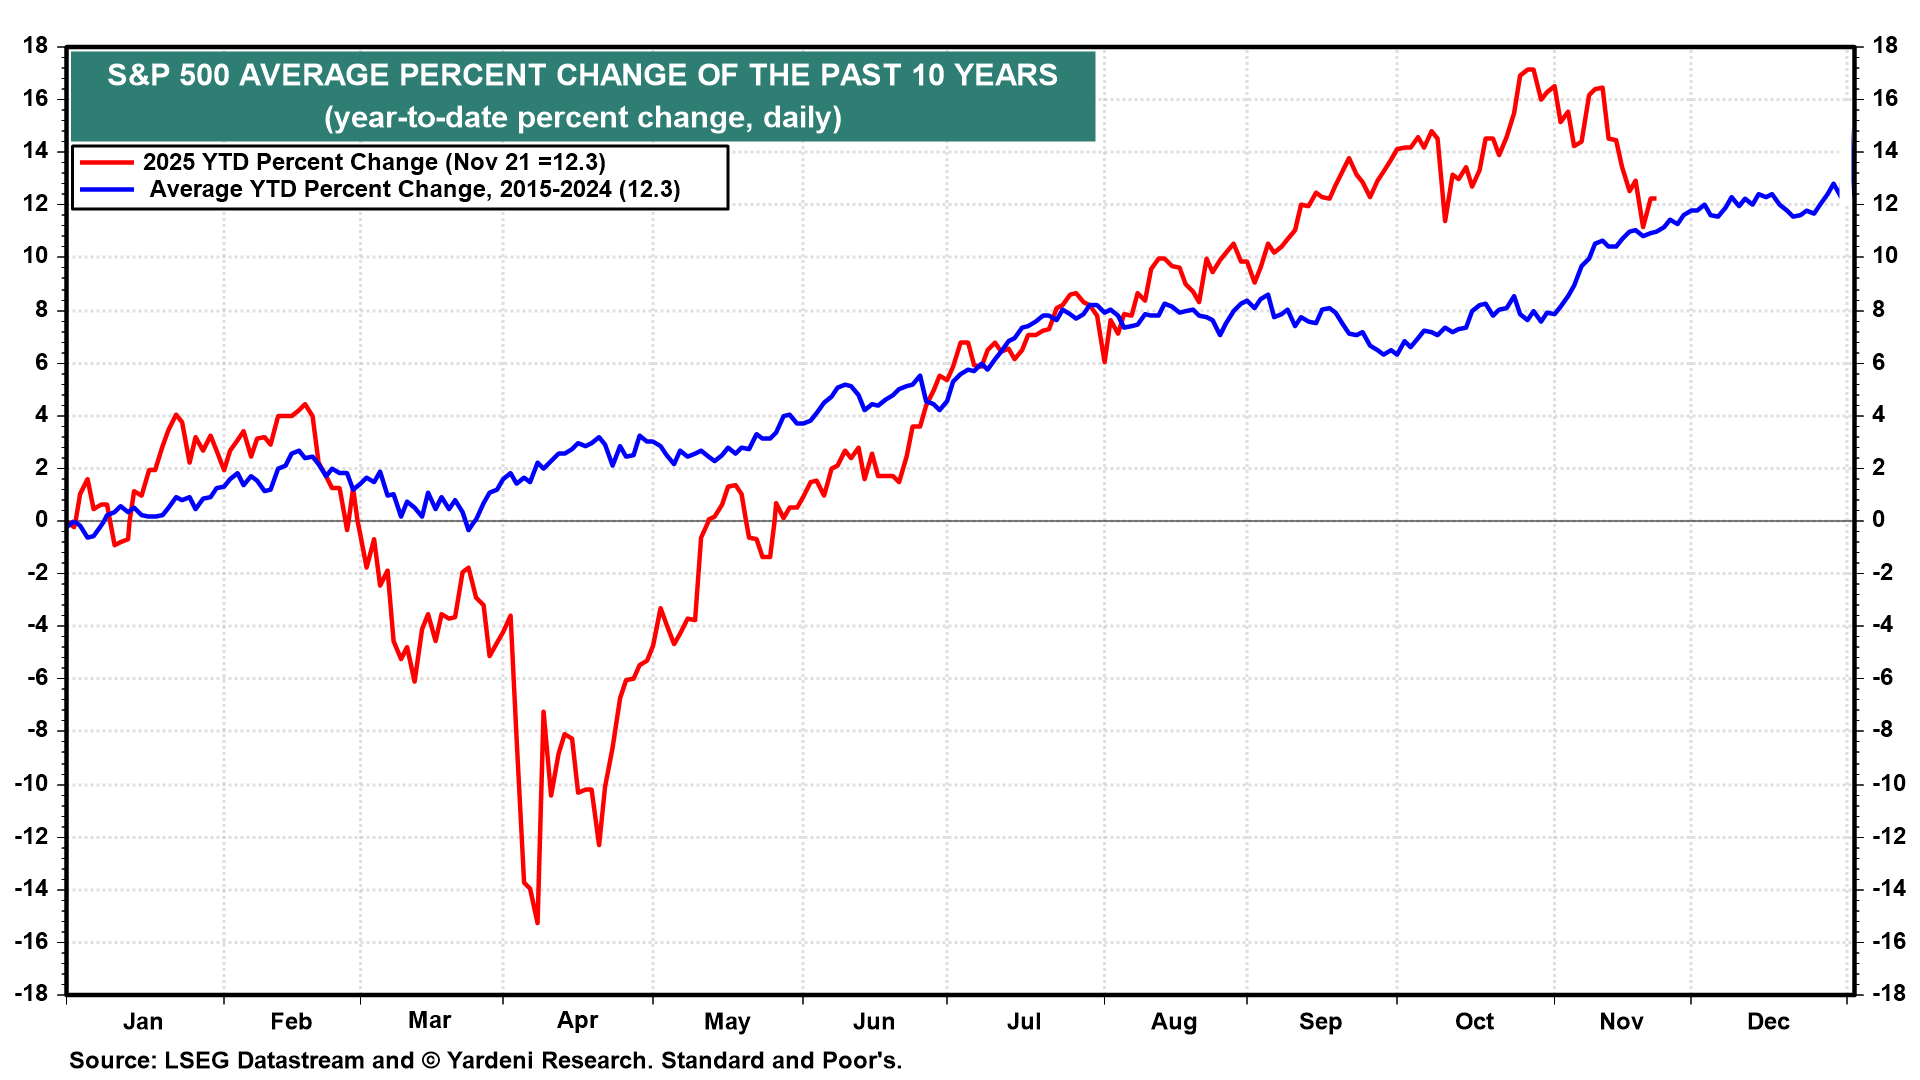
The S&P 500 is back on a slower track than the fast track it was on since April 9 until the end of October. It no longer is outpacing its average year-to-date performance over the past 10 years (chart). In fact, it is up 12.3% ytd, matching the average year-end performance of the past 10 years.
However, the S&P 500 did peak at a record-high 6890.59 on October 29—close enough to our year-end target of 7000 for us to declare “mission accomplished” retroactively. The 7000 milestone now is more likely to be reached early next year. We are still targeting 7700 by the end of next year.
What has changed is that, while the AI bubble isn't bursting, it is losing some air. That's actually a positive development for the sustainability of the current bull market, which began on October 12, 2022.
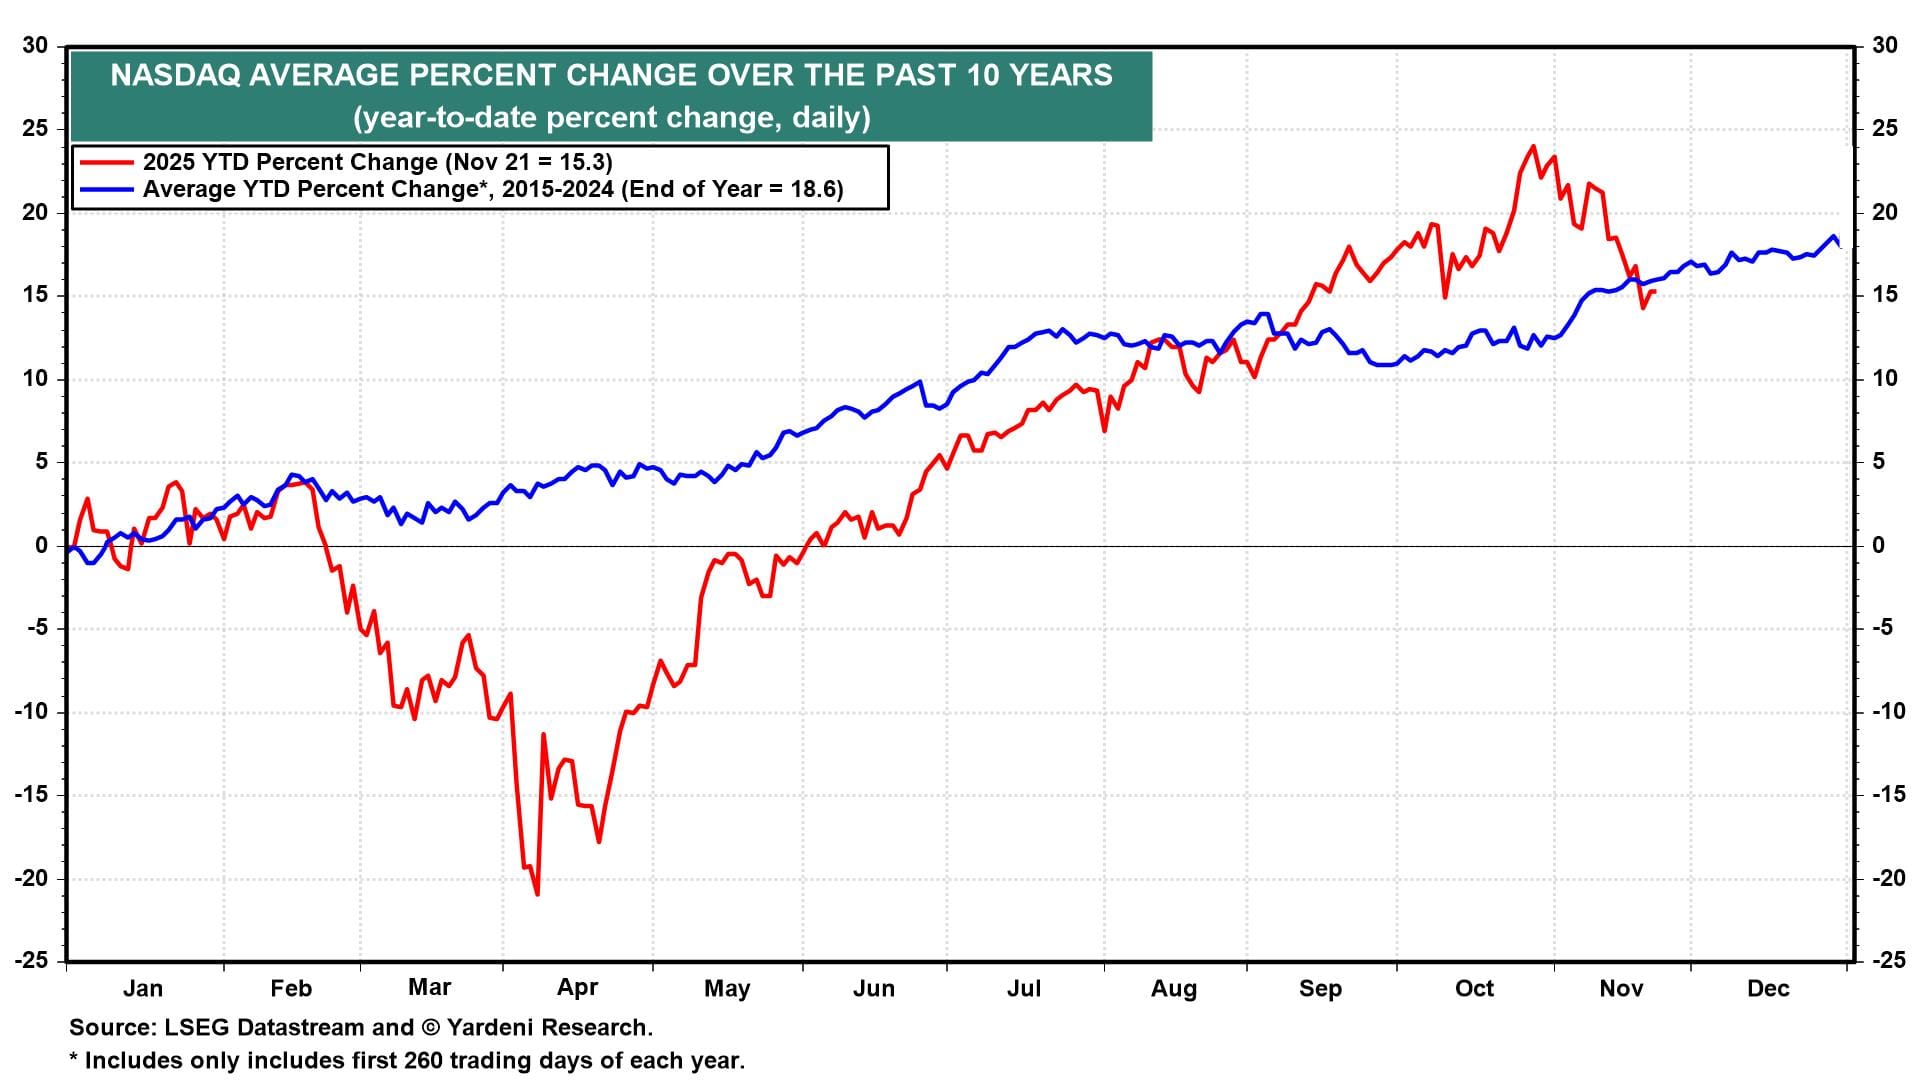
The broad market, as measured by the equal-weighted S&P 500, is back down to its 200-day moving average; we don’t expect that level to be breached. The market-capitalization-weighted S&P 500 is still 7.2% above its 200-day moving average, which we don't expect will be tested. The Nasdaq is still up 15.3% ytd, just about matching the ytd performance of the 10-year average (chart).
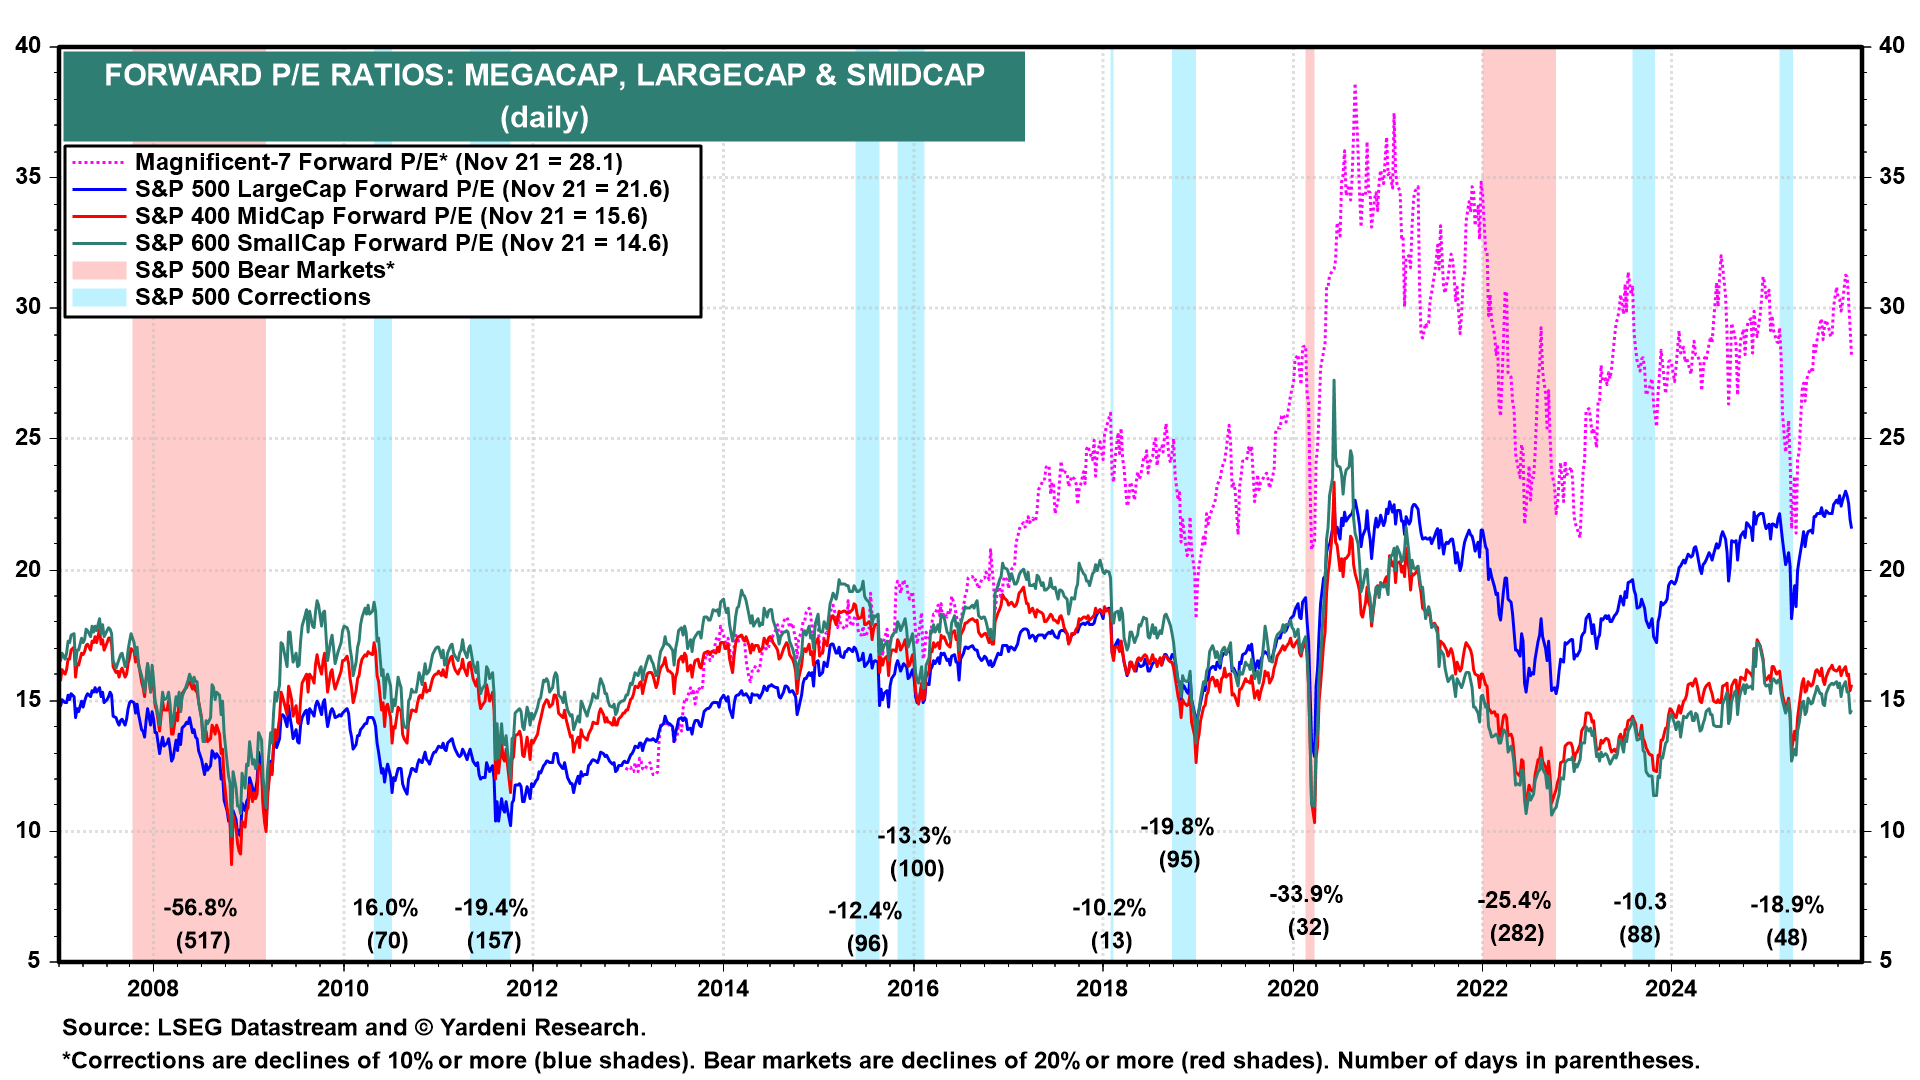
We acknowledge that the current pullback could turn into a correction (i.e., a drop of 10%-20% from the peak). Investors have lost their confidence in anyone's ability to project, let alone understand, the accounting for the GPU chips purchased by the hyperscalers. As a result, the forward P/E of the Magnificent-7 (which includes the major hyperscalers) has dropped from 31.0 to 28.1 since late October (chart). There might be more downside in this multiple.
The plunge in bitcoin's price also accounts for some of the recent weakness in the stock market. Investors in bitcoin are likely to own high-flying stocks too. Once their panic selling subsides, the stock market should recover. That could happen over the next couple of weeks, setting the stock market up for a good year-end rally.
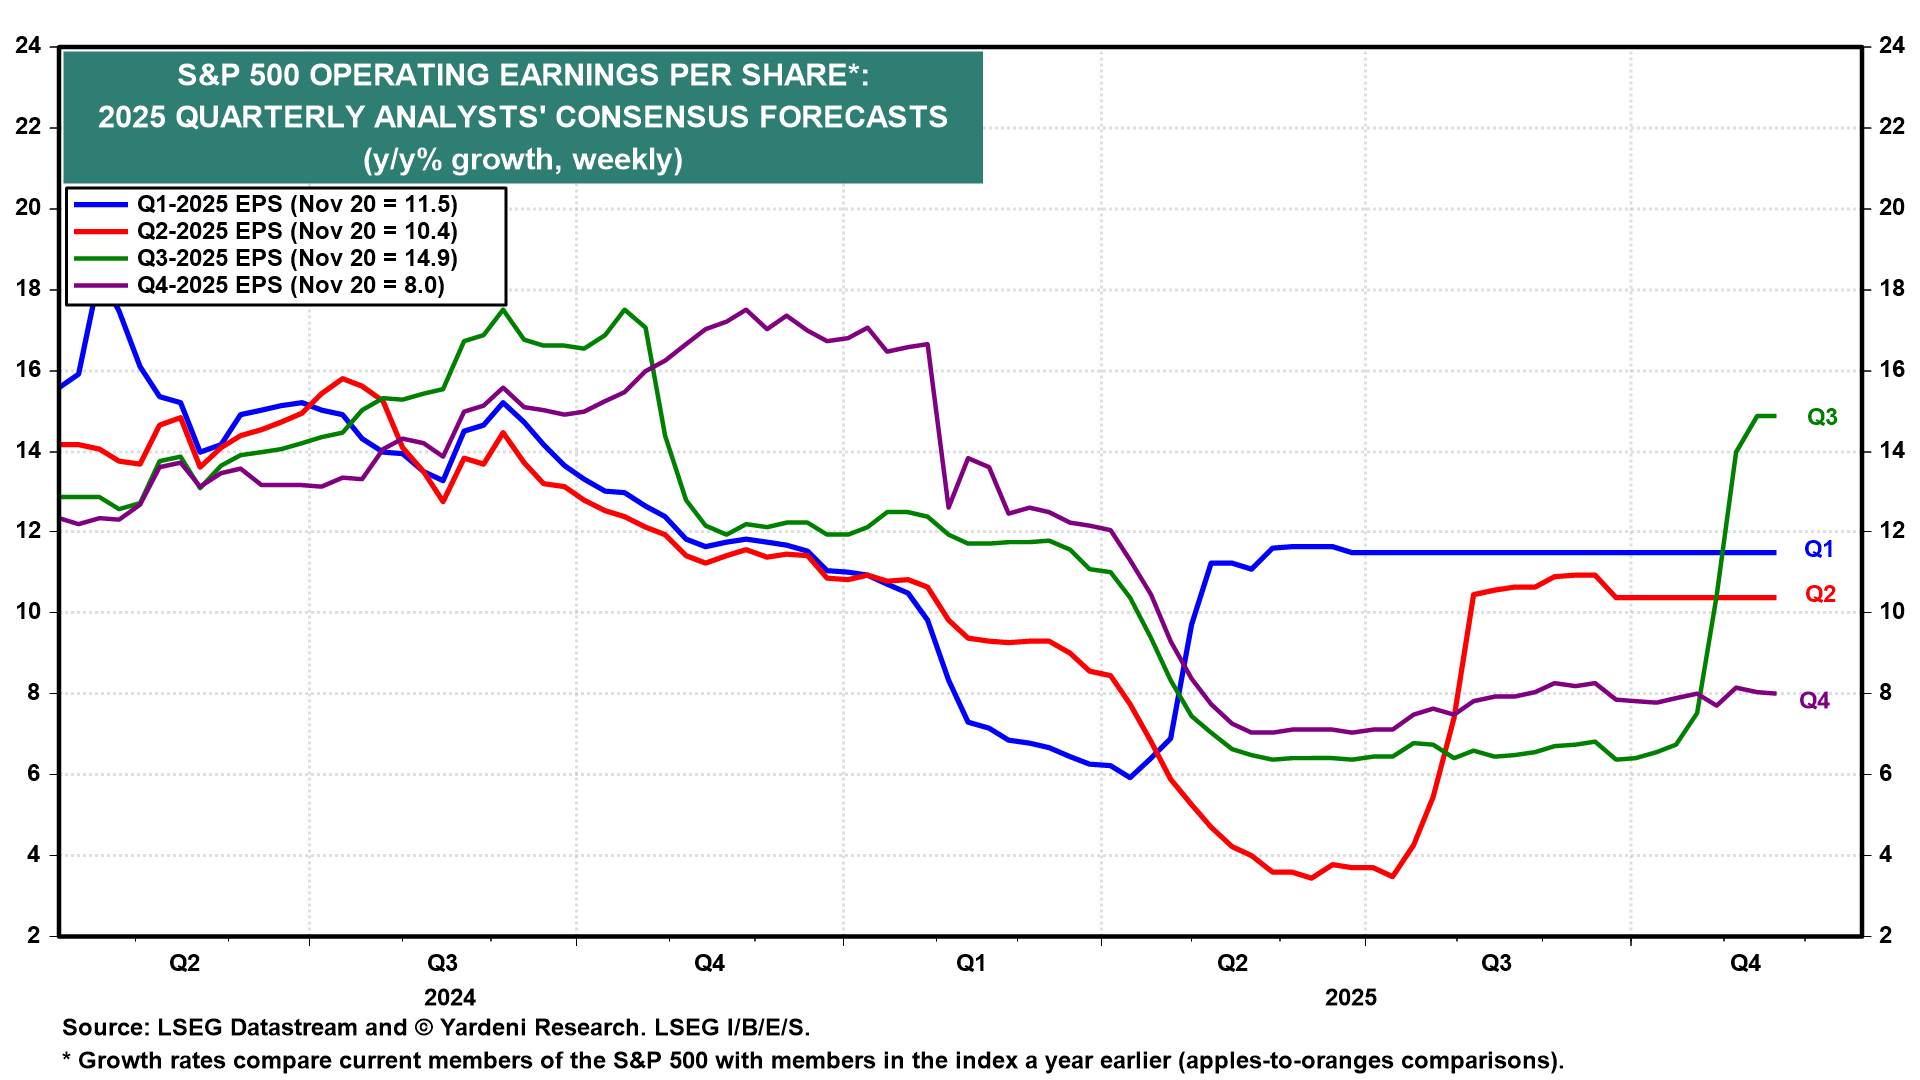
Investors' short-term valuation concerns should be offset by the ongoing strength of S&P 500 earnings. Over the past three quarters, earnings growth was about twice as strong as analysts' consensus estimates (chart).
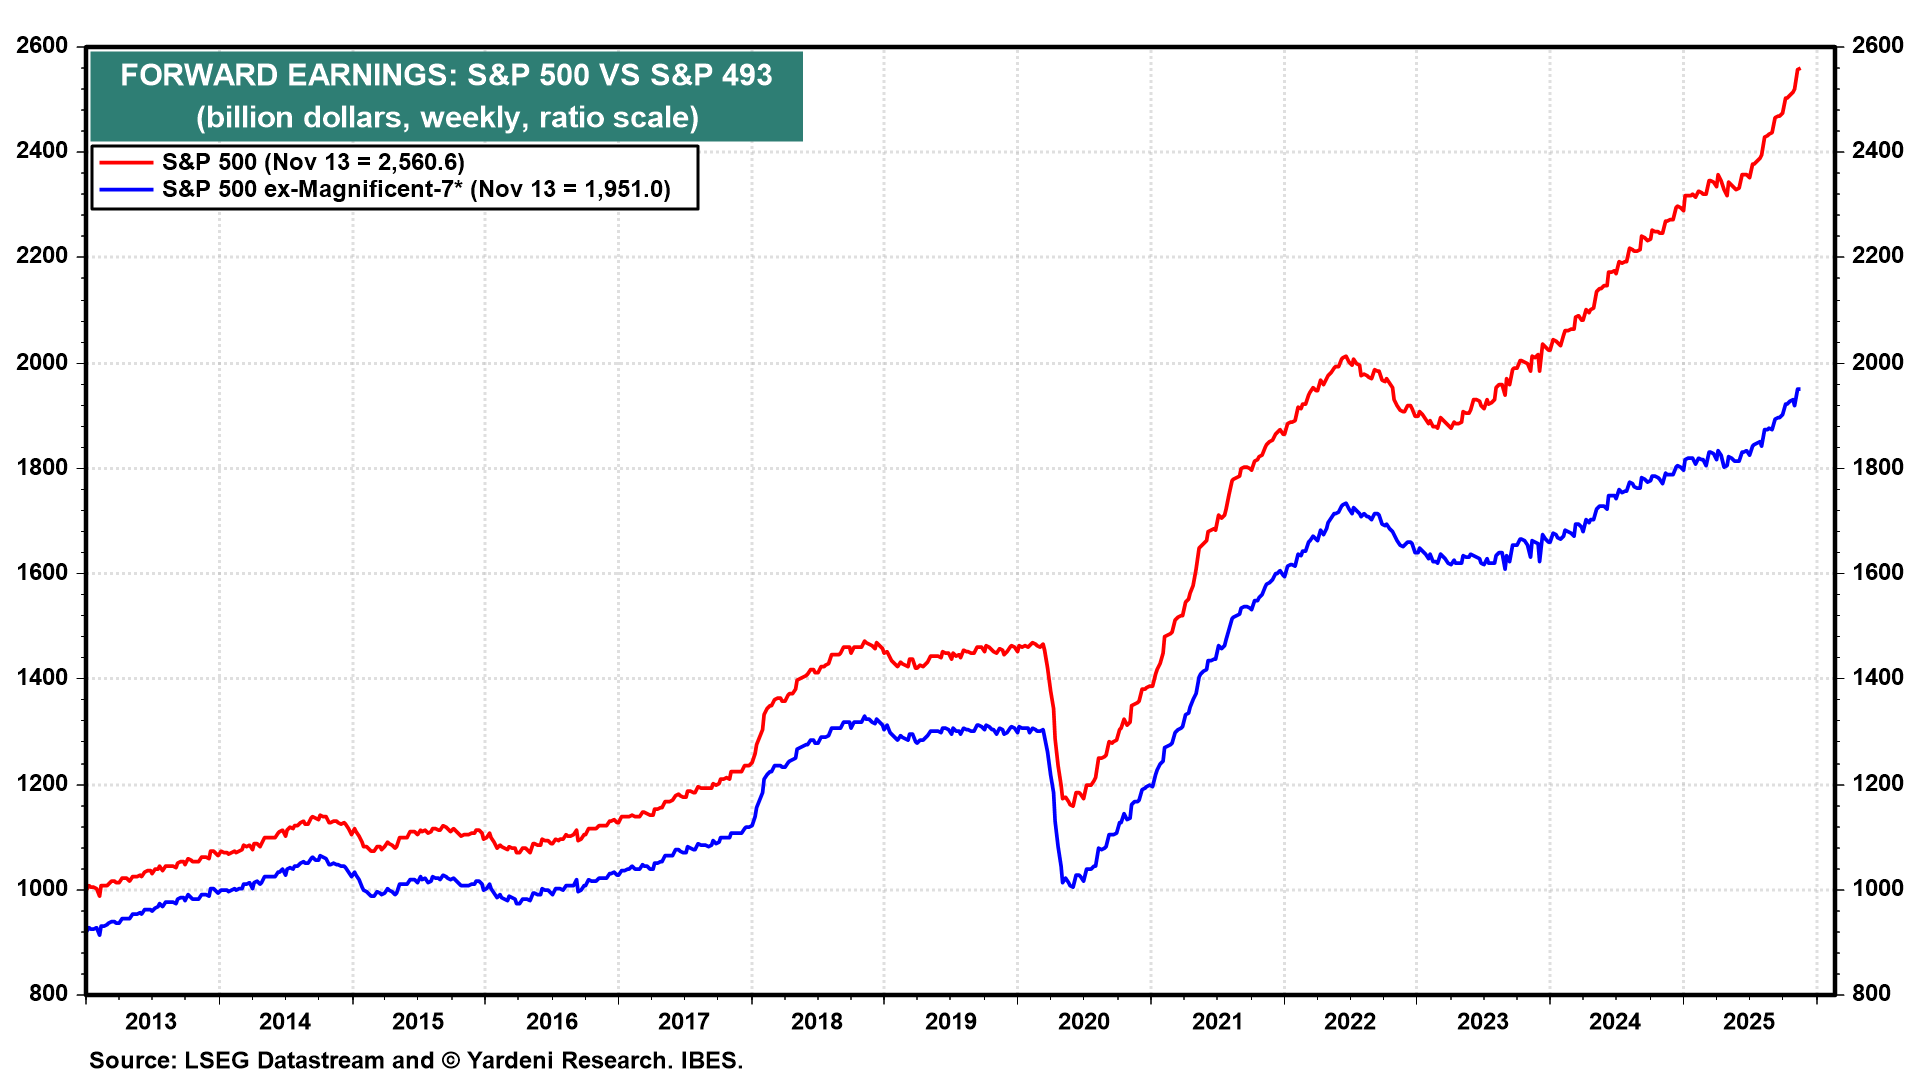
The forward earnings of the S&P 500 continues to rise to record highs (chart). By year-end, it will have converged on the 2026 analysts' consensus estimate, which is currently $309.28 (chart).

The pushback narrative undercutting our happy earnings story is that the stock market’s strength this year owes much to the Magnificent-7’s strong performances given their outsized capitalization share, and those companies have been padding their earnings by depreciating their GPU chips over four to six years instead of a more appropriate one to three years. A related concern of investors is that, unlike most other chips, GPUs might not have a very long service life, especially if advanced versions are introduced every year. This has become a highly contentious issue that remains unresolved; it’s a significant “known unknown.”
But there is no debating the fact that the earnings of the “Impressive-493”—i.e., the S&P 500 minus the Mag-7—are also rising rapidly to record highs (chart). That’s a market-supportive “known known.”
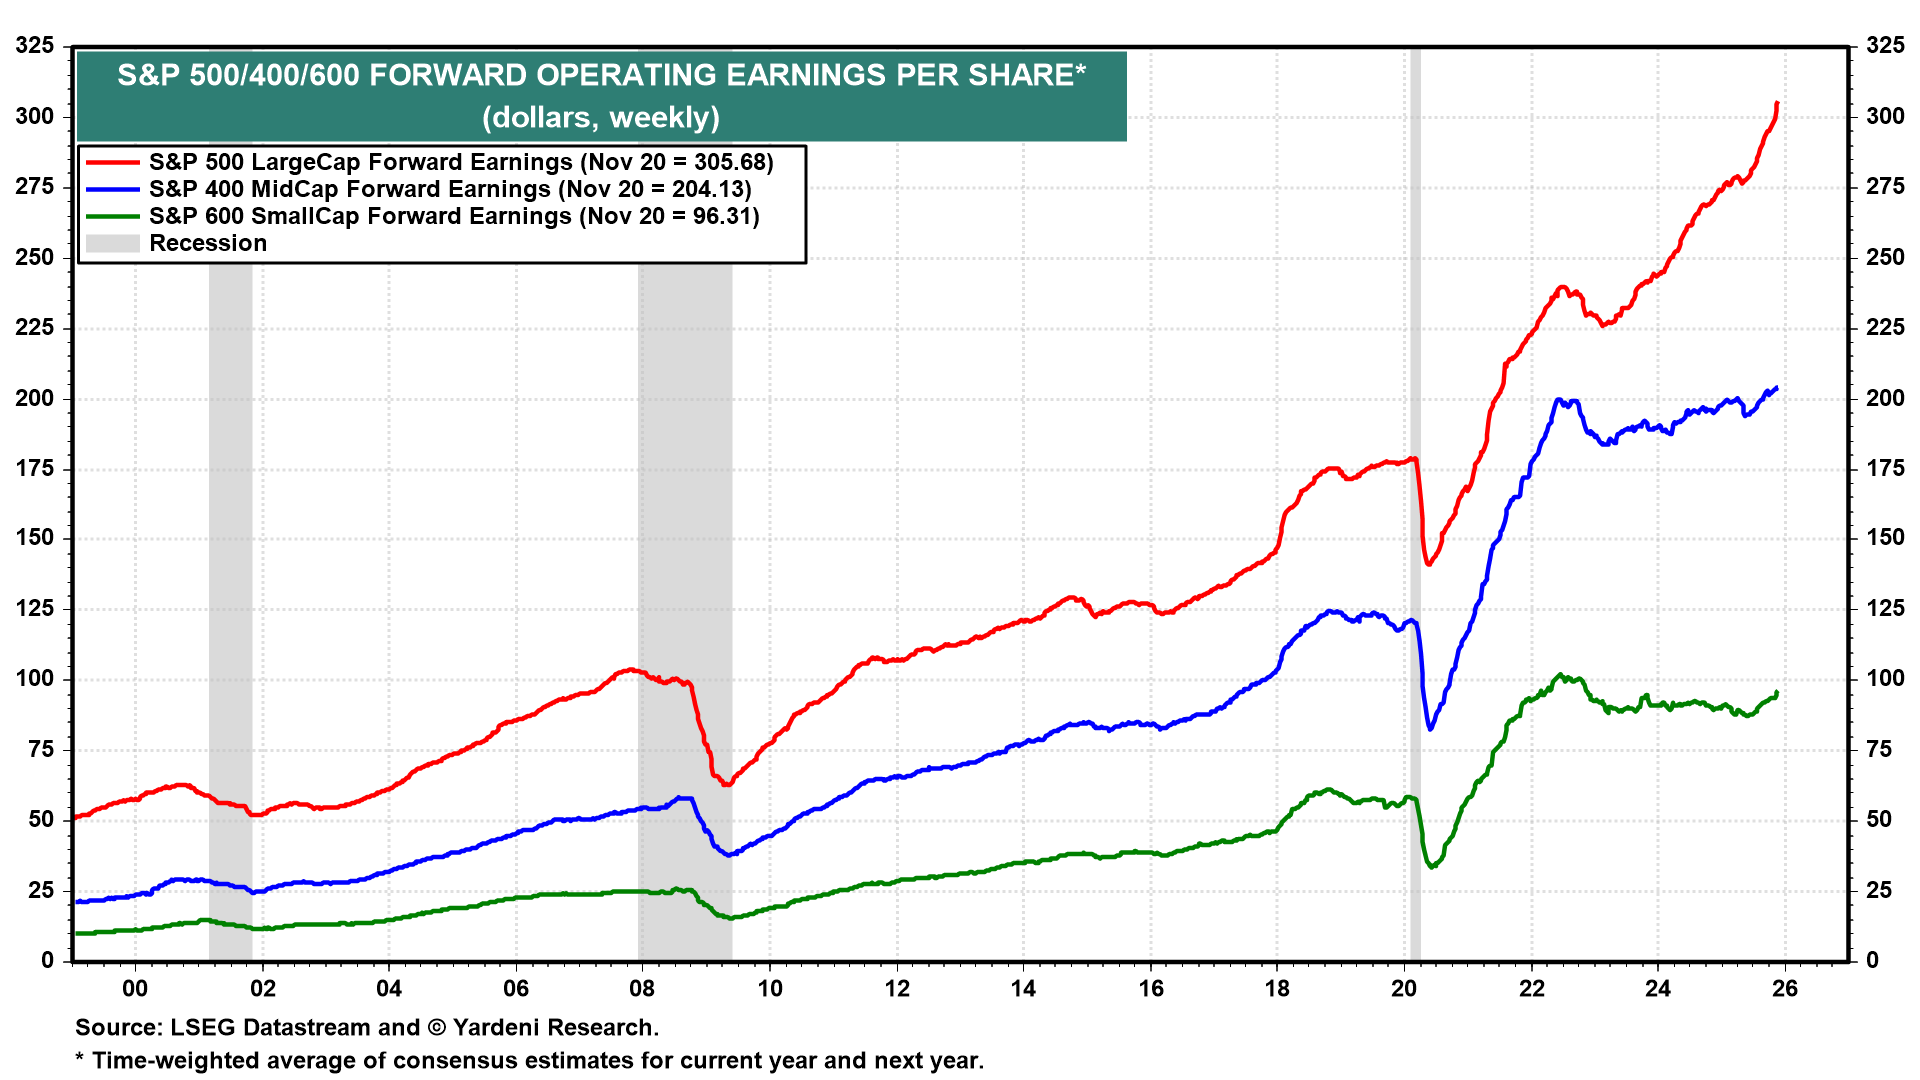
Less impressive are the forward earnings of the S&P 400 MidCaps and the S&P 600 SmallCaps (chart). Many “SMidCap” companies (as we call the two collectively) with the most promising prospects are acquired by large companies either before or after the small and mid-sized companies go public, and before they can become the next Microsoft or Eli Lilly.
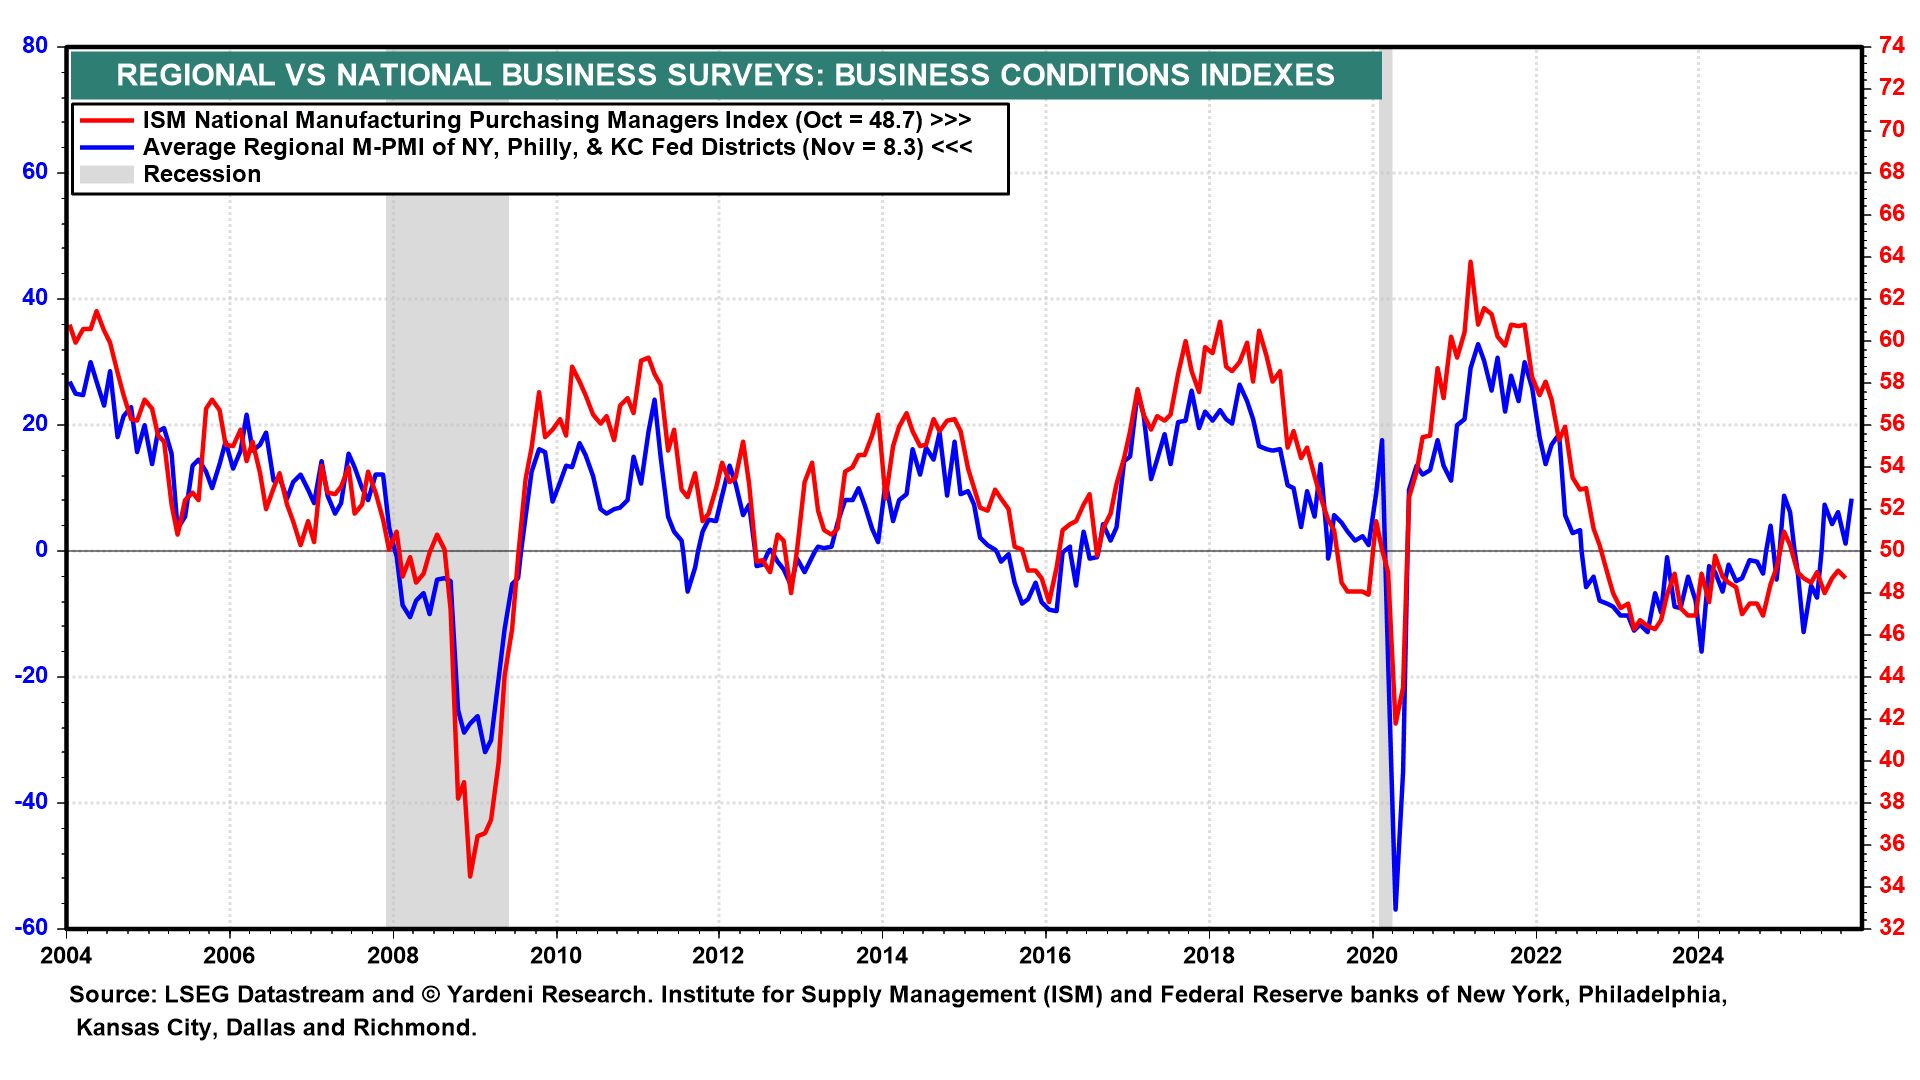
We continue to count on the resilience of the economy. The strength of earnings corroborates it. In addition, we are encouraged to see that the November average of the three available regional business surveys suggests that the national M-PMI might have rebounded above 50.0 this month (chart).
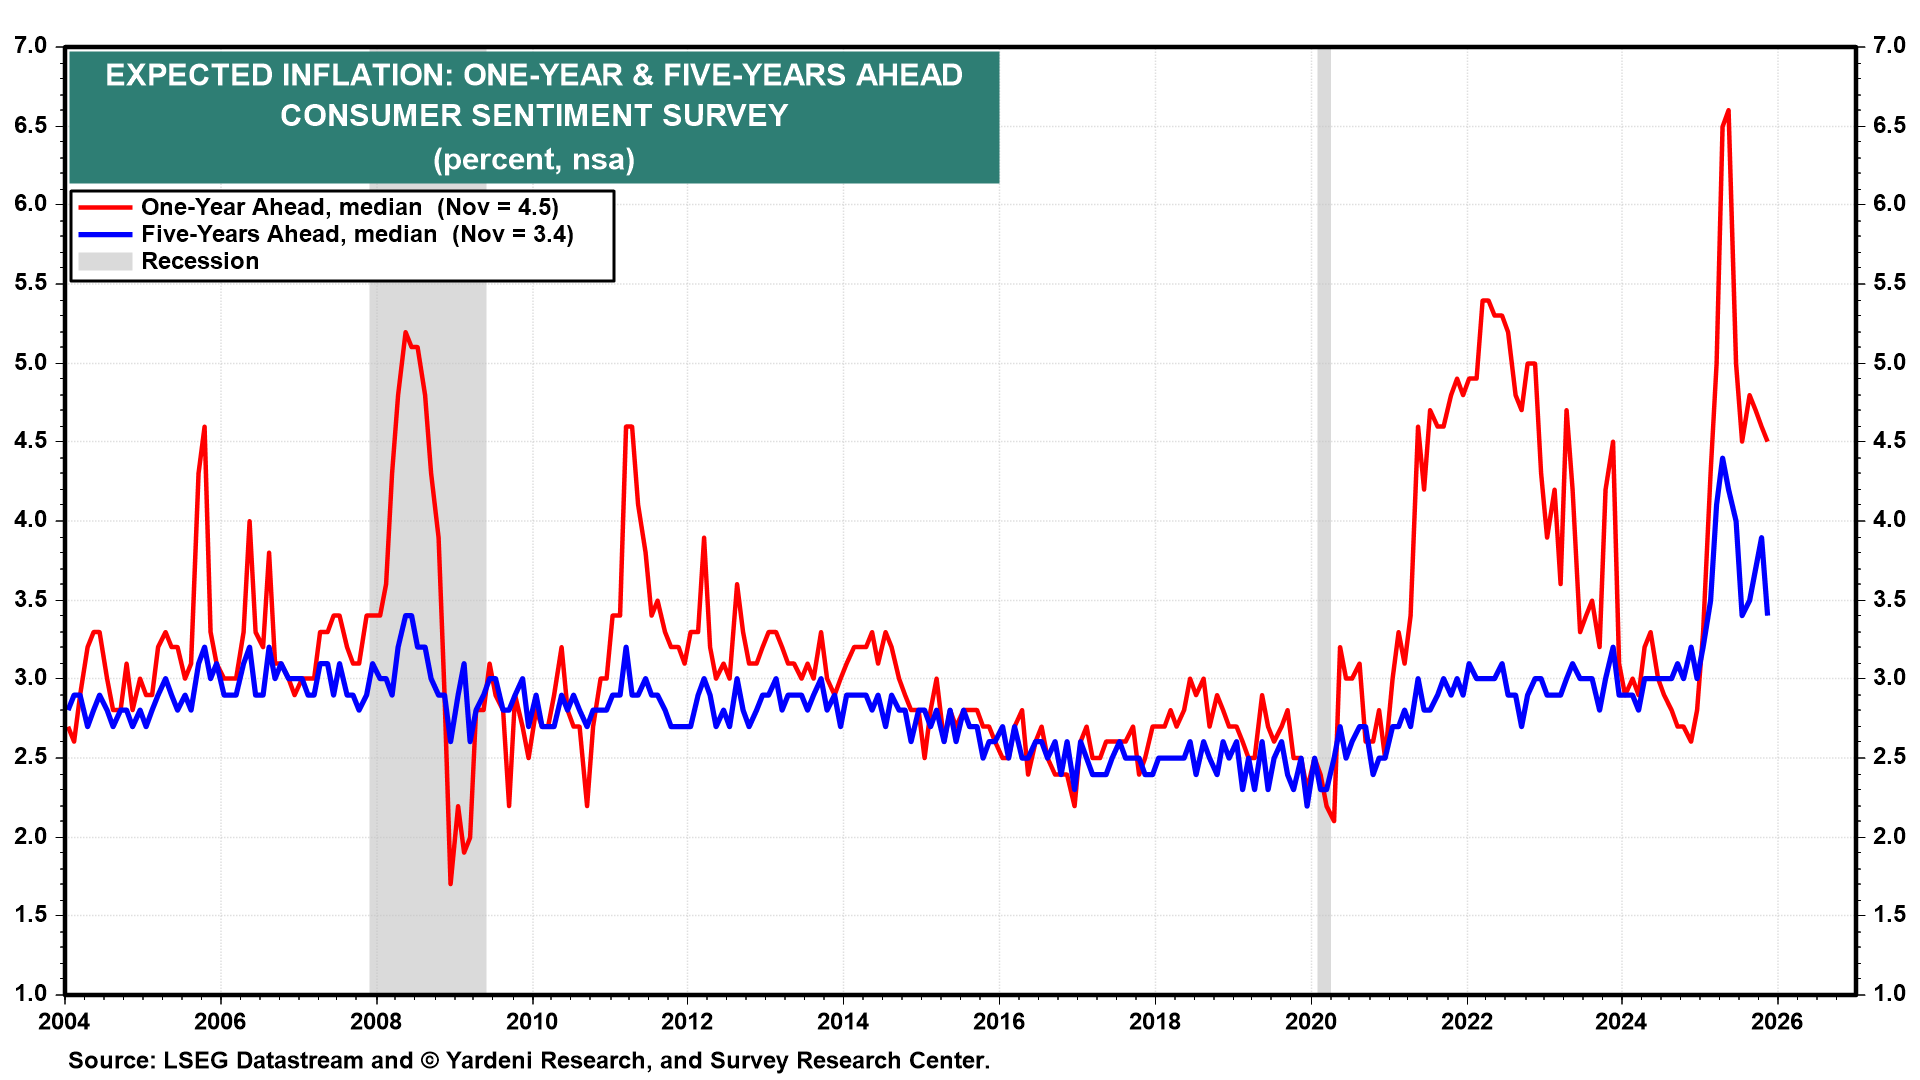
Separately, Fed officials have been debating publicly whether to lower the federal funds rate at the FOMC's December 9-10 meeting. The doves are concerned about the rising unemployment rate. The hawks are more concerned that inflation remains above the Fed's 2.0% y/y target. In addition, inflationary expectations remain elevated (chart).
This past week's action in the S&P 500 shows a rotation out of the Information Technology and Consumer Discretionary sectors and into the Health Care and Consumer Staples sectors. We are leaning toward overweighting Health Care while market-weighting both Information Technology and Communications Services. Stay tuned.
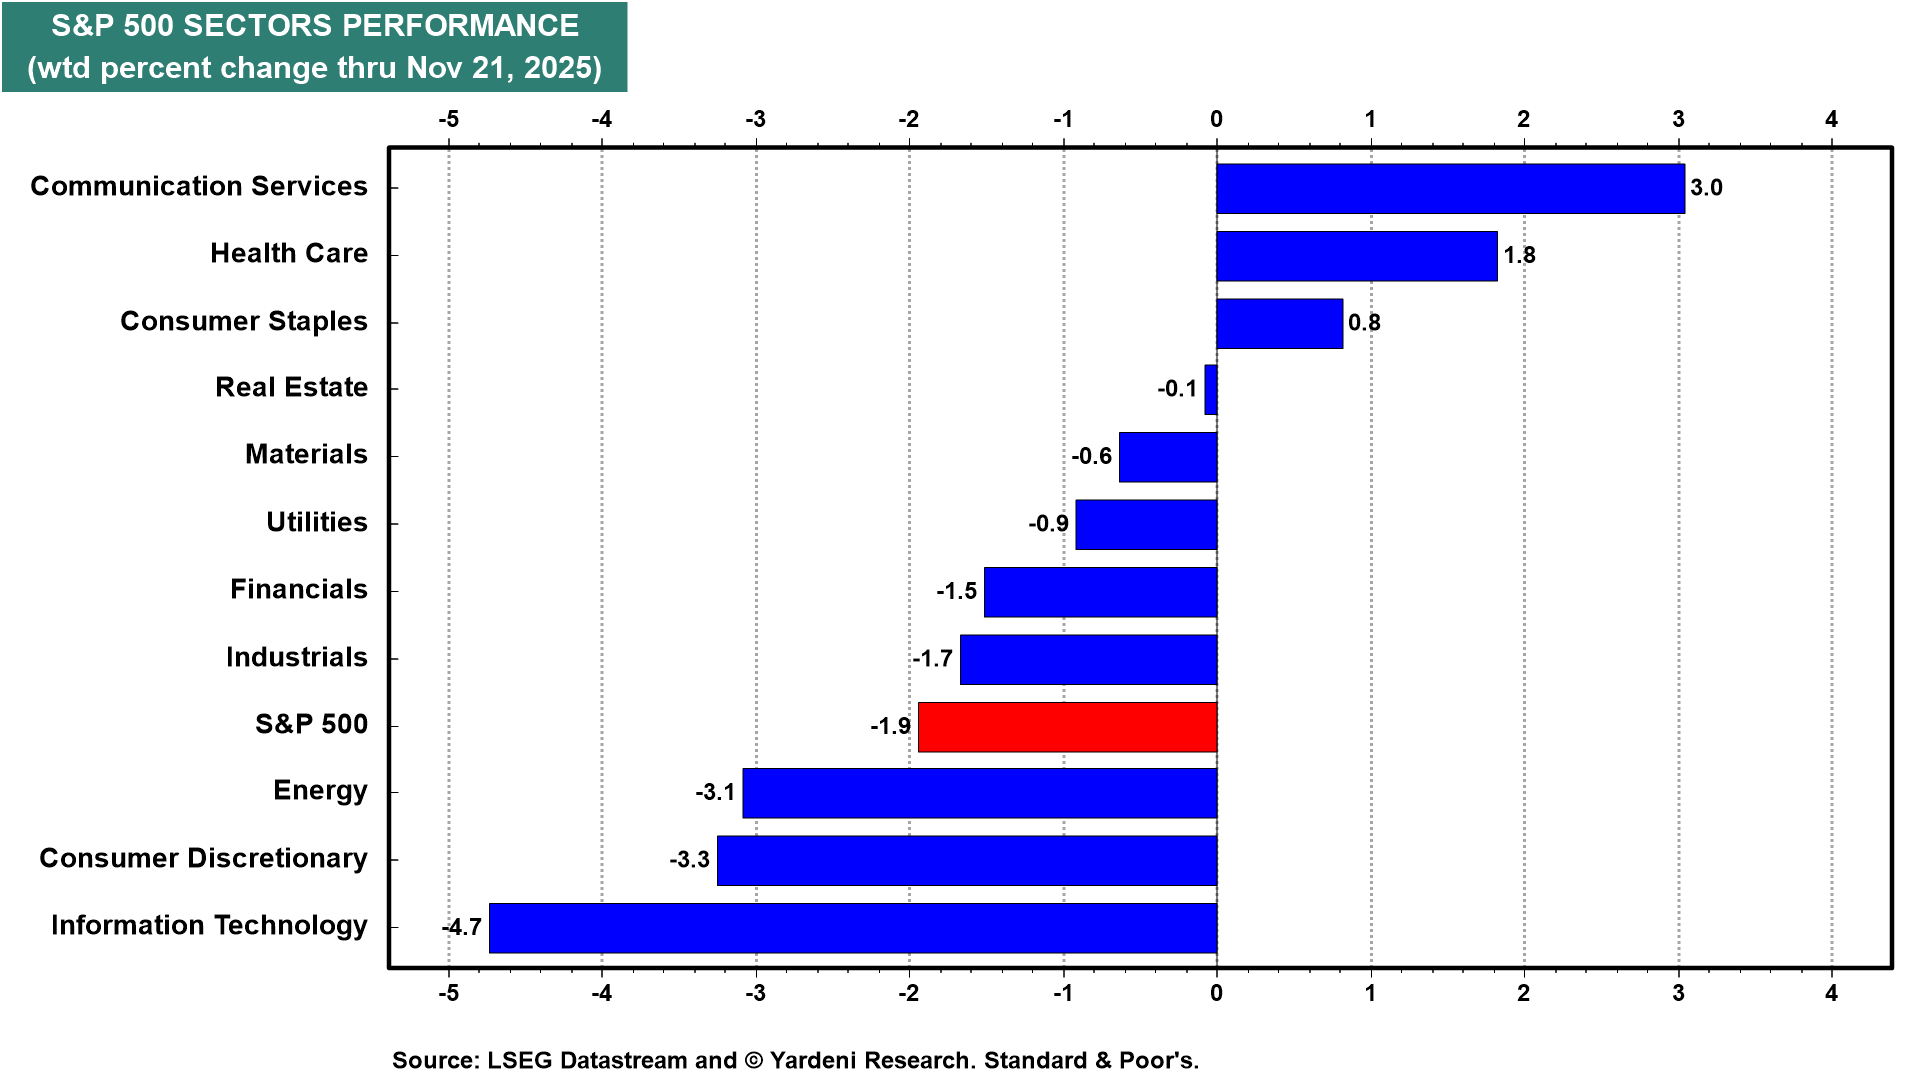
Below is a table showing the performances of the 11 sectors and 100+ industries of the S&P 500 over the past difficult week.
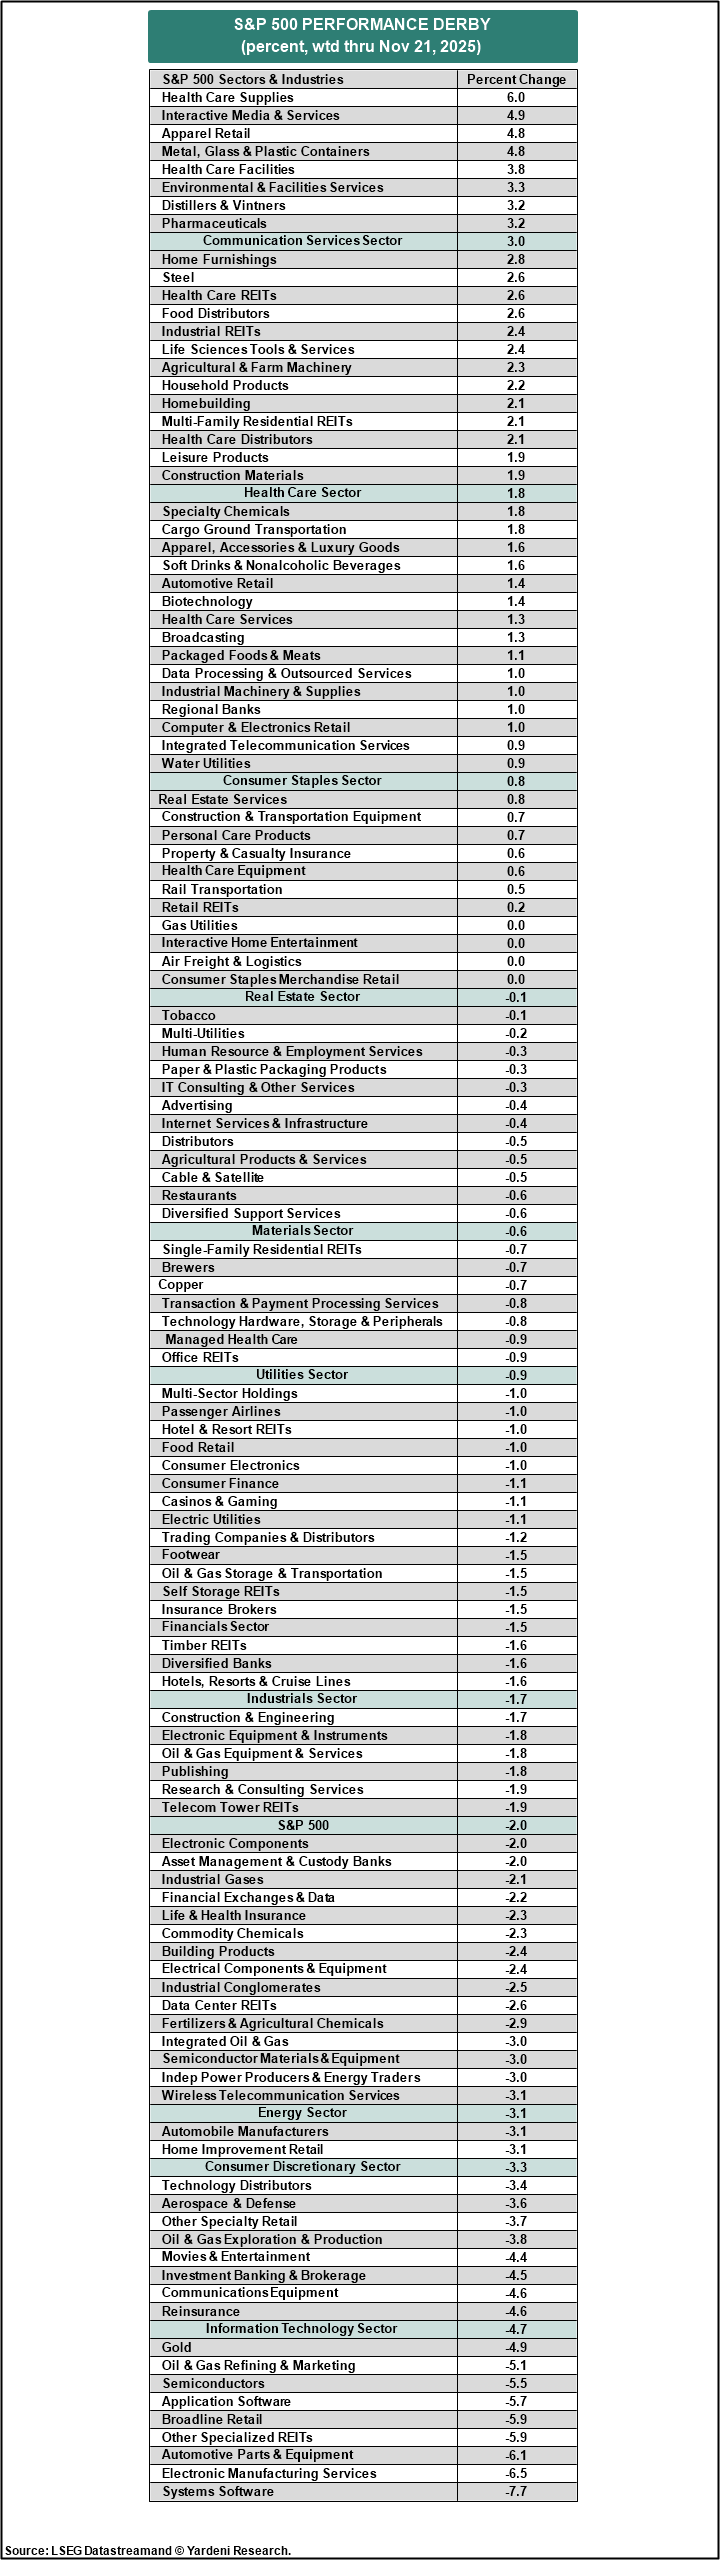
Last week was also a rough one for overseas stock markets (chart).
