So is the economy slowing or speeding up? Yes, it is doing both according to today's batch of economic indicators. No wonder that neither stocks nor bonds did much today. The calm in the stock market was notable given that President Donald Trump was Tariff Man again on Friday, blasting China for not abiding by the temporary and partial tariff truce with the US and doubling the tariff on steel and aluminum from 25% to 50%. The gold market went up on that news as well as on reports that Ukraine destroyed a third of Russia's strategic bomber fleet with drones. The Ukrainians are coming!
In any event, there was no slowdown in today's Atlanta Fed GDPNow tracking model, which now shows Q2 real GDP up a whopping 4.6% (saar), up from the previous estimate of 3.8%. Consumer spending was revised up from 3.8% to 4.6%, while capital equipment spending was revised up from 5.1% to 8.8%. The most widely anticipated recession of all times remains a no-show, as it has for the past three and a half years. (Some of Q2's strength is reversing Q1's weakness (-0.2% real GDP), which was attributable to unusually cold weather and front-running Trump's tariffs.)
Why is the economy so resilient? Let's put a positive spin on today's other indicators, which were weak:
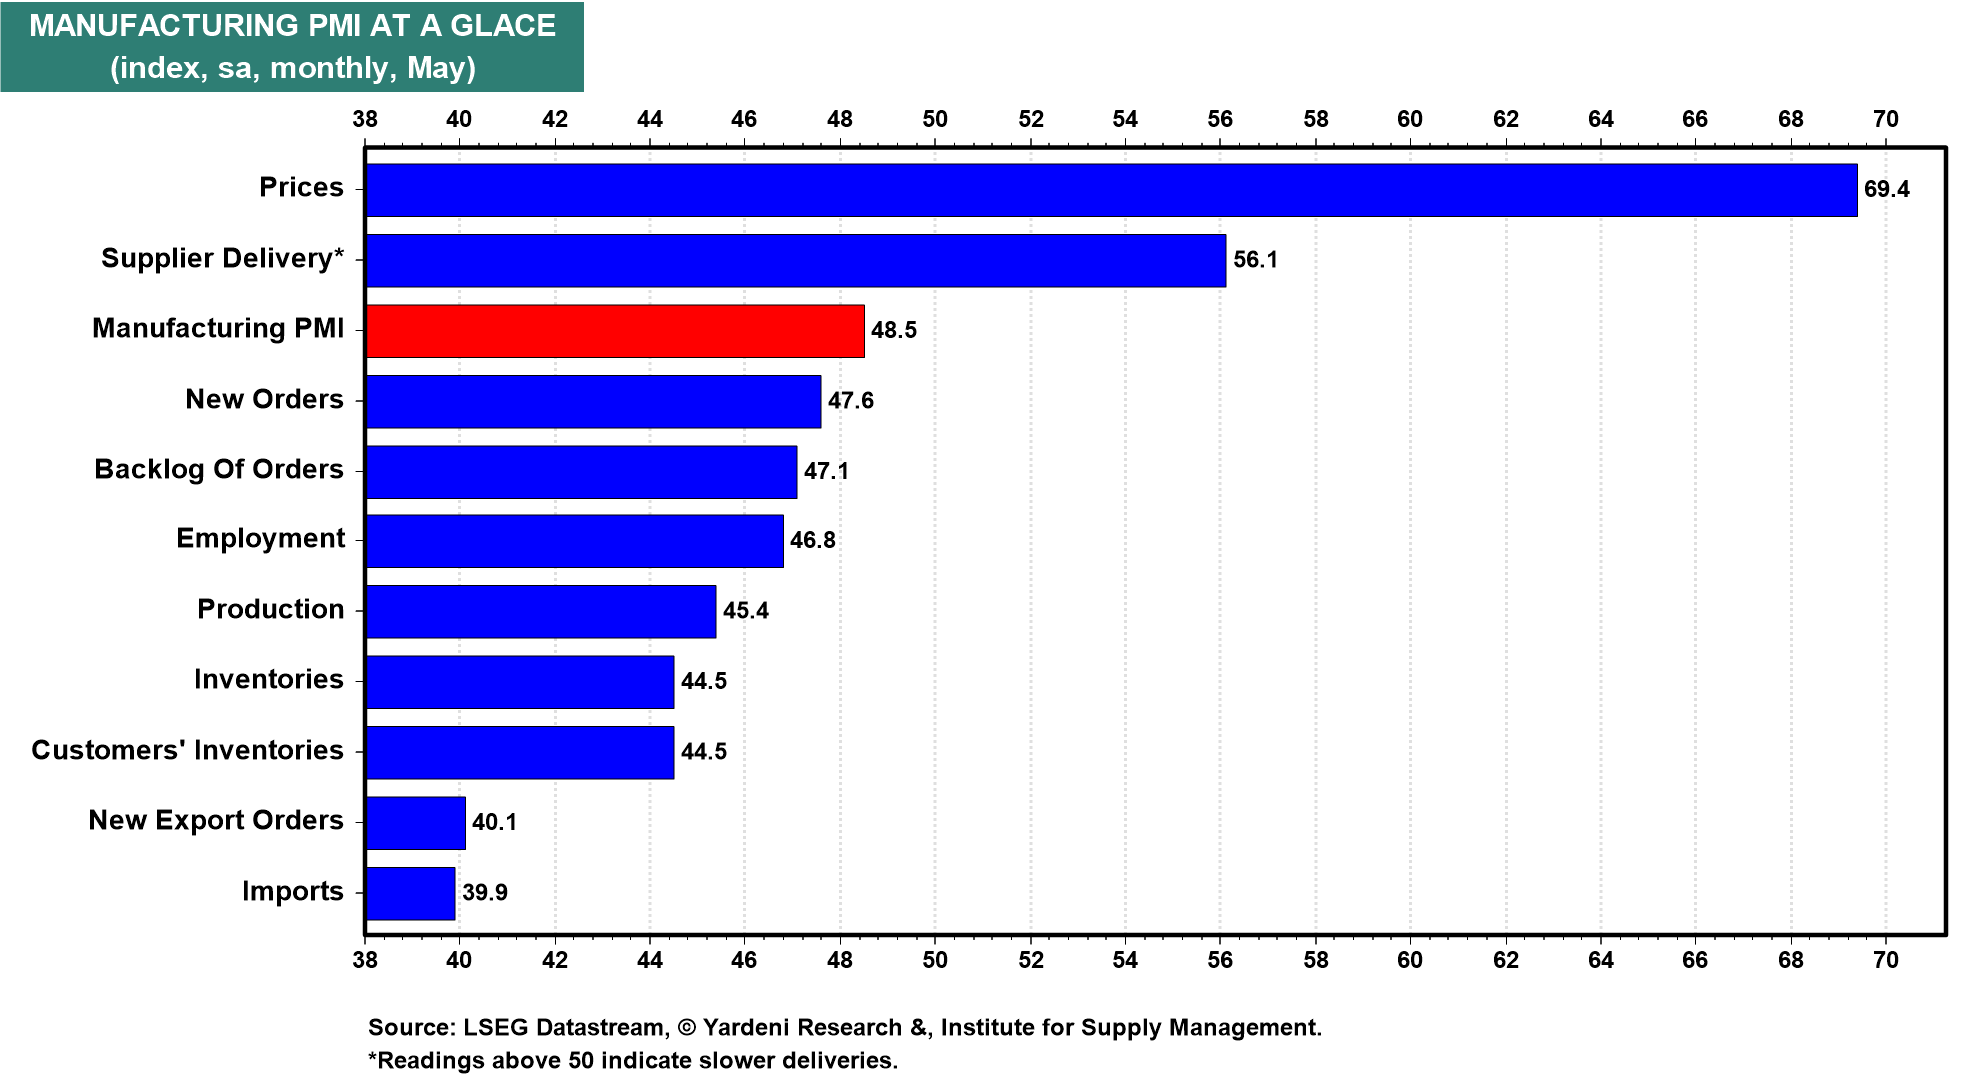
(1) Purchasing managers survey. The ISM manufacturing index (M-PMI) edged down by 0.2ppt to 48.5 in May (chart). The composition was slightly firmer, however. New orders and employment both rose slightly, while the prices index declined slightly.
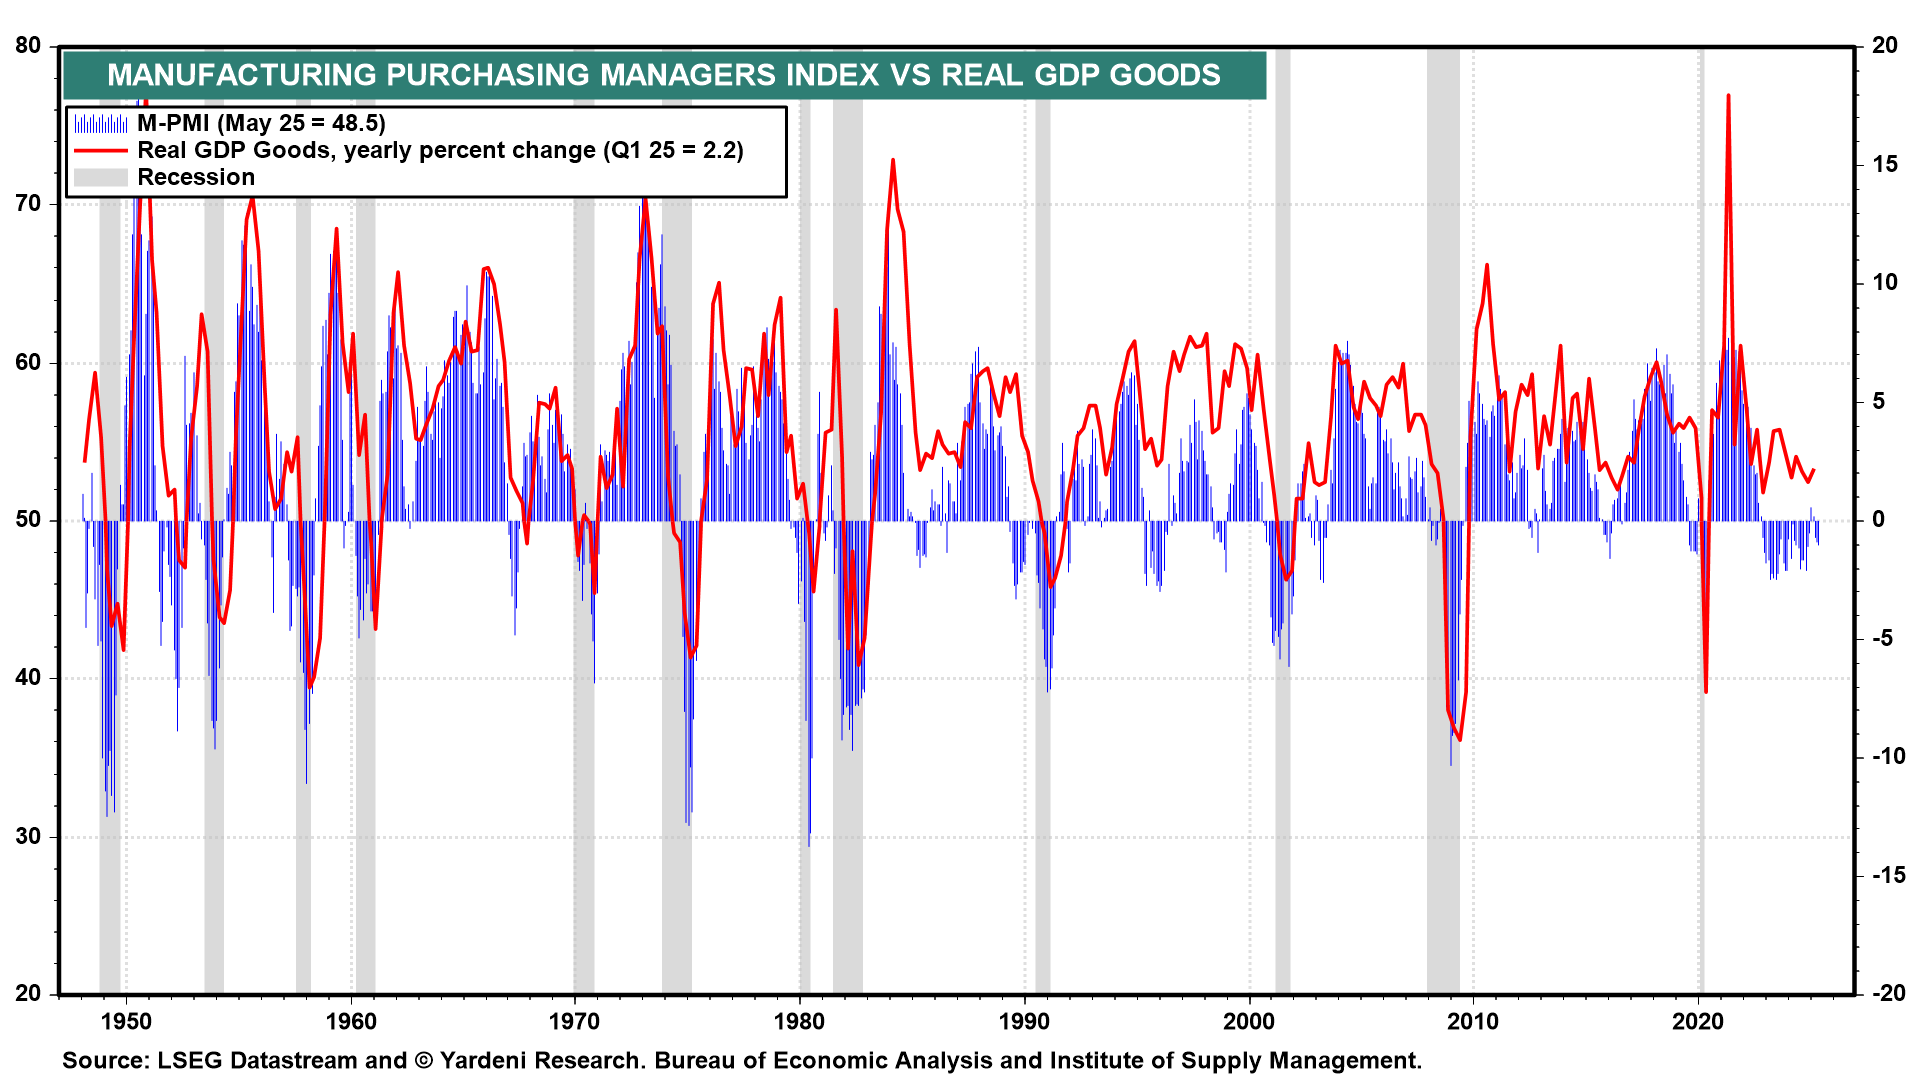
In the past, the M-PMI was a reasonably good coincident monthly indicator of the y/y growth rate in quarterly real GDP of goods (chart). Over the past couple of years, the latter has been much stronger than suggested by the M-PMI. So the M-PMI has been a misleading indicator of the goods sector. That might be attributable to the rapid growth of information technology hardware and software, which may not be properly reflected in the M-PMI. Software is included in capital spending and treated as a GDP good.
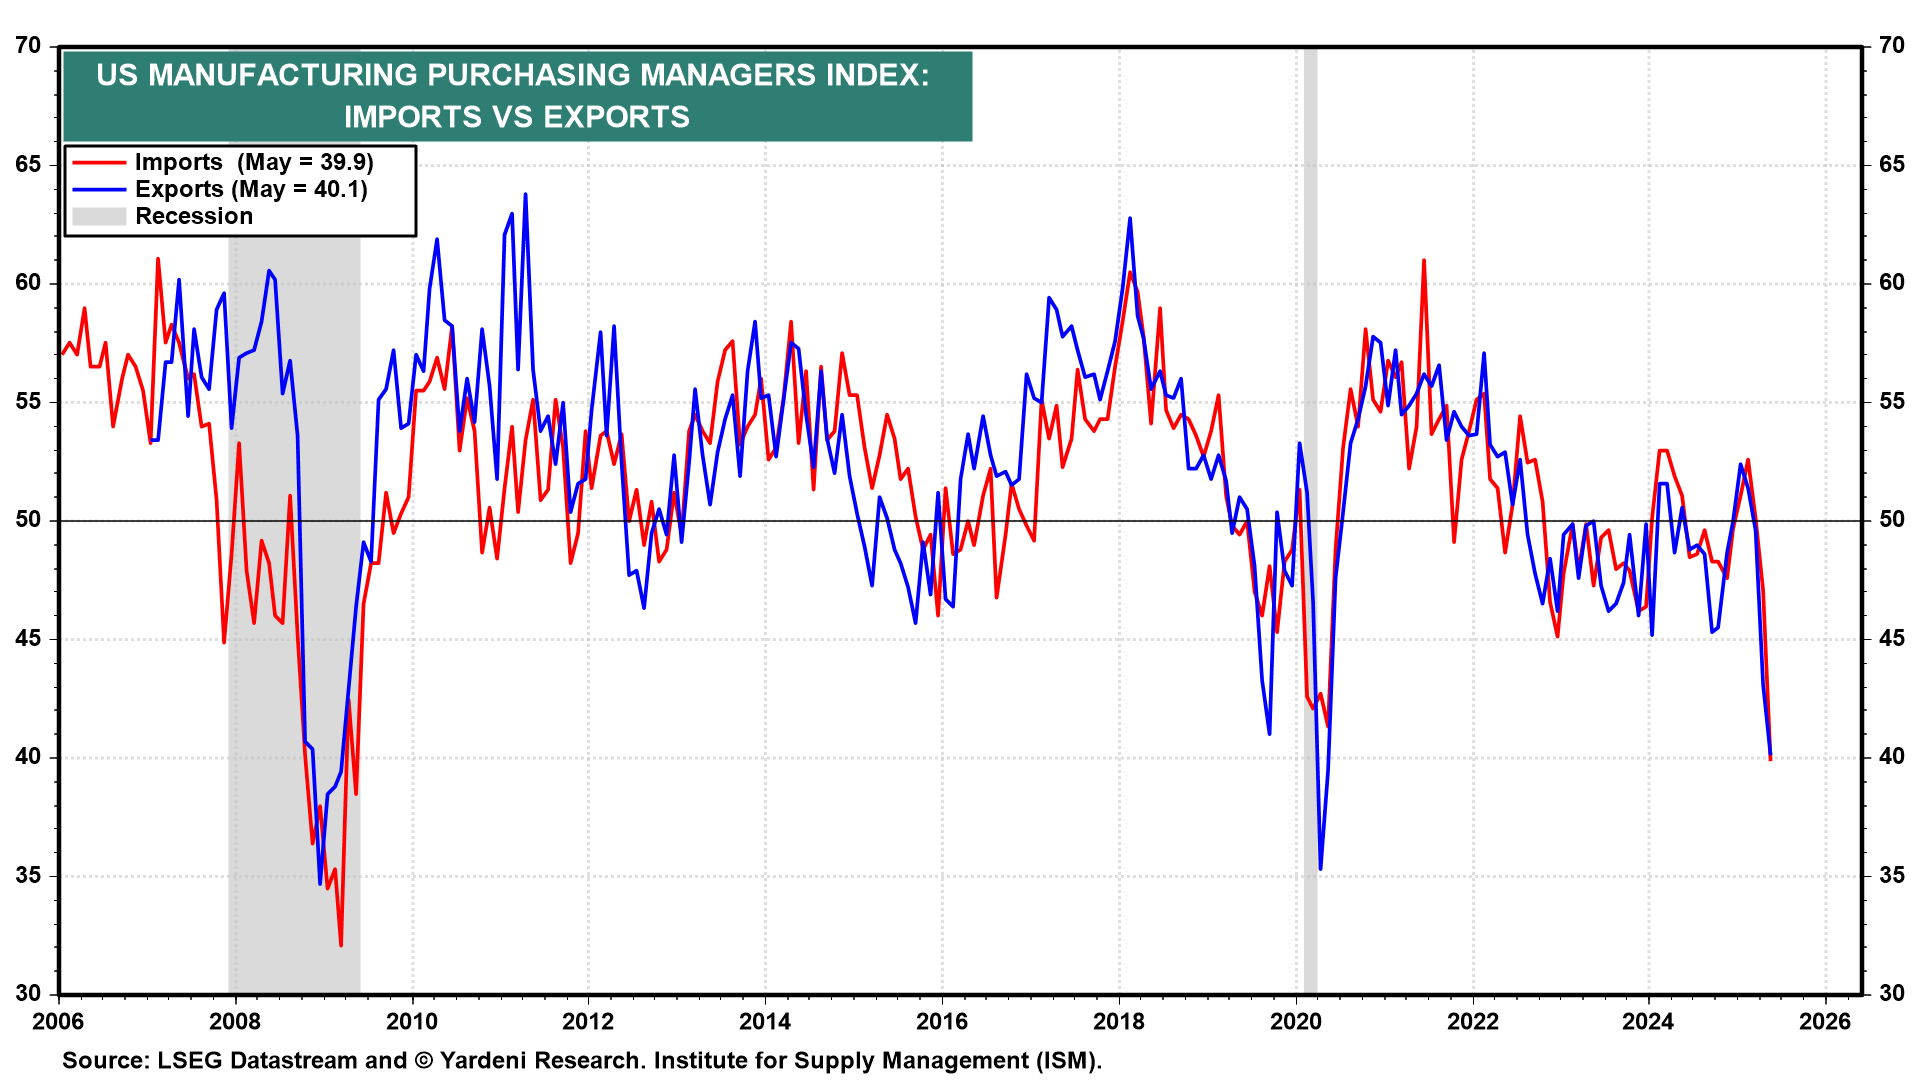
The weakest components of the M-PMI during May, not surprisingly, were new export orders and imports (chart). They clearly are reflecting the impact of Trump's Tariff Turmoil.
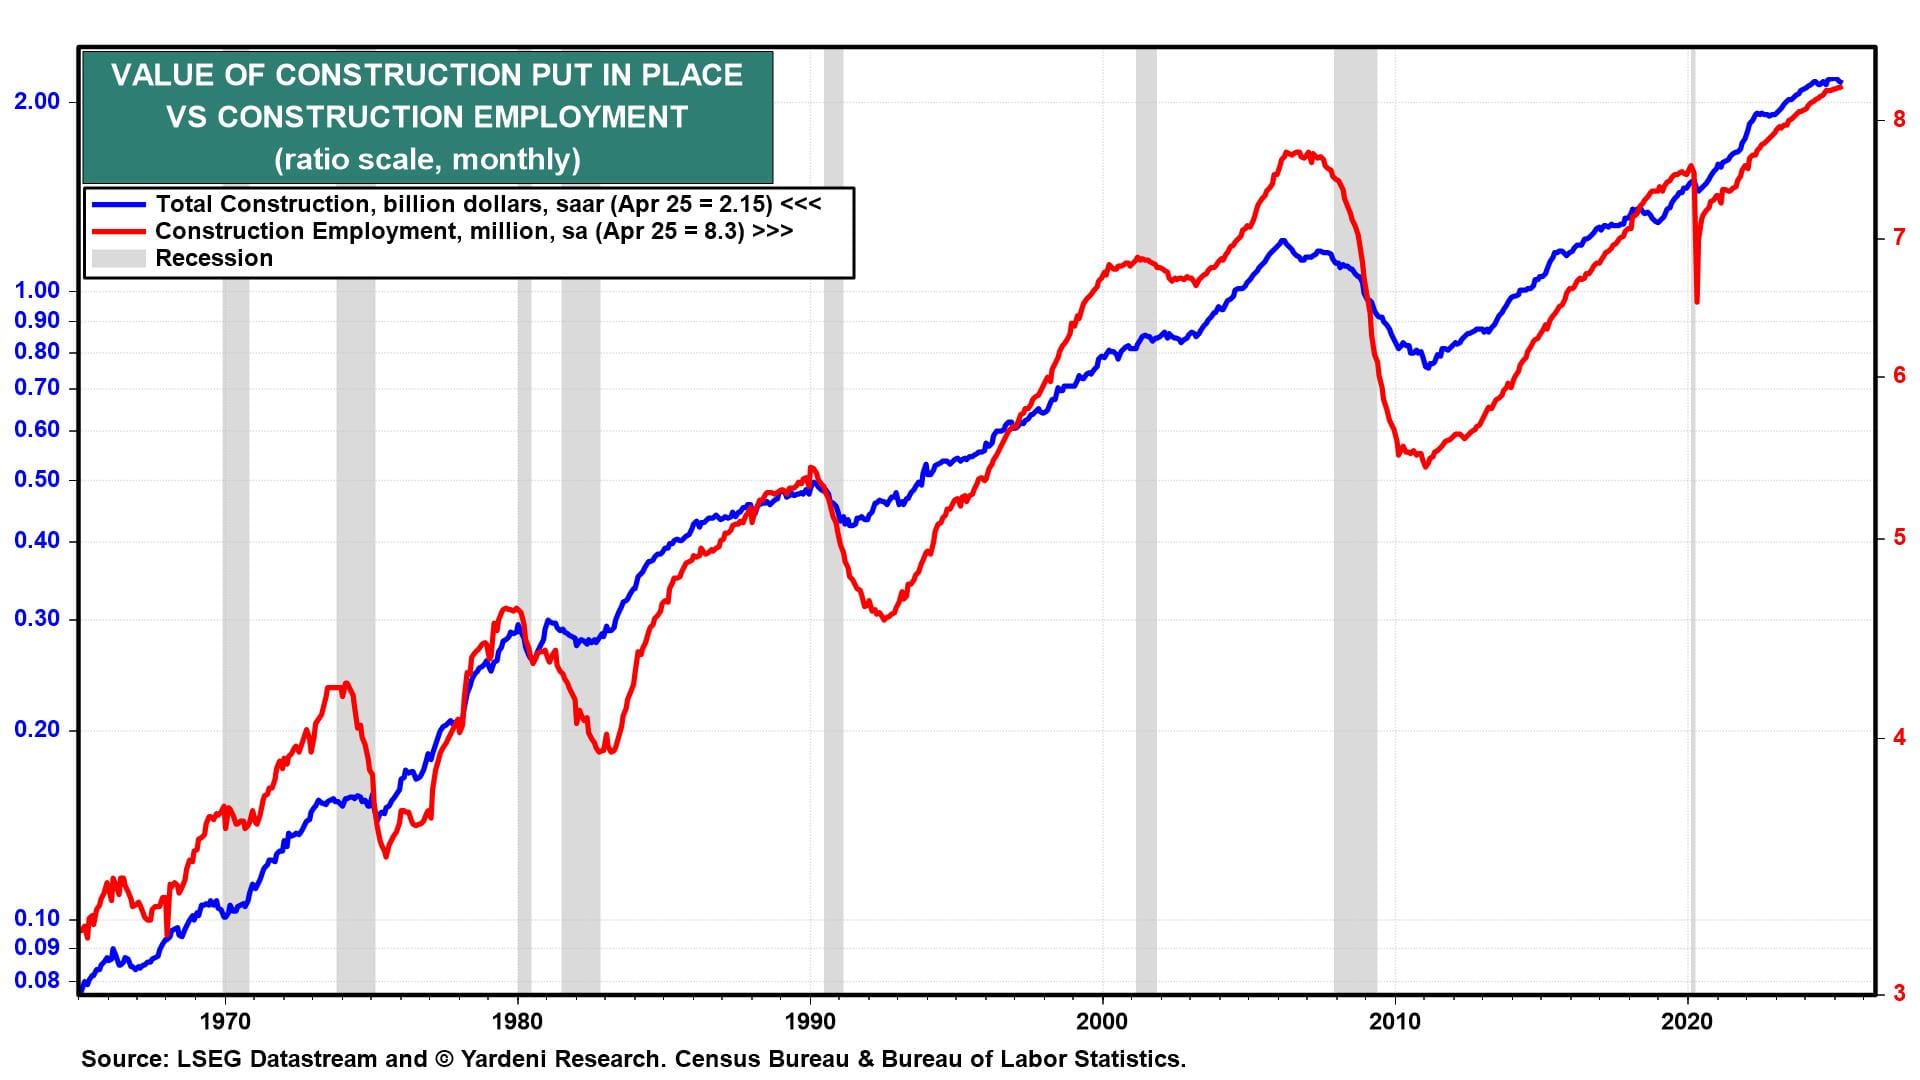
(2) Construction spending. Total construction spending declined for the third consecutive month, falling 0.4% m/m in April (chart). It seems to be stalling at its recent record high. That's actually impressive since the monetary policy tightening of the past three years didn't stop it from rising to record highs along with construction employment. It's hard to have an economy-wide recession when spending and hiring continues to rise in the most interest rate sensitive industries in our economy despite Fed tightening!
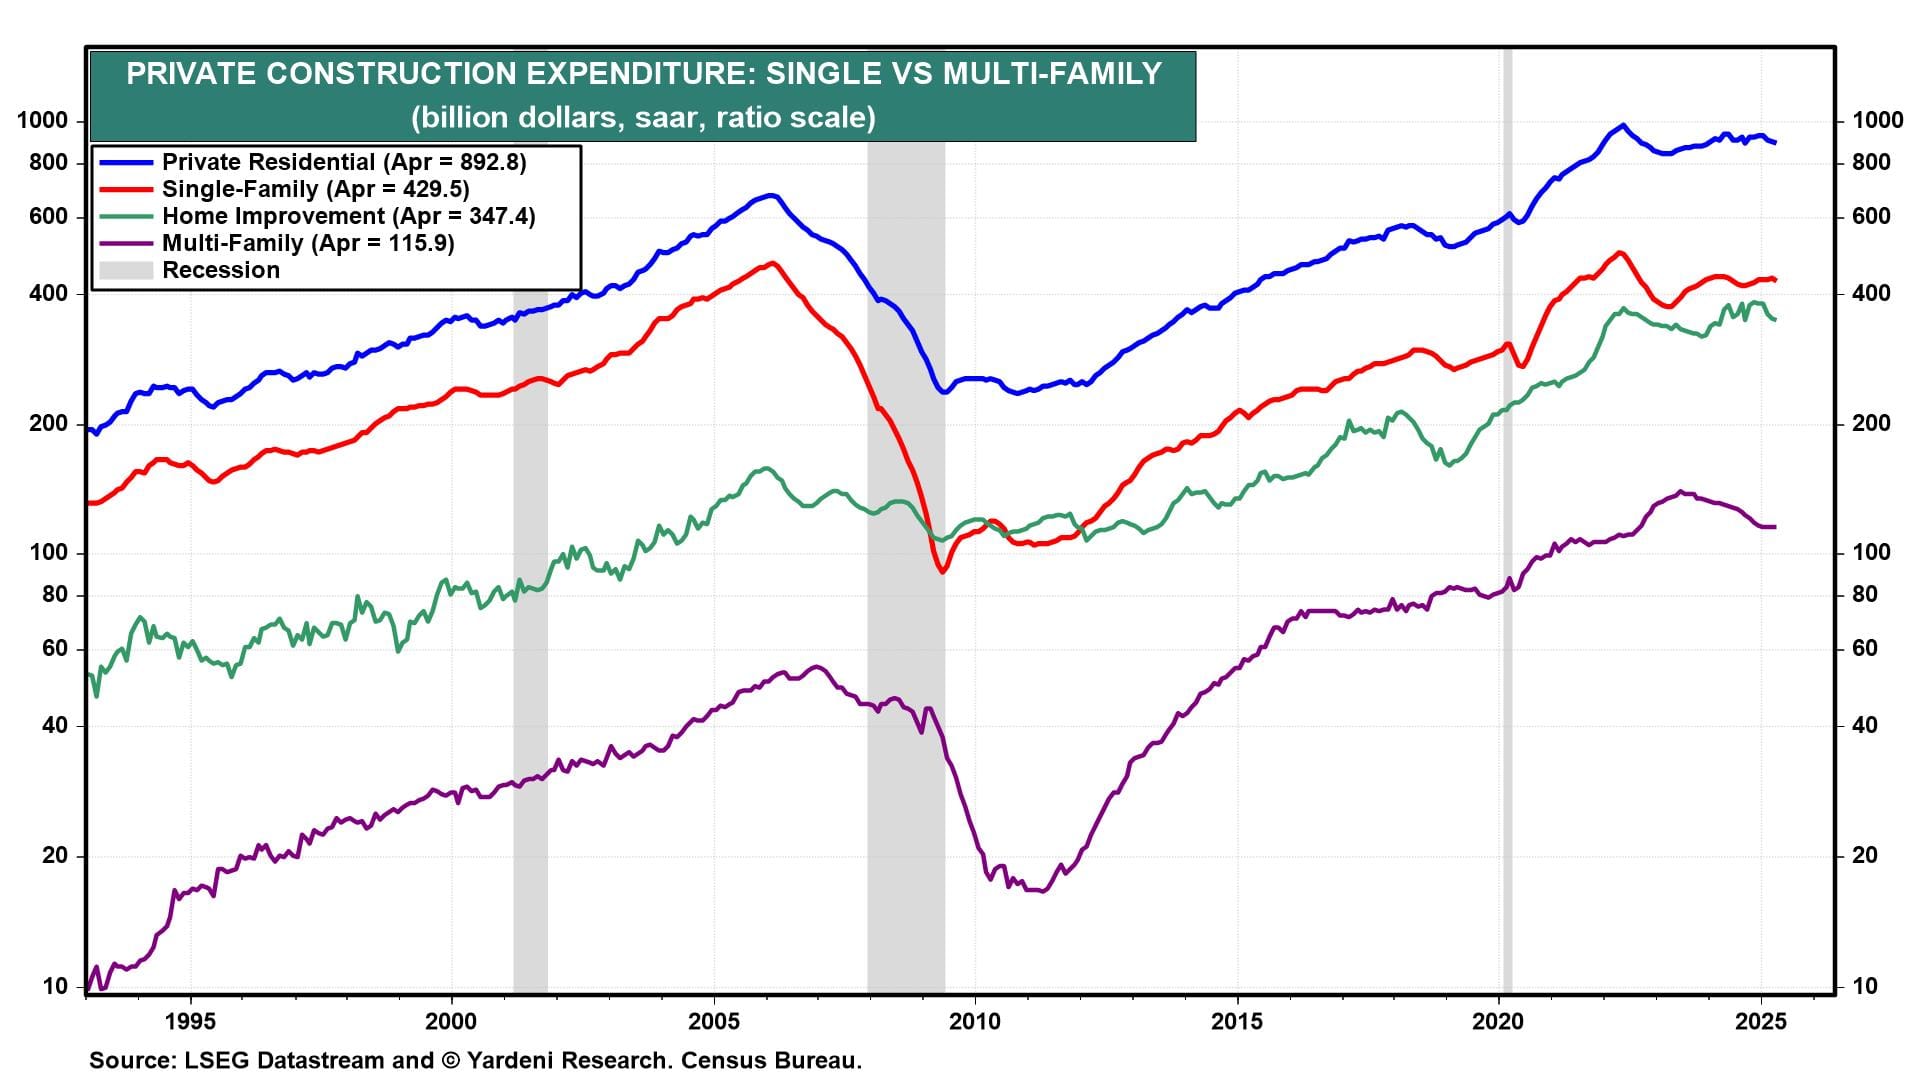
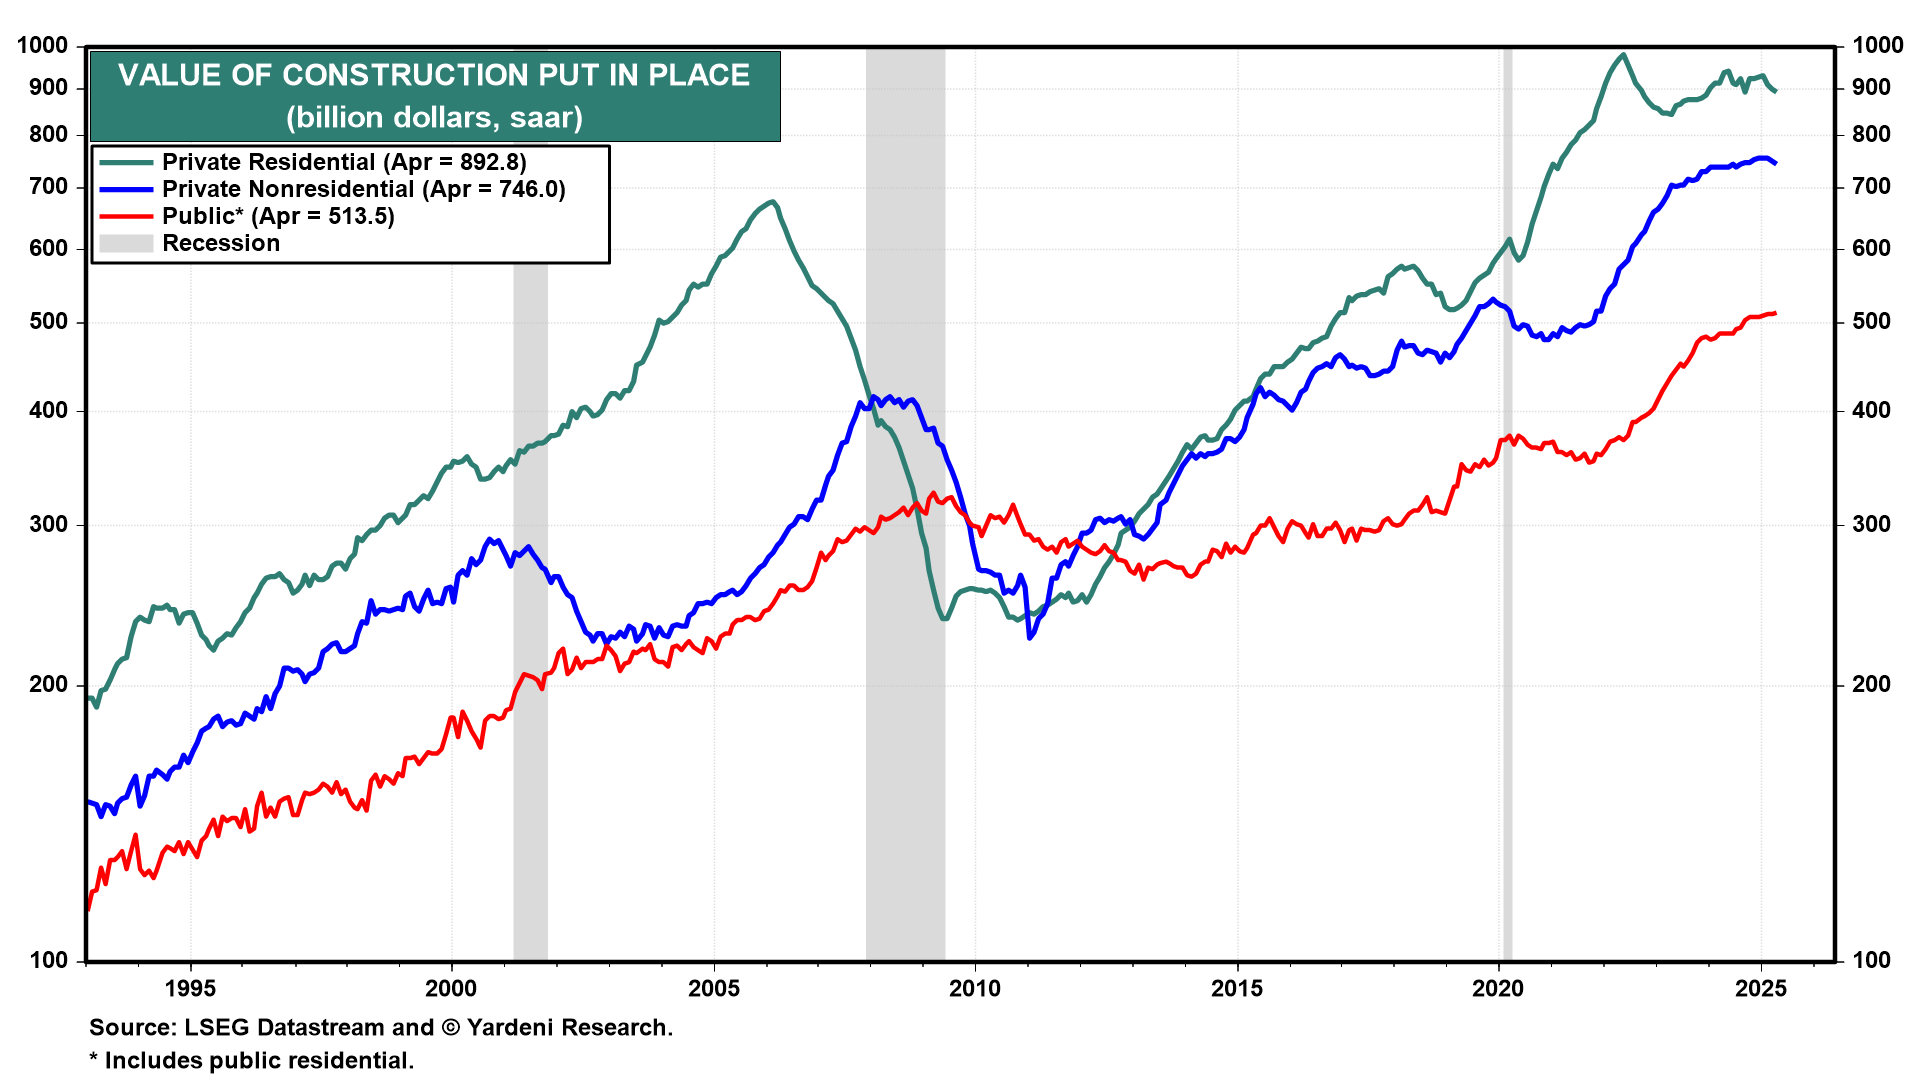
Over the past couple of years, the sluggishness in private residential construction has been offset by ongoing strength in private nonresidential construction and in public construction (chart).
Interestingly, while new home sales and existing home sales have been weighed down by rising mortgage rates, construction spending on home improvements has remained strong in record high territory over the past three and a half years (chart). This is another source of the economy's resilience. Households are moving less and spending more to renovate their homes.