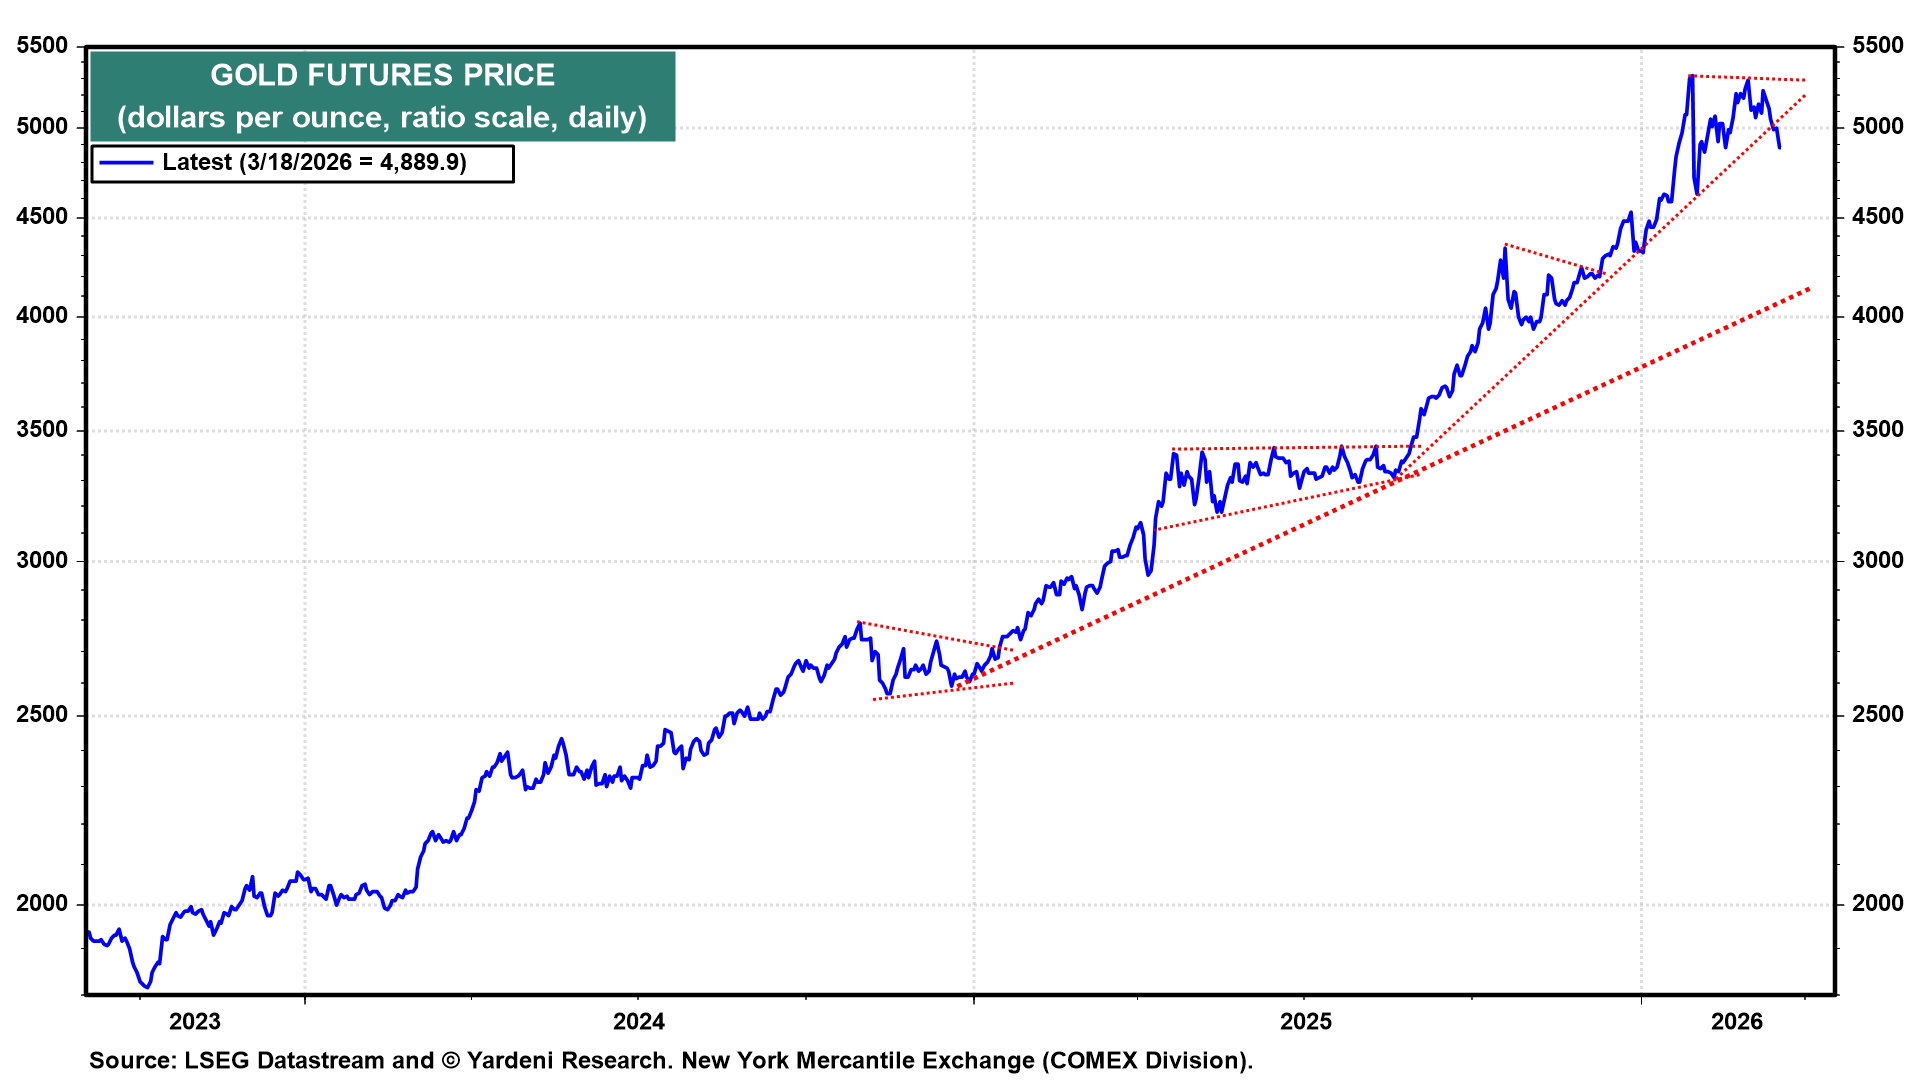
There's plenty of geopolitical risk today, along with higher global inflation and larger US federal budget deficits ahead. Yet, the price of an ounce of gold is down sharply today. It fell to an intraday low of $4508 per ounce at 9:02 am EST, down from a recent closing high of $5311 on Monday, March 2, two days after the start of the current war in the Middle East (chart). This decline coincides with the escalation of the war and mounting concerns that it might not be short.
In a press briefing at the Pentagon this morning, Secretary of Defense Pete Hegseth addressed reports that the Pentagon is seeking $200 billion in additional funding for the ongoing conflict with Iran. While he did not officially "ask Congress" for that specific amount today, he confirmed that the Pentagon is seeking supplemental funds and that the $200 billion figure is a potential target. He said, "It takes money to kill bad guys." He emphasized that the funds are needed to replenish munition stockpiles and support "Operation Epic Fury."
What gives? The always-reliable quick answer is: profit-taking following a meteoric rise. Perhaps investors in the Middle East are selling gold to buy the US dollar, which has strengthened during the war, even though both are considered safe havens. Rising bond yields might also explain gold's recent meltdown. The probability of further Fed rate cuts is falling as inflation heats up.
Technically speaking, gold's price dropped below a short-term uptrend line this week (chart). The next uptrend support line could be tested closer to $4000.
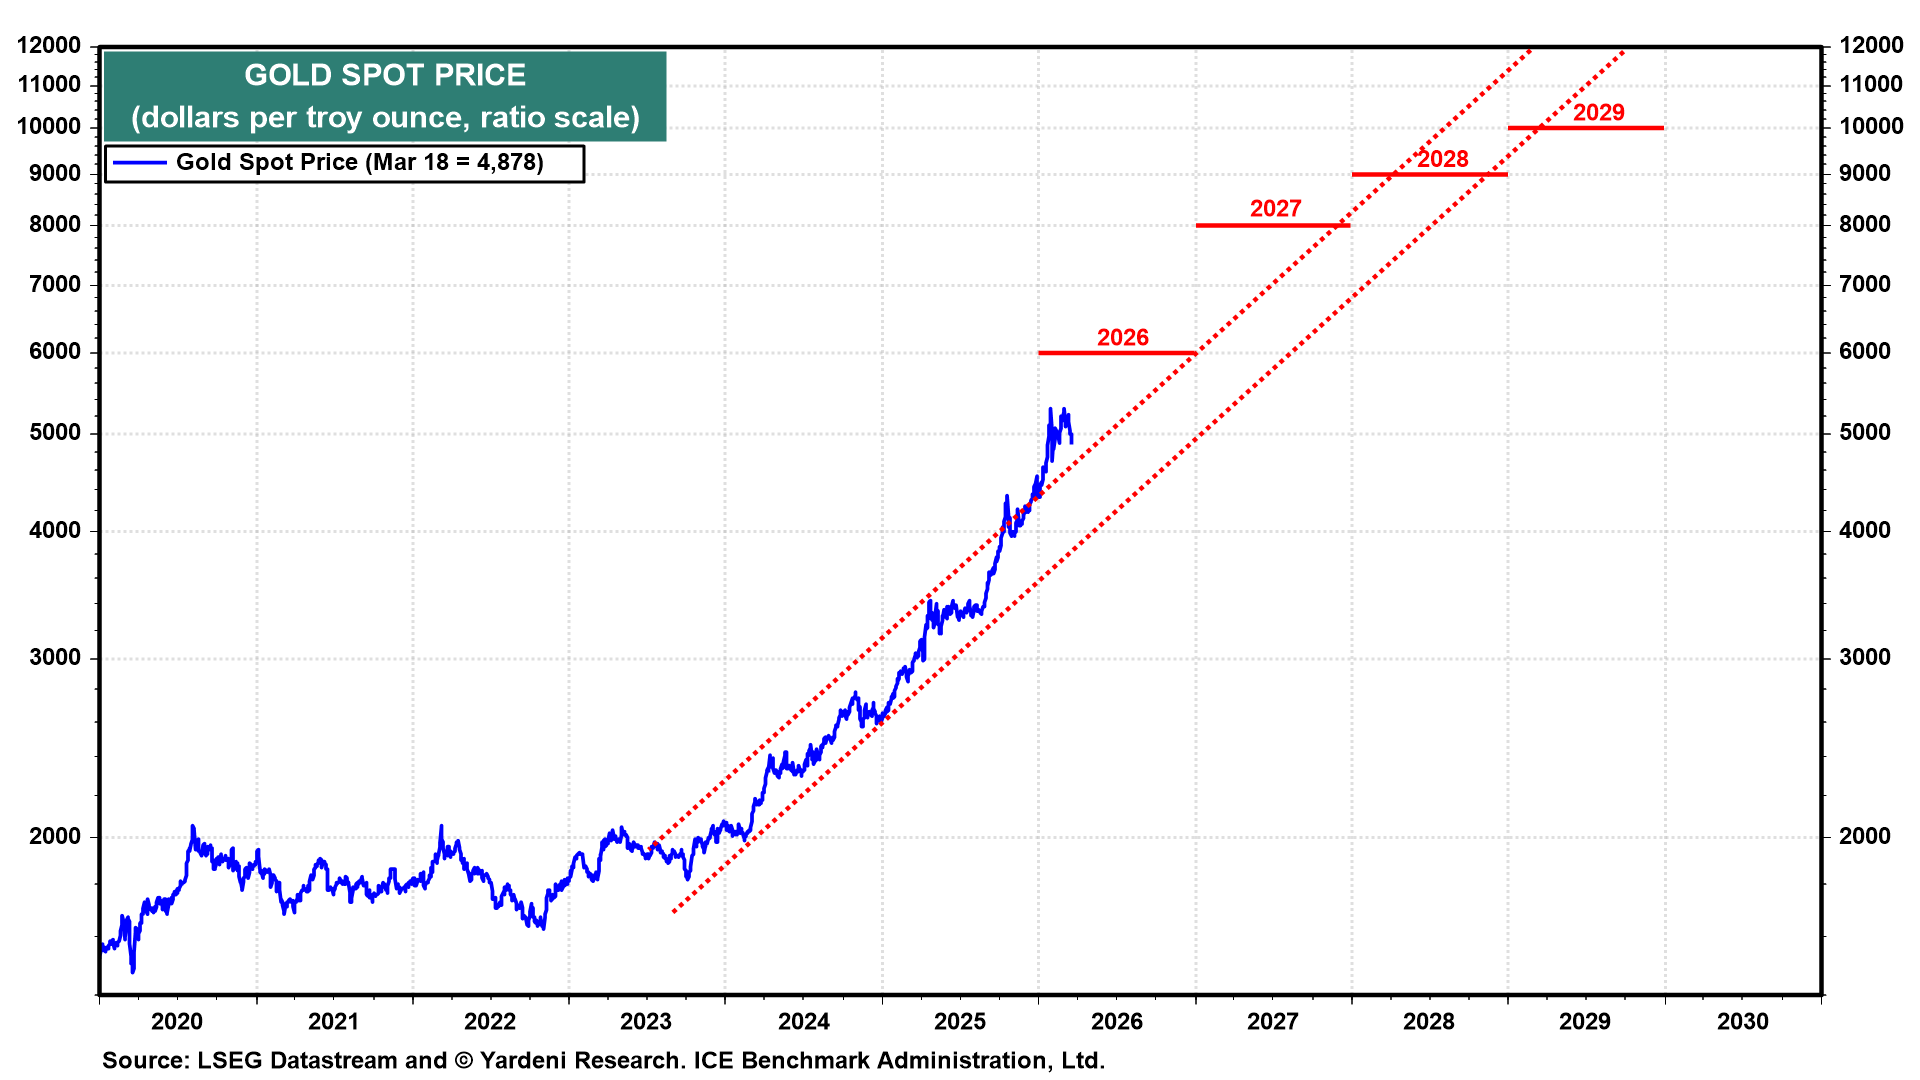
Another technical explanation is that the gold price rose too far, too fast since early last year, jumping above its ascending channel this year (chart). We are still targeting gold at $6,000 by the end of this year and $10,000 by the end of 2029. However, we are considering lowering our year-end target back to $5,000 if gold continues to defy our expectations that it should be rising on unsettling geopolitical developments, rising inflation, and mounting US government debt.
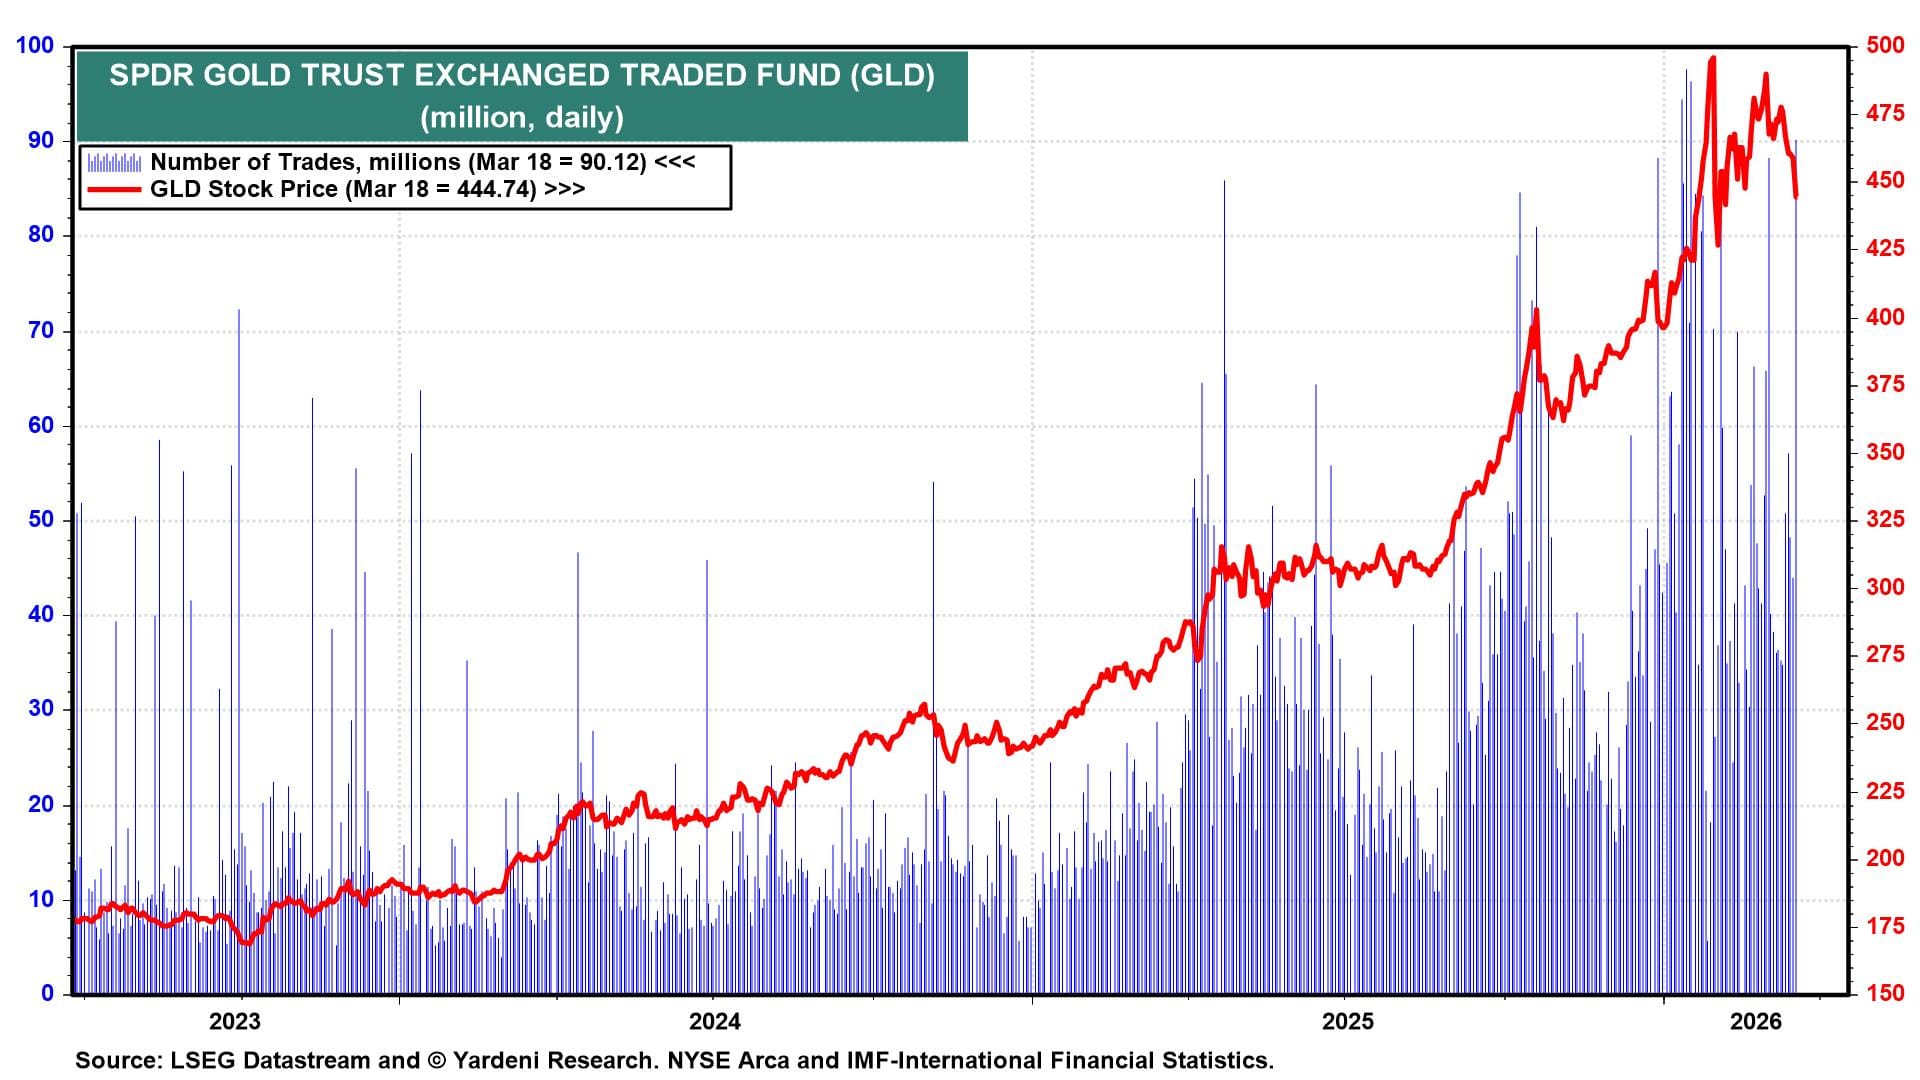
From a sentiment perspective, the recent drop in GLD's stock price on high volume suggests panic selling. From a contrarian perspective, that could soon make a bottom in the recent selloff (chart).
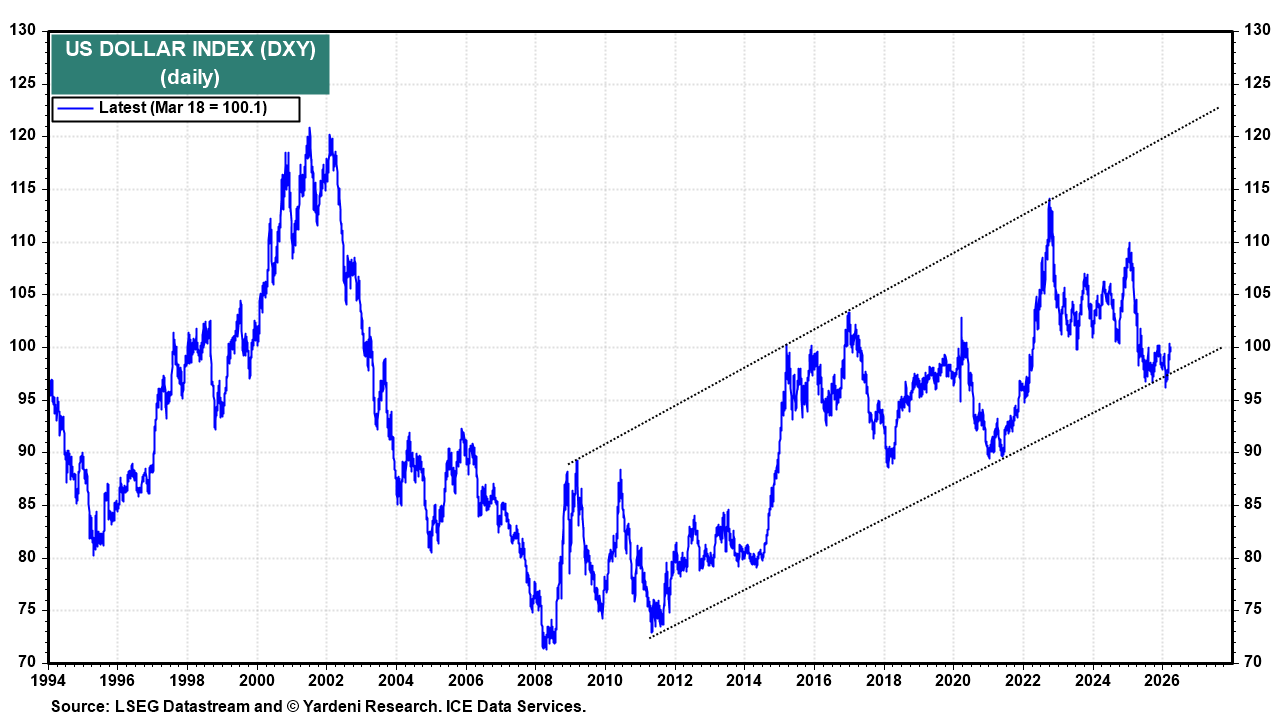
The recent strength of the dollar might explain some of the weakness in the gold price (chart). However, the US dollar index (DXY) has mostly moved sideways over the past year.
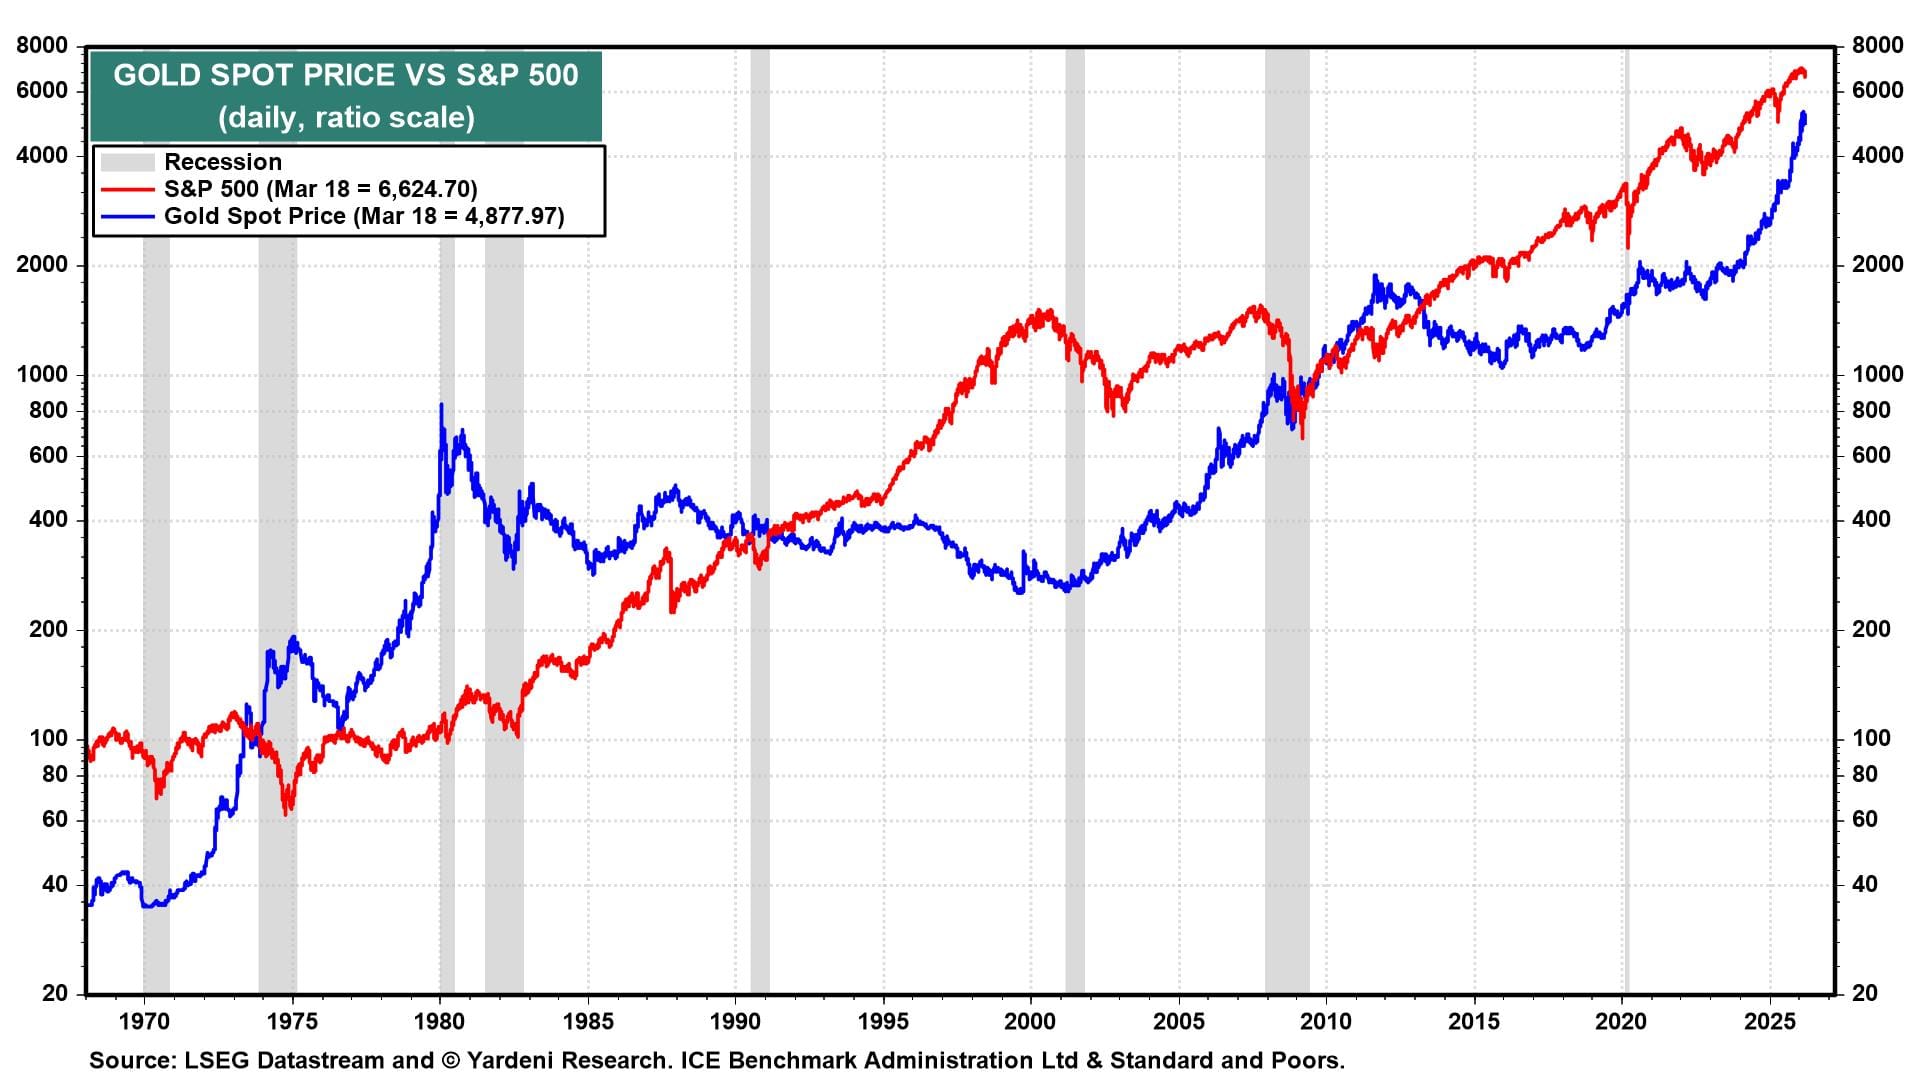
Our upbeat story for gold is premised on our Roaring 2020s scenario, driving the S&P 500 to 10,000 by the end of the decade. Along the way, stock investors should rebalance into other assets, including gold (chart). In addition, we expect that central banks will continue to buy gold and so will Chinese investors, who have been hard hit by the bursting of China's property bubble and whipsawed by the Chinese stock market.
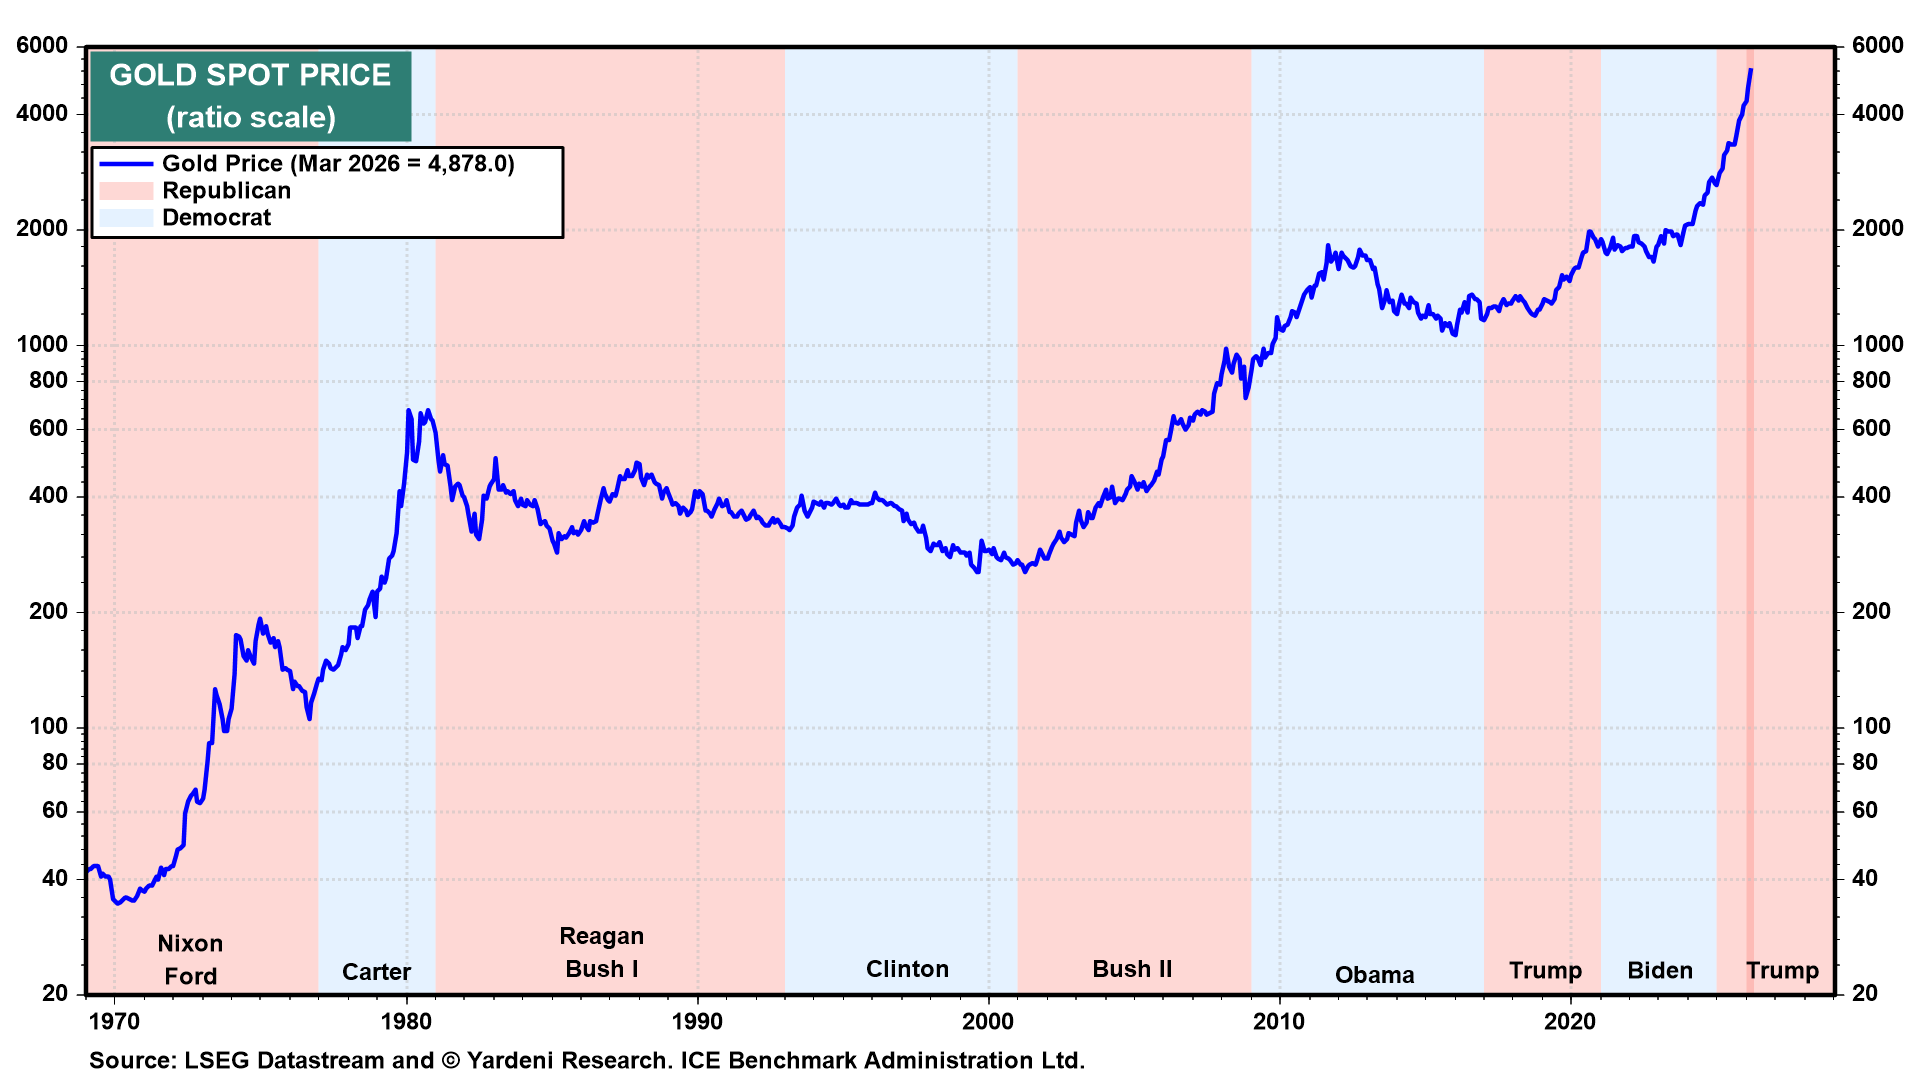
The recent ascent of gold is similar to the move that occurred when Jimmy Carter was president (chart). The price peaked when President Ronald Reagan was elected. President Donald Trump has been bullish for gold, and he has another three years in the White House.
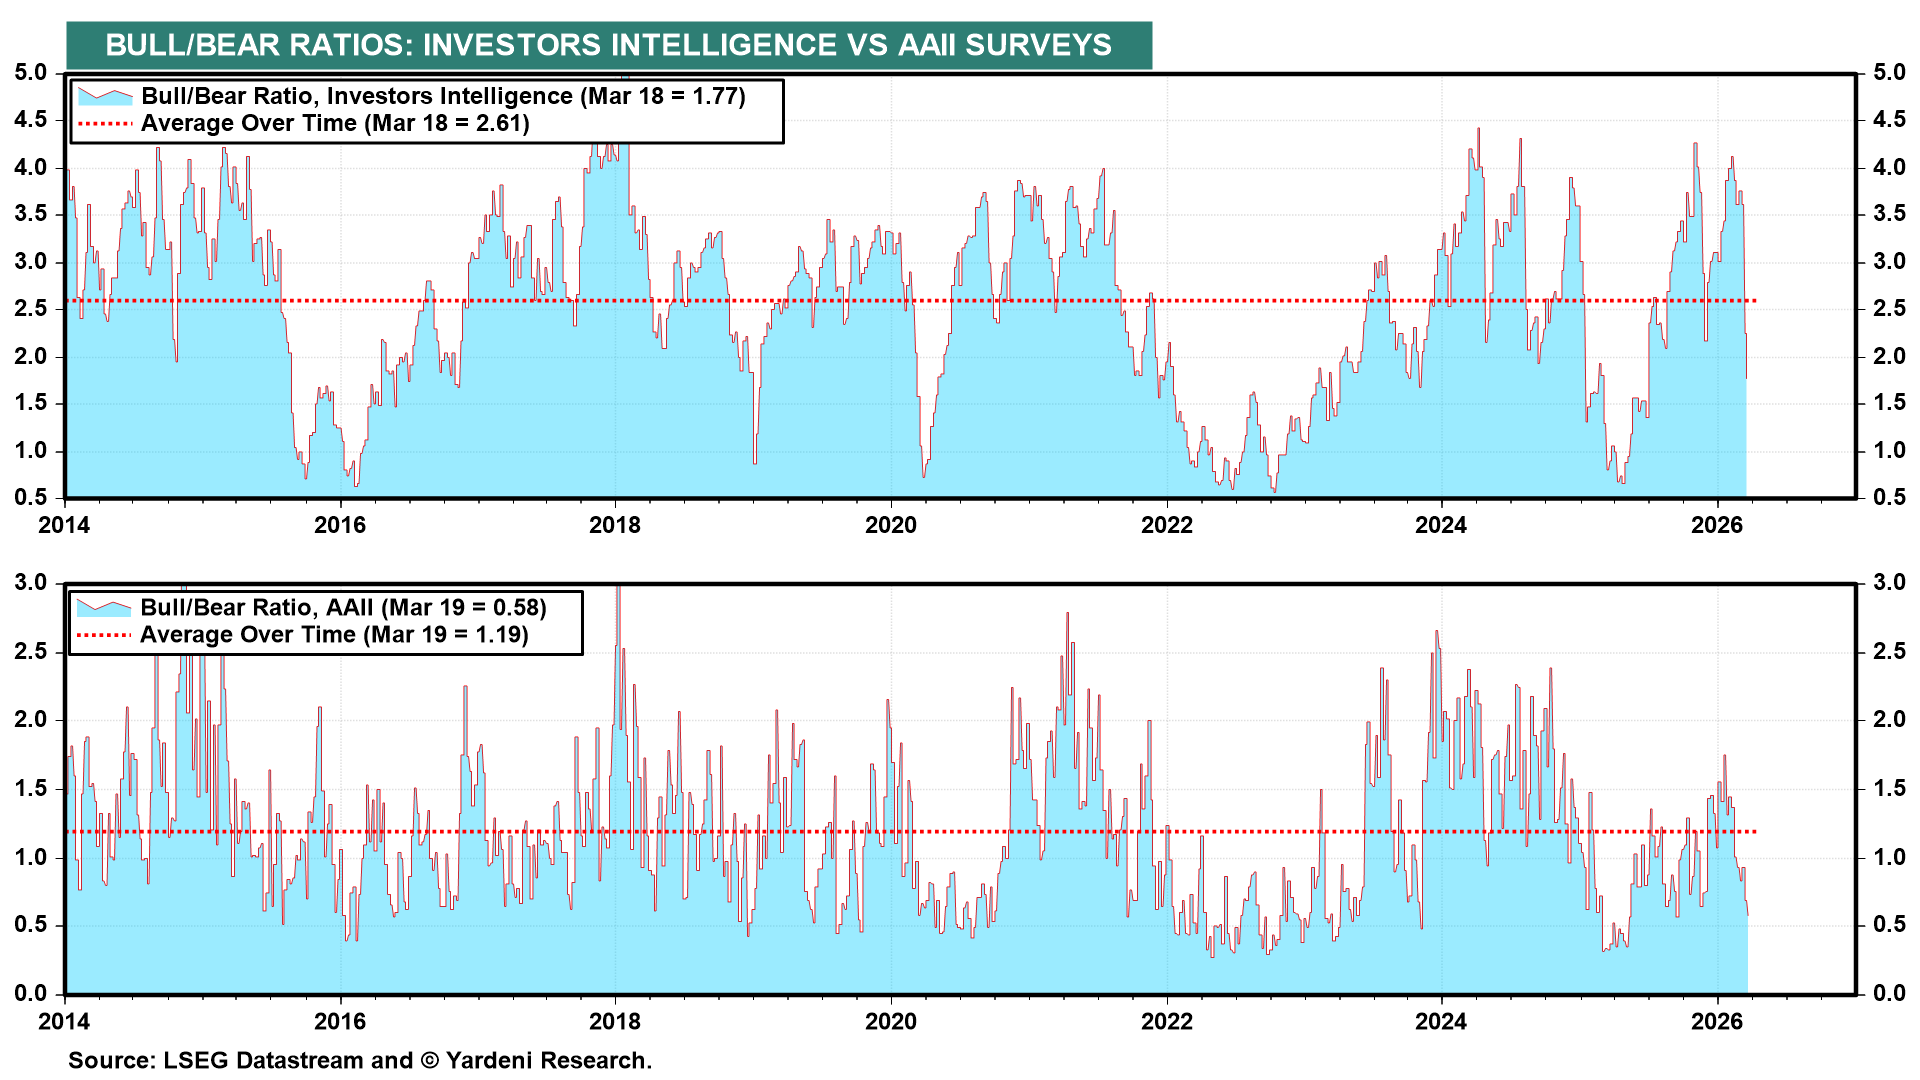
Of course, another explanation for gold's weakness is that investors are taking profits to offset recent losses in the stock markets of South Korea and Japan. There have also been losses in some areas of the US stock market. The good news from a contrarian perspective is that stock market bearishness is mounting, as evidenced in the US by the two Bull/Bear Ratios we monitor (chart).
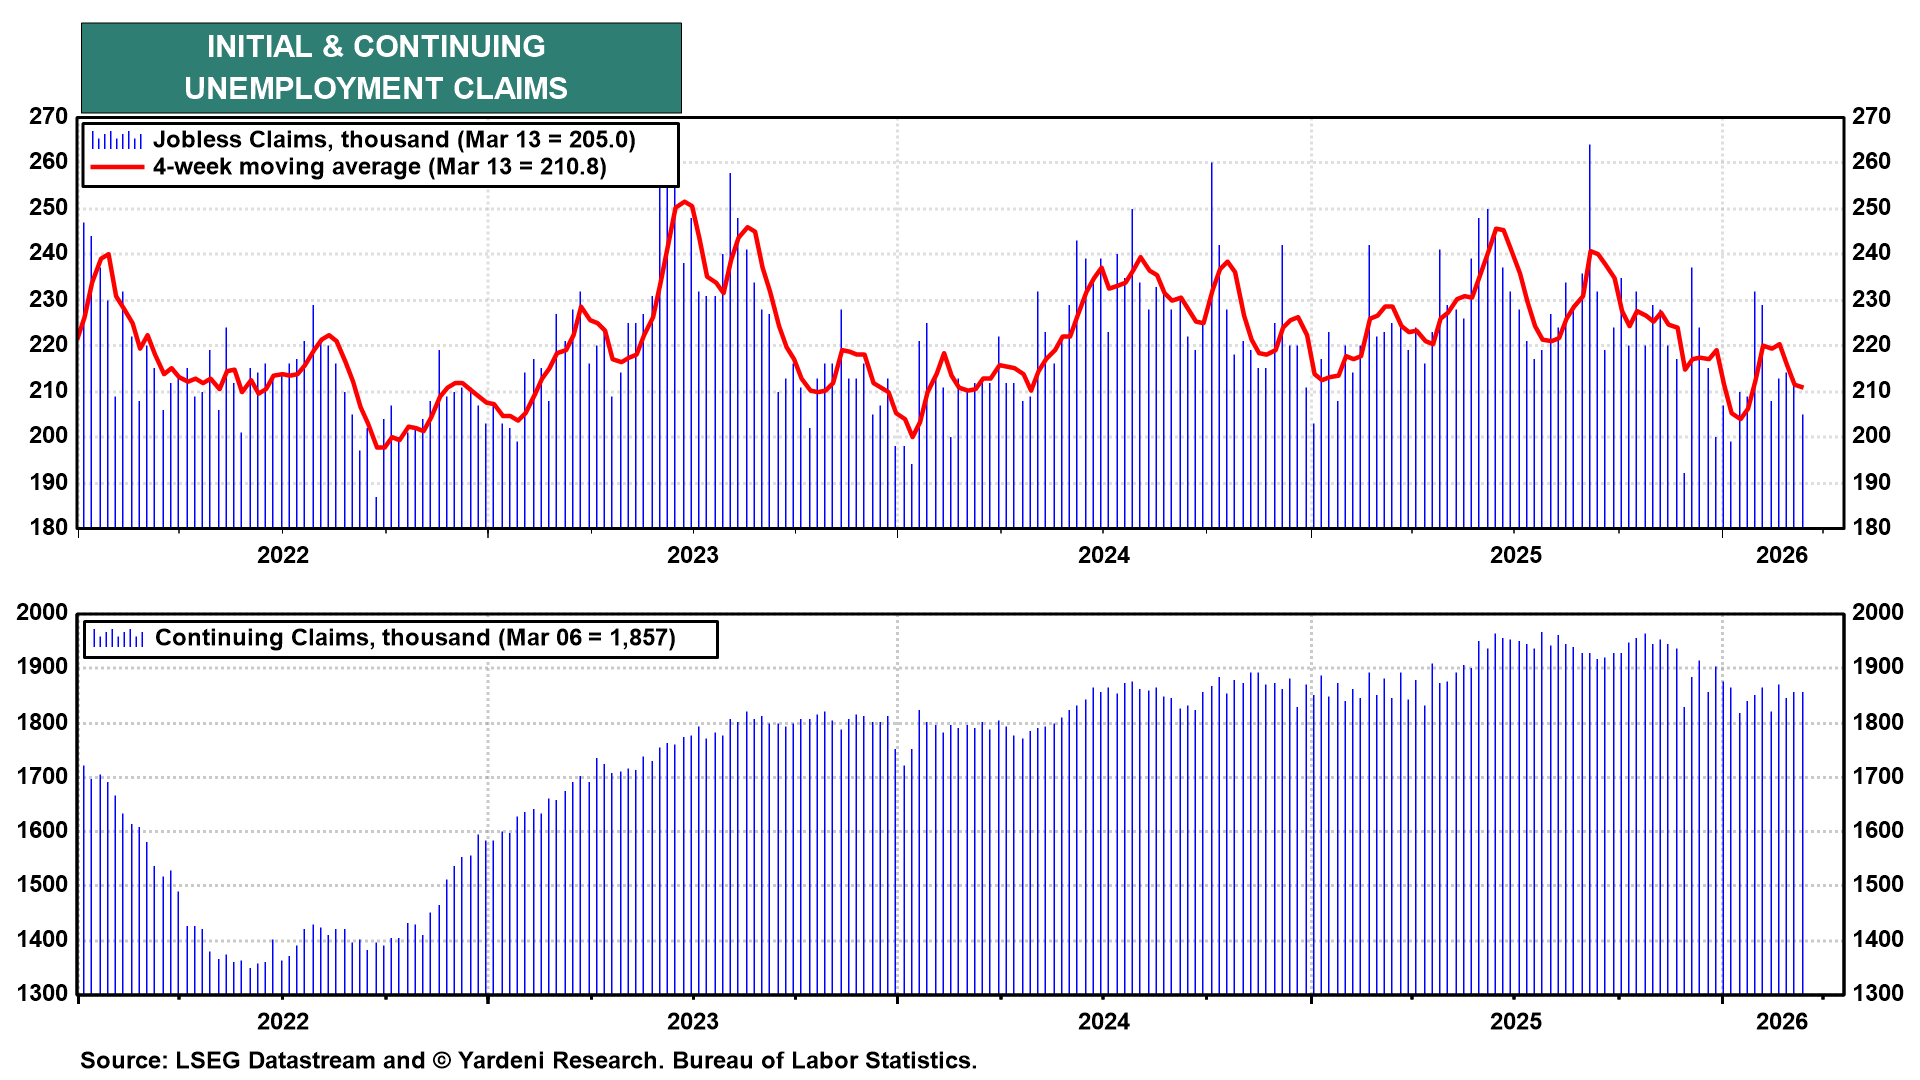
Meanwhile, initial unemployment claims fell sharply during the week of March 13 (chart). Layoffs are low and declining.
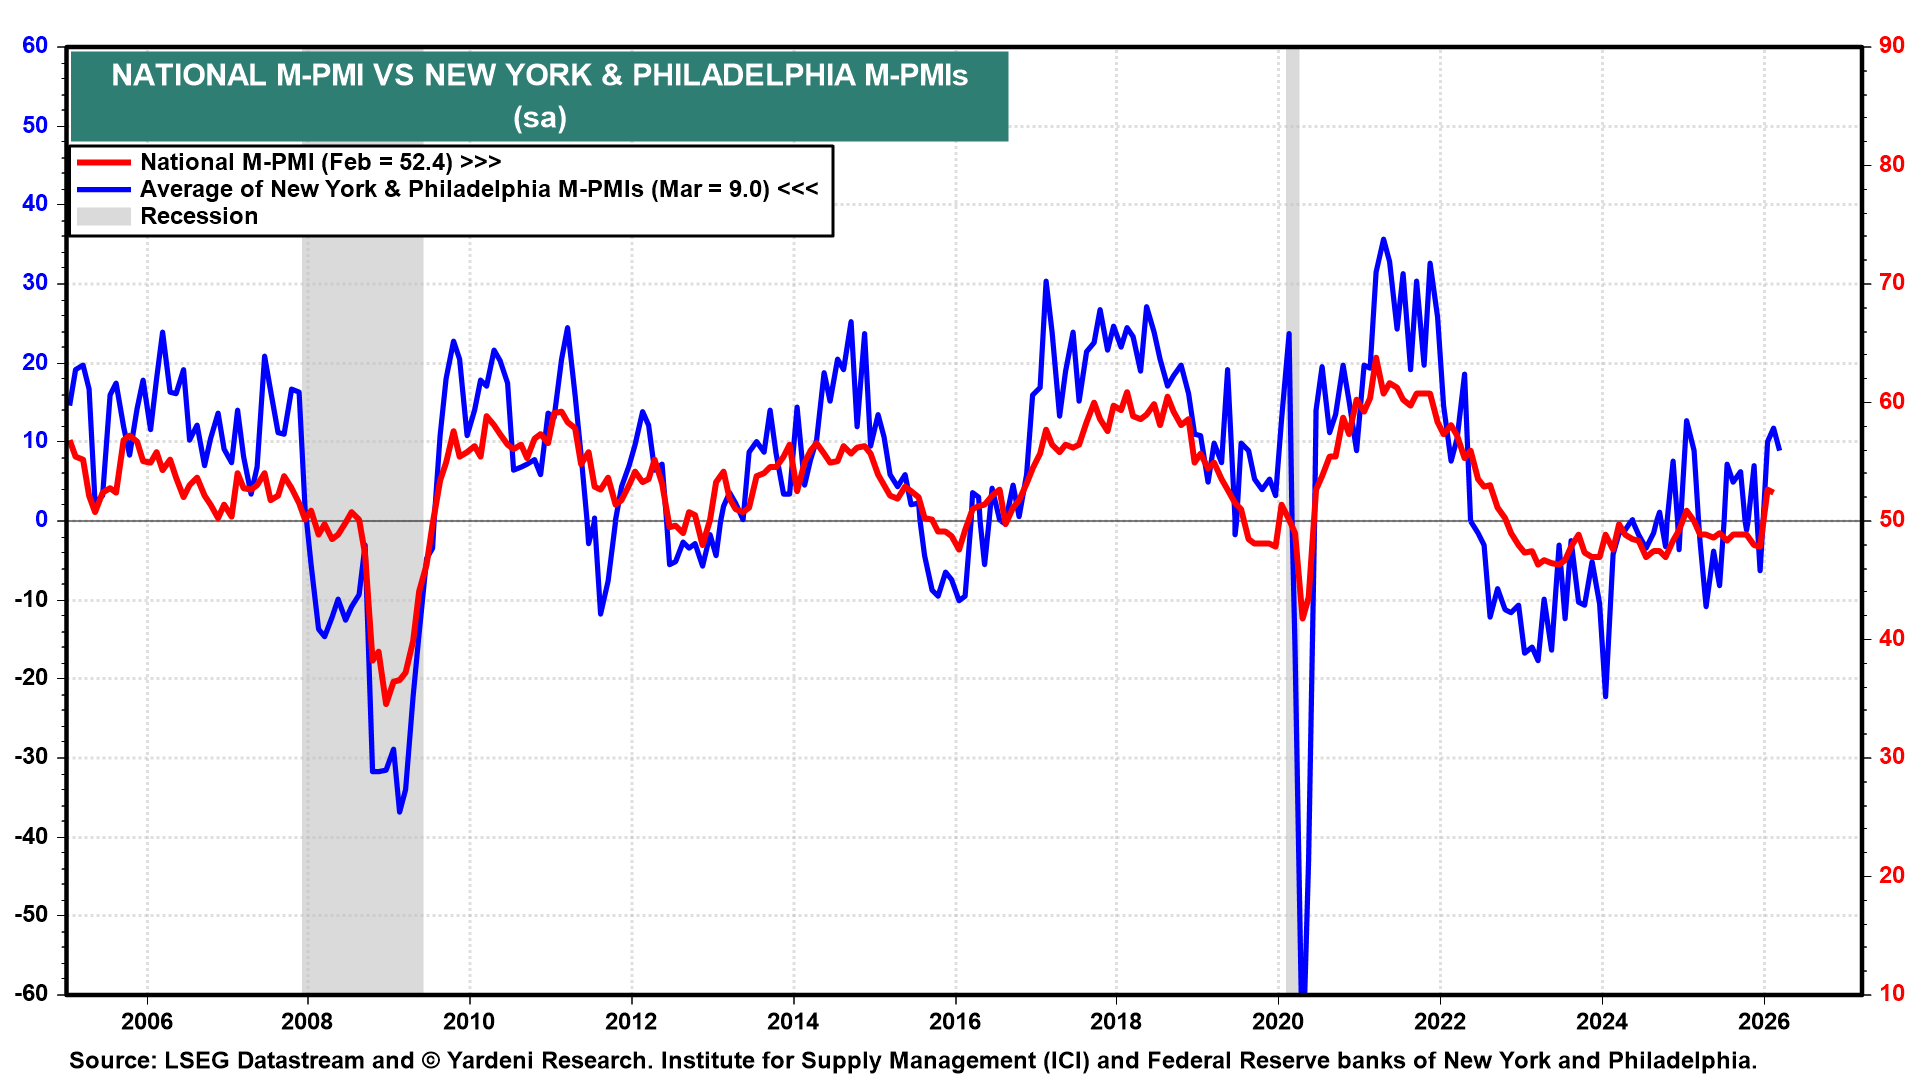
The average of the New York and Philadelphia Fed business survey indexes suggests that manufacturing continued to improve during March (chart).