I. Bessent Put For Bonds
Over the past few weeks, Treasury Secretary Scott Bessent took three actions to deter the Bond Vigilantes by showing them the Treasury's ample toolbox for stabilizing bond yields.
First, the Treasury joined Japan in supporting the yen, reducing the risk that Tokyo would need to sell Treasuries to defend its currency. Second, it announced that it was doubling buybacks of 10- to 30-year securities to $4 billion per operation. Third, the Treasury signaled it could draw down its nearly $1 trillion Treasury General Account (TGA) to help finance the additional long-bond purchases. Of course, the TGA would need to be replenished with additional T-bill issuance. Bessent is counting on growing demand from dollar-pegged stablecoins to help absorb that supply, as stablecoin issuers increasingly hold T-bill reserves as required by law. Of course, the Fed might also have to buy some of those bills to offset any upward pressure on the pegged federal funds rate.
Taken together, these moves amount to a Bessent Twist: supporting the long end of the yield curve by relying more heavily on short-term financing in the T-bill market. They also amount to a Bessent Put for the bond market. Bessent is signaling that policymakers have options should long-term yields rise beyond levels justified by economic fundamentals.
II. Bond Yields Are Alright Here
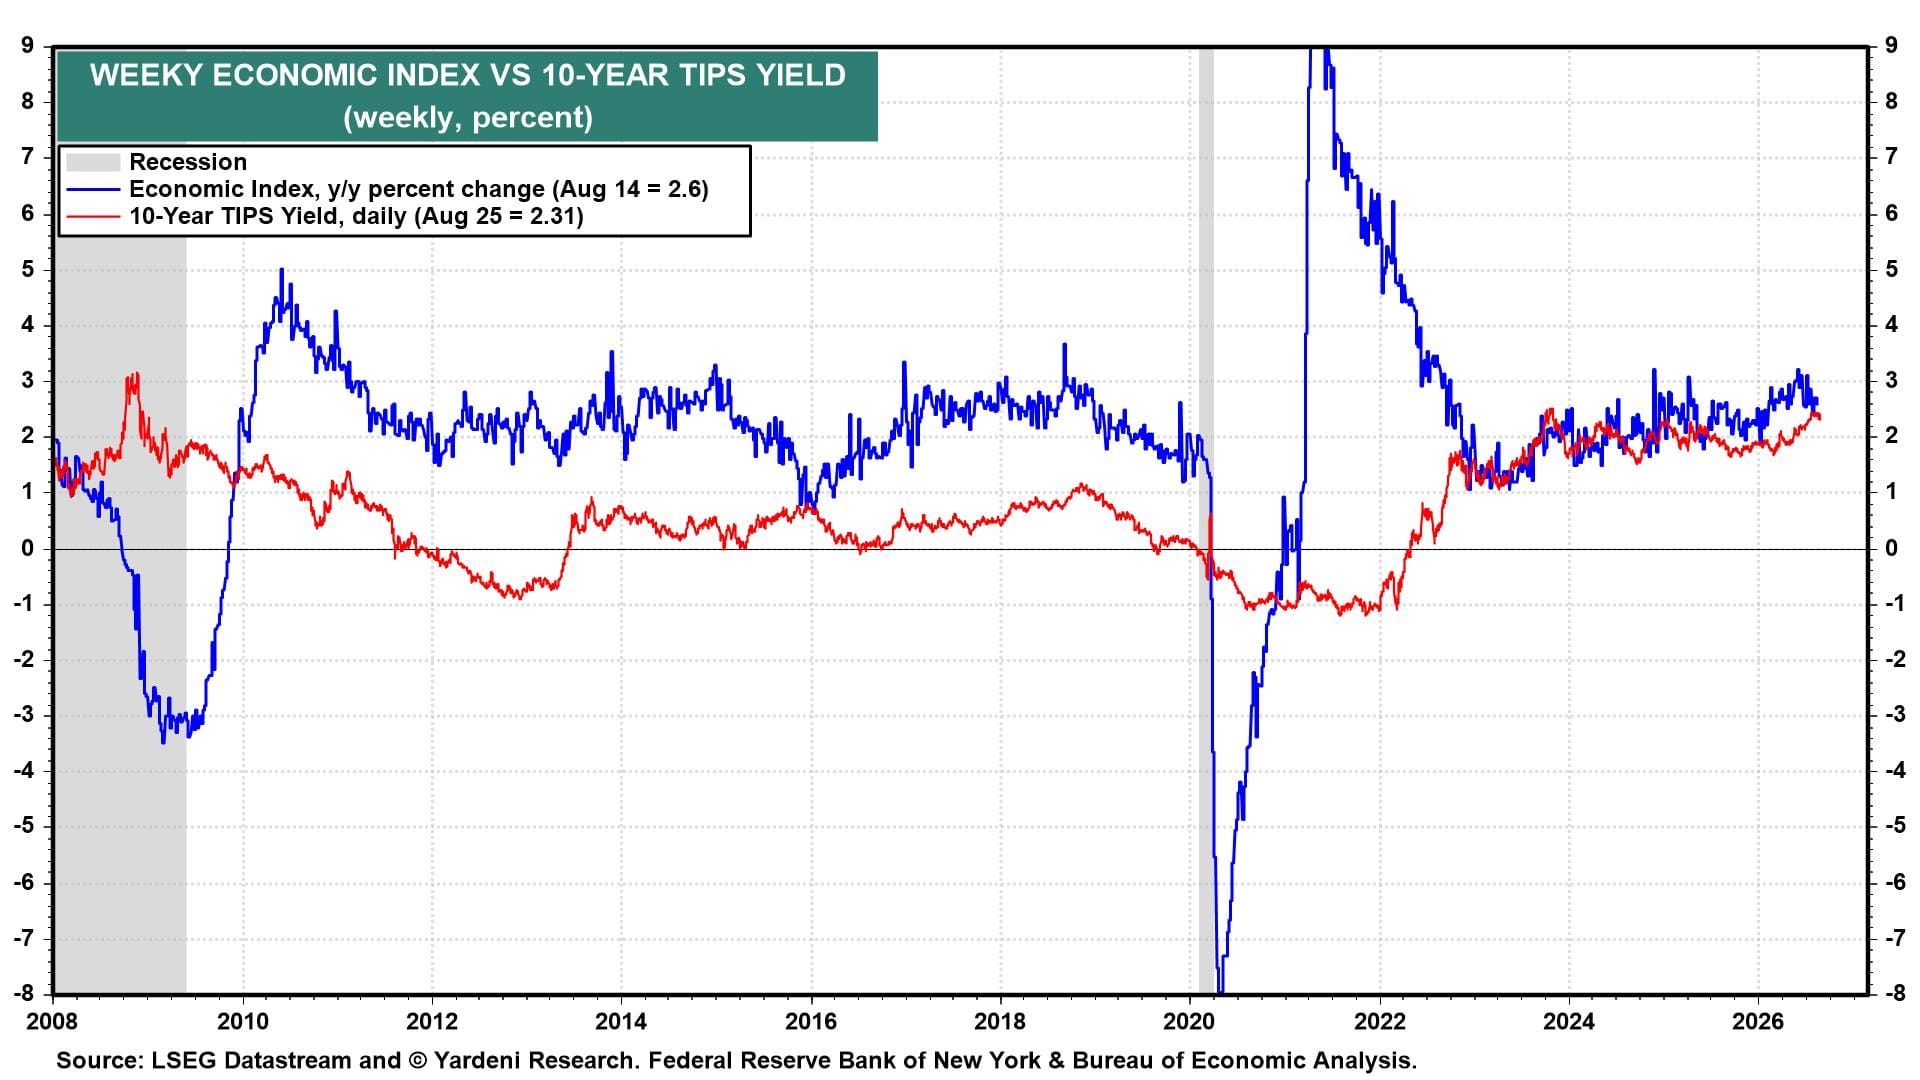
Most of the recent rise in the nominal 10-year Treasury yield has reflected higher real yields, with the 10-year TIPS yield climbing alongside the Weekly Economic Index, a proxy for real GDP growth (chart).
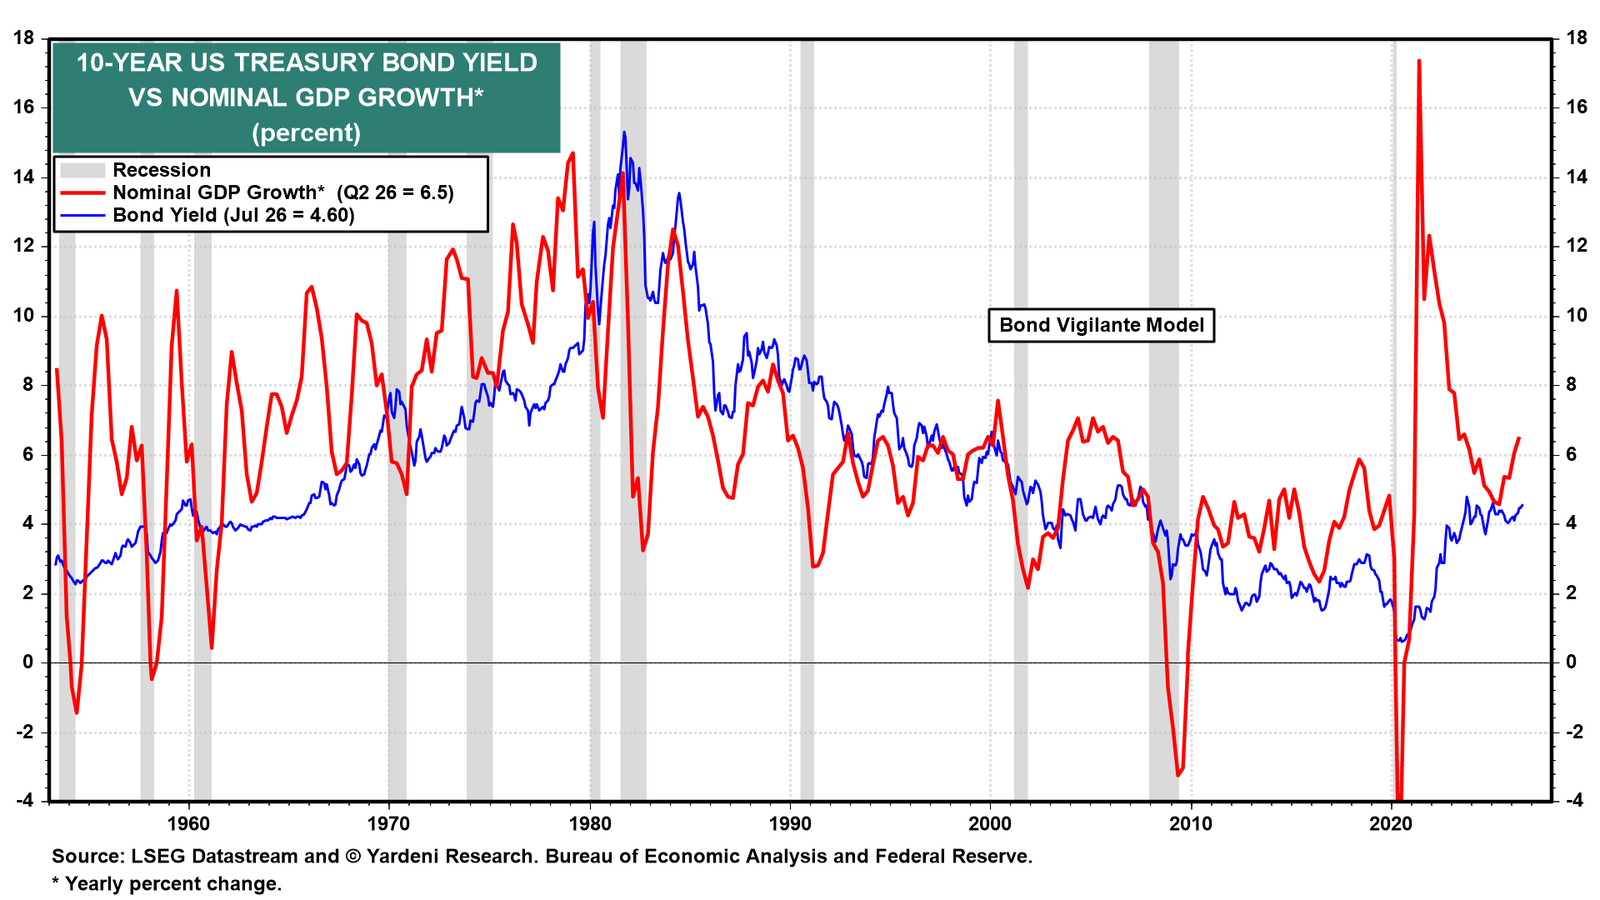
Additionally, the 10-year Treasury yield is not unusually high relative to nominal GDP growth (chart). The bond yield is where it should be relative to the fundamentals.
There is no need to panic that the Bond Vigilantes are on the loose. We will worry about them if the bond yield jumps toward nominal GDP growth. The Bessent Put makes that a less likely outcome.
III. Inflation & The Fed
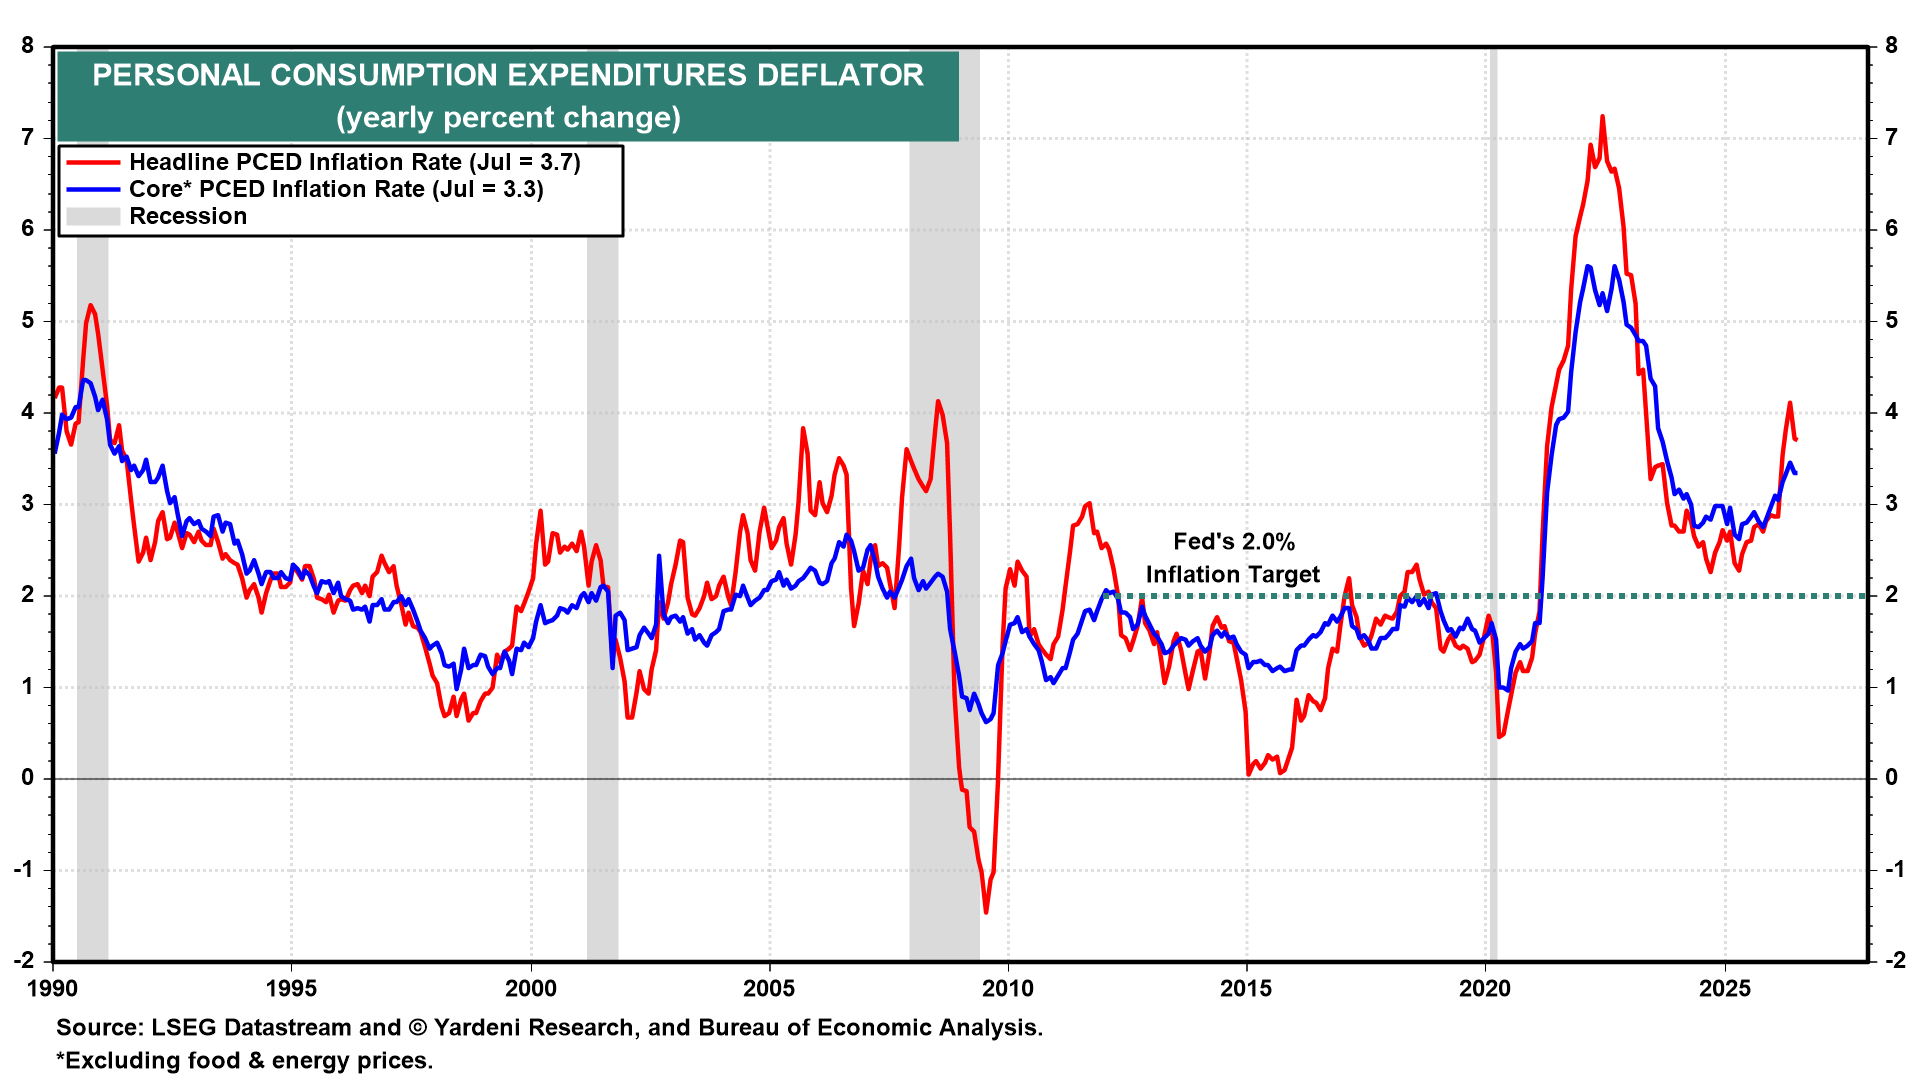
Headline PCED inflation rose 0.2% m/m and 3.7% y/y in July, while core PCED increased 0.2% m/m and 3.3% y/y (chart). Both annual rates were unchanged from June levels and have remained well above the Fed's 2.0% y/y target for more than five years.
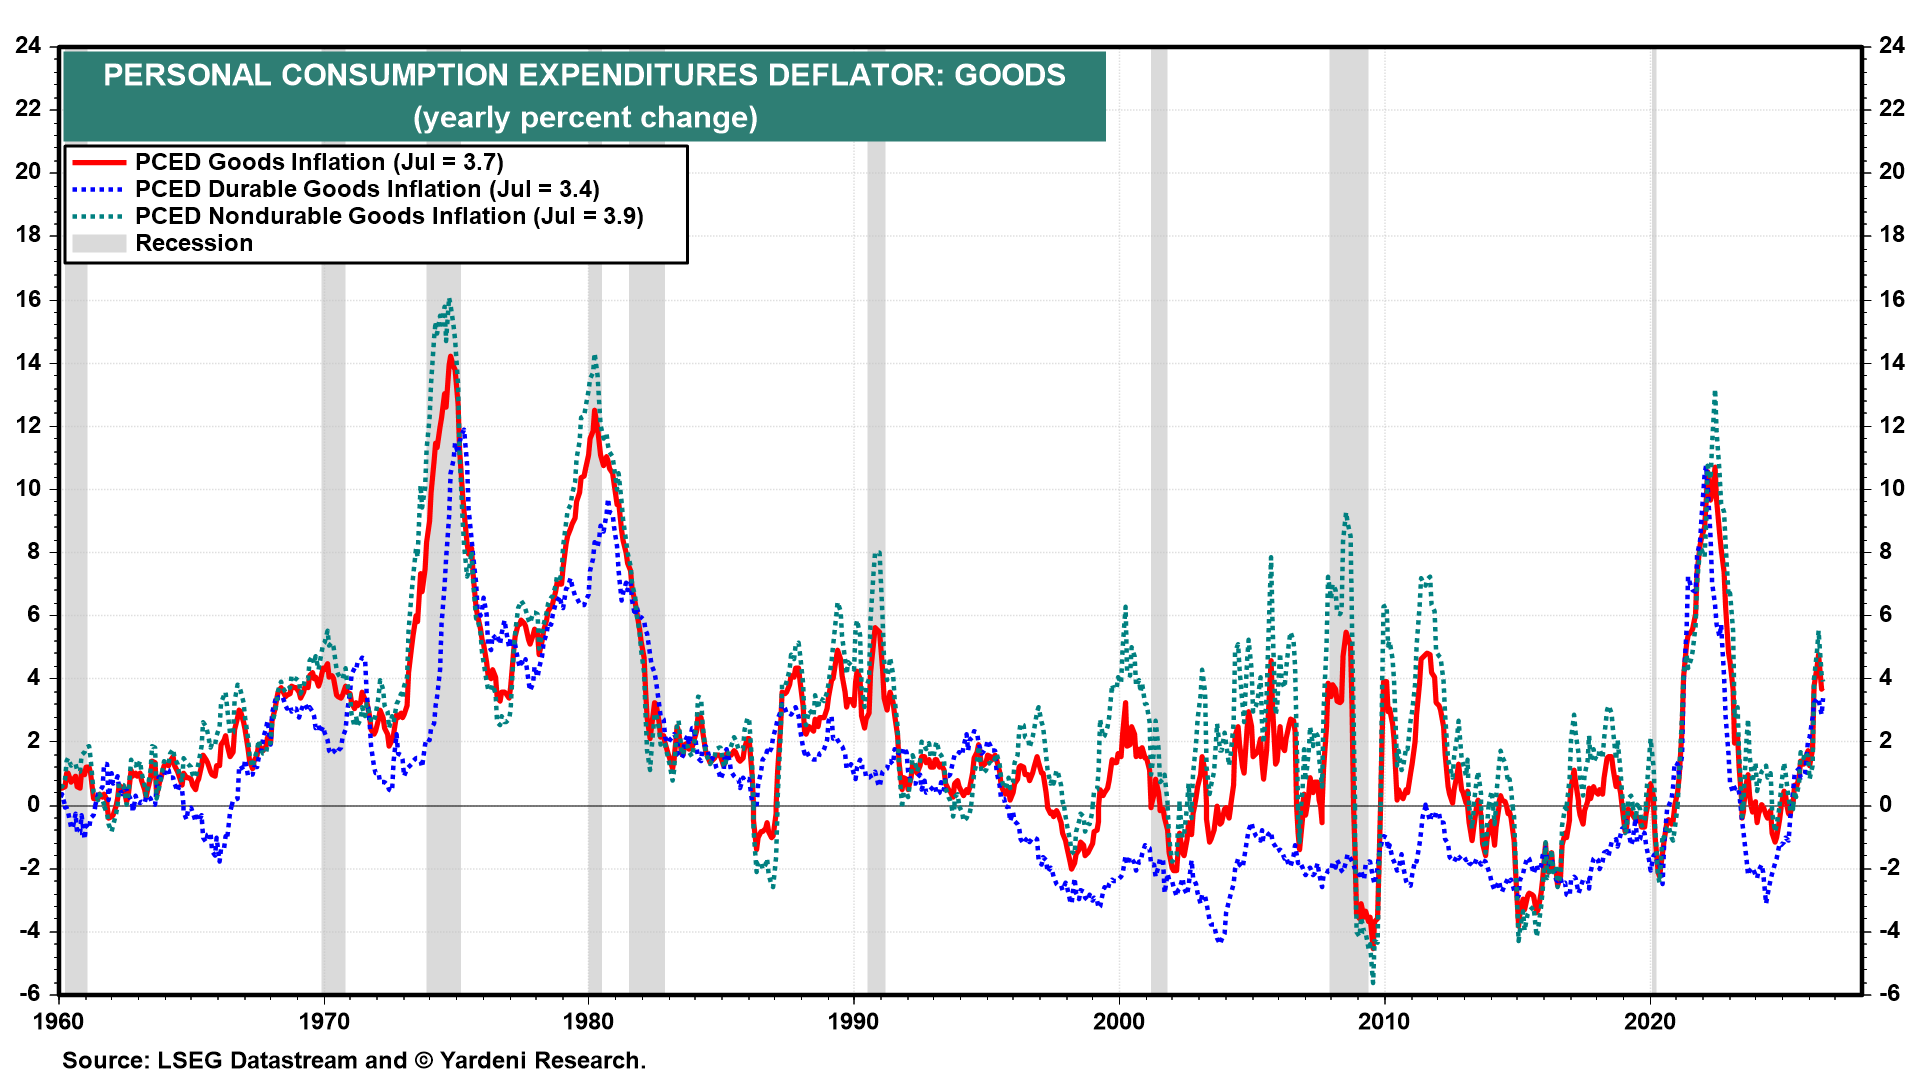
The PCED for goods rose 3.7% y/y in July, also unchanged from the June level (chart). A 2.7% m/m decline in energy goods prices offset a 1.4% increase in information processing equipment prices. We expect goods inflation to remain sticky in the months ahead as AI-related prices rise, energy disinflation fades, and tariffs continue to boost prices.
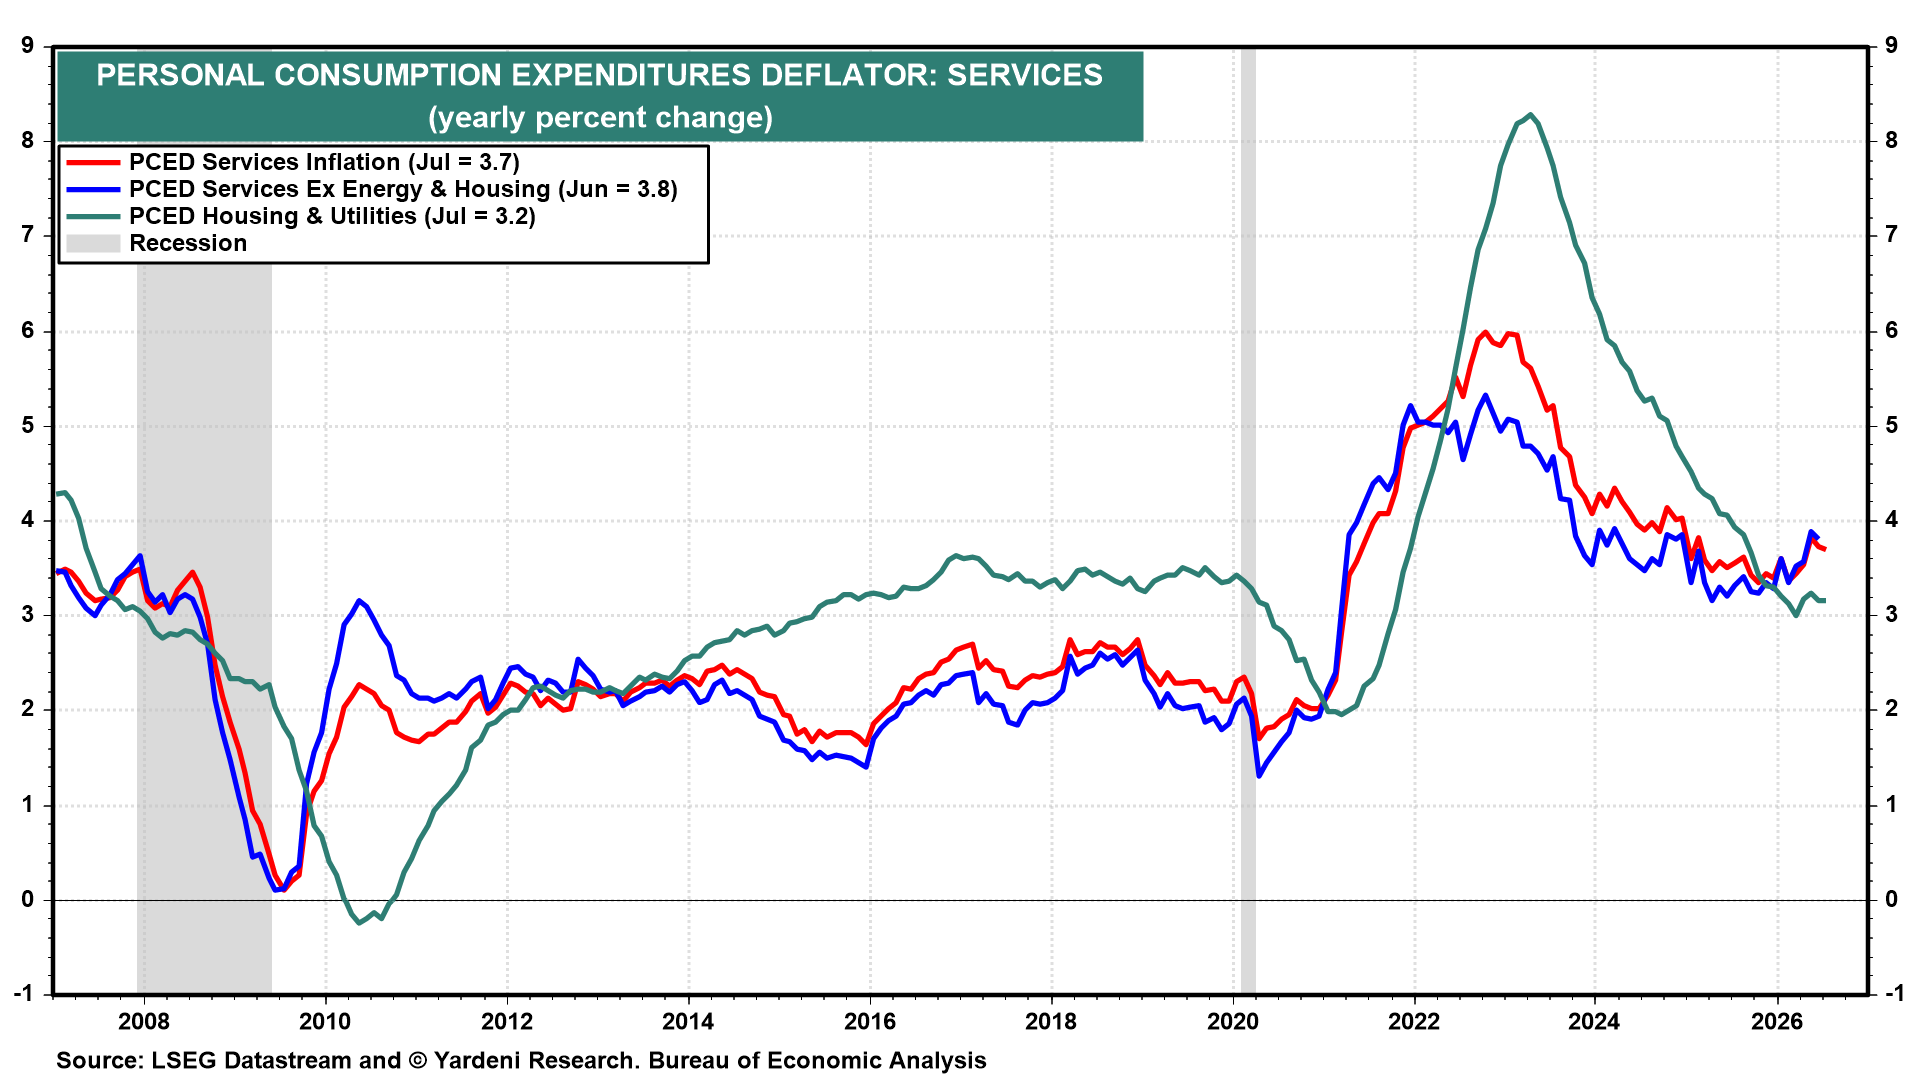
The PCED for services held steady at 3.7% y/y in July (chart). "Supercore" services PCED, which excludes housing and energy, was also unchanged, at 3.8% y/y. Both measures point to persistently sticky service-sector inflation.
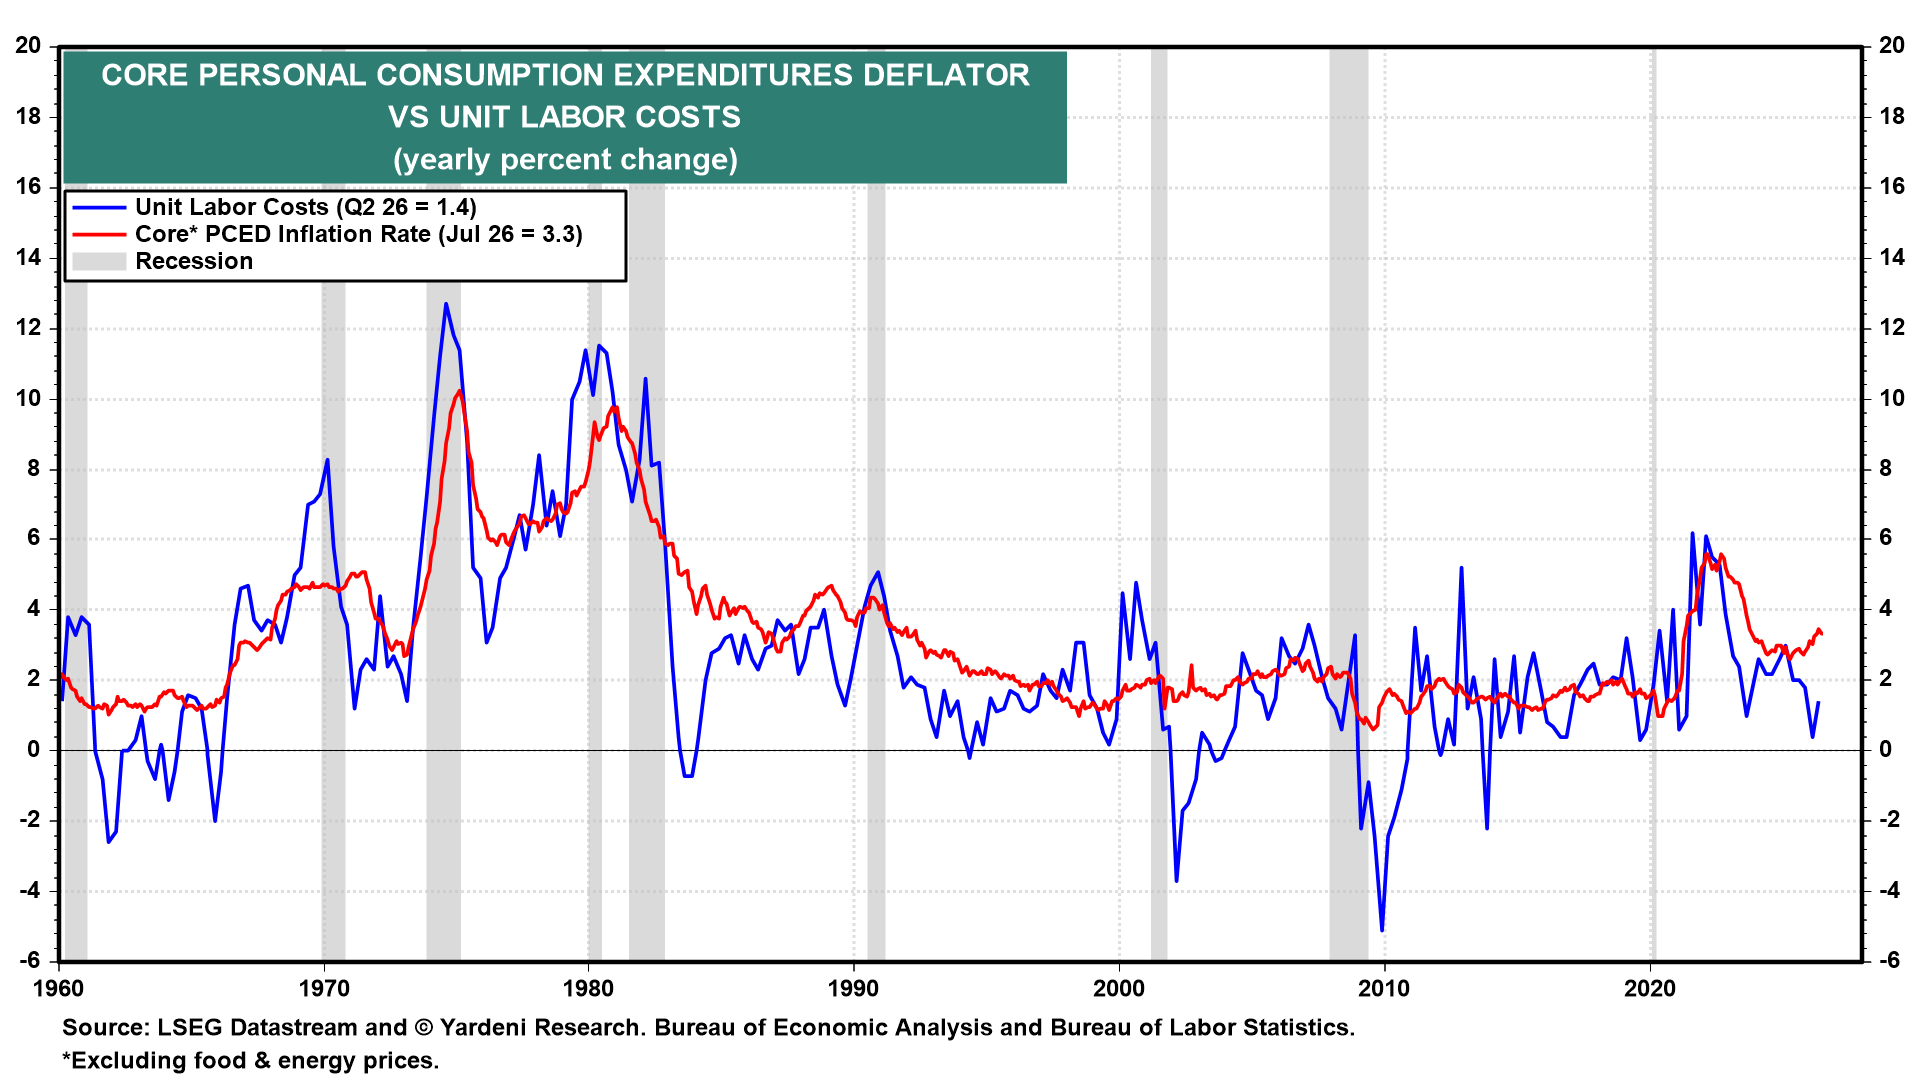
The good news is that the labor market is an important source of disinflation, as productivity gains have been offsetting hourly compensation increases (chart).
The hawks who dissented at the July FOMC meeting will likely push again for a September rate hike, arguing that inflation has remained above the Fed's 2.0% target for too long and that monetary policy isn't restrictive enough.
The owlish majority, meanwhile, appears to be following New York Fed President John Williams' framework, under which core PCED readings above 0.2% m/m could warrant a policy response, while readings at or below 0.2% would support a hold. July's core PCED reading technically met that threshold, at 0.246% m/m, while annual inflation rates continued to show no progress toward the Fed's inflation target.
On balance, we think the inflation data strengthen the case for a September rate hike.
IV. Consumer Spending & Income
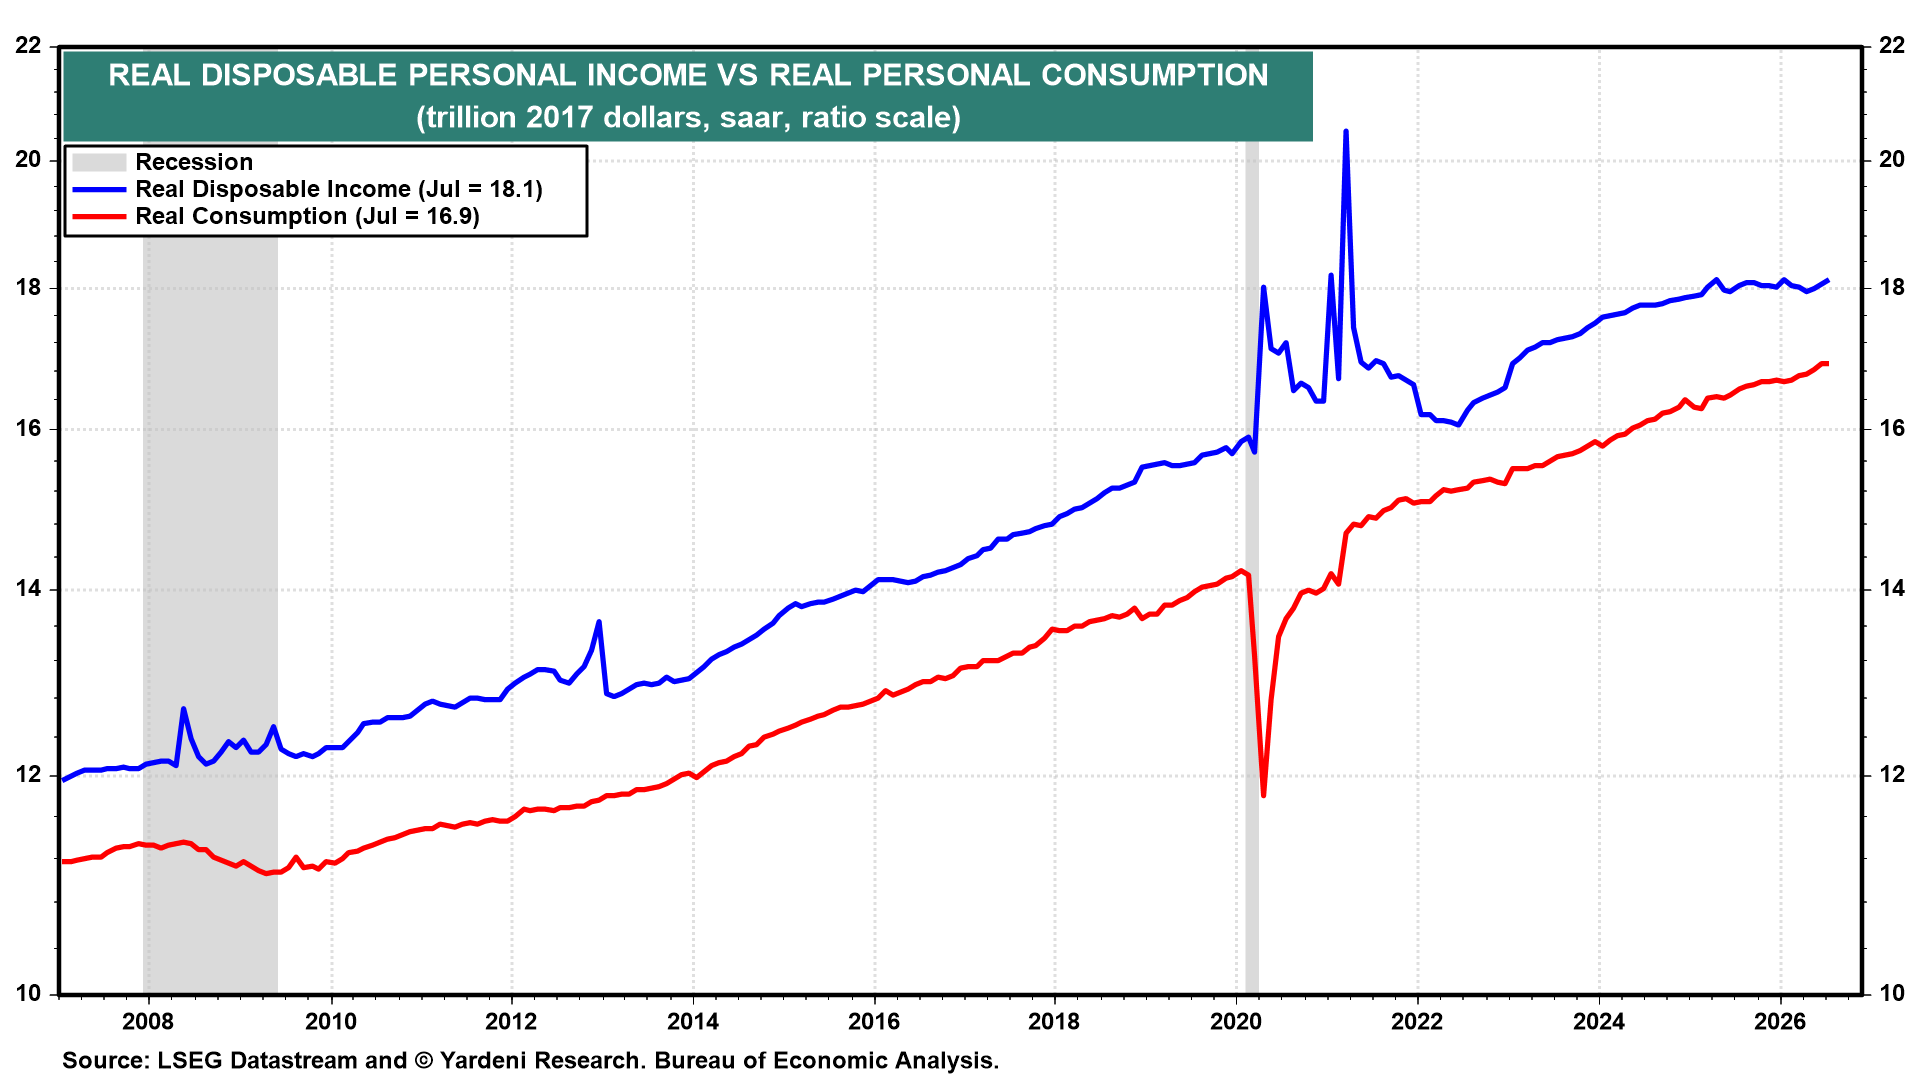
The July spending data confirmed that consumer spending slowed as boosts from the World Cup, Amazon Prime Day, and OBBBA tax refunds faded. Real consumer spending was unchanged in July following a 0.4% m/m increase in June (chart). Meanwhile, real disposable personal income (DPI) rose 0.4% m/m, its strongest increase since January (chart). Nevertheless, real DPI has been essentially flat for more than a year and is likely to remain so as Baby Boomers continue to retire.
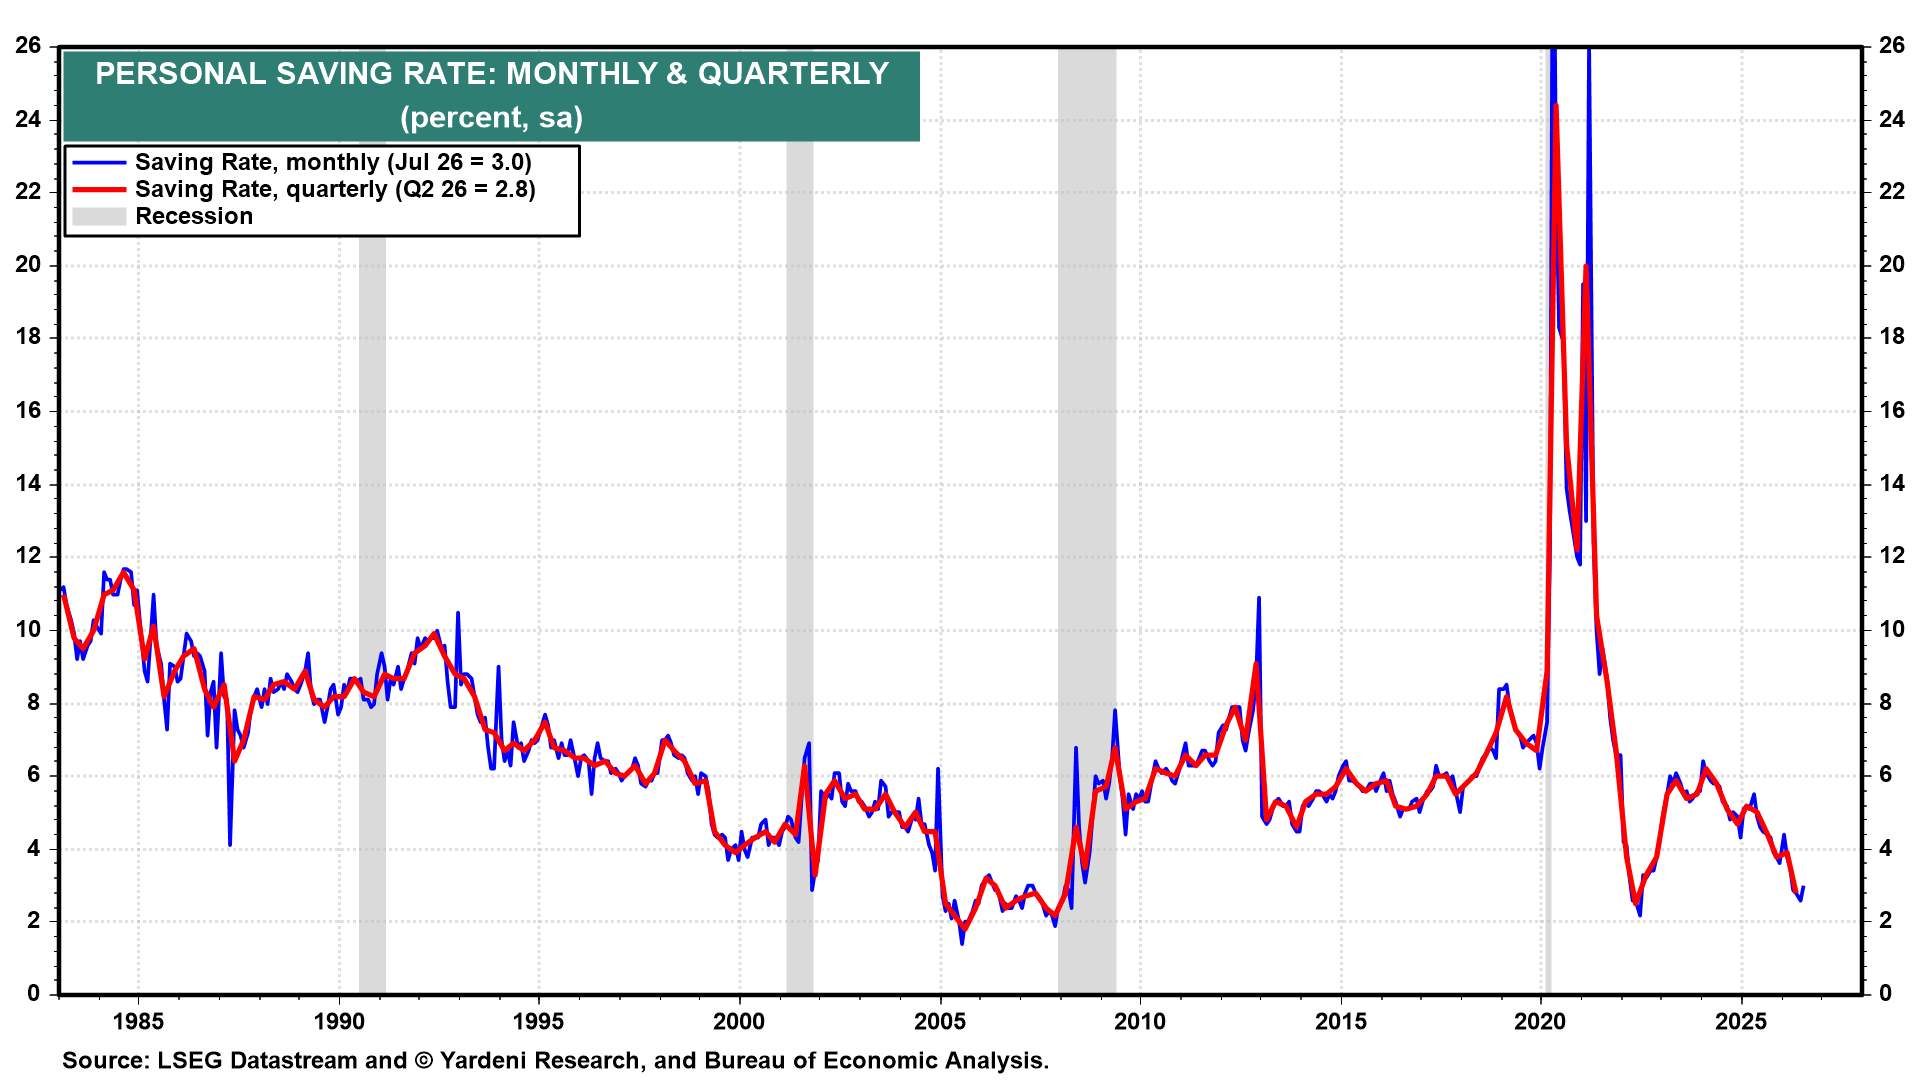
July's saving rate rose to 3.0%, a four-month high, as income growth outpaced spending growth (chart). We expect the saving rate to trend lower over time as more Baby Boomers retire and draw down their considerable wealth to support spending.
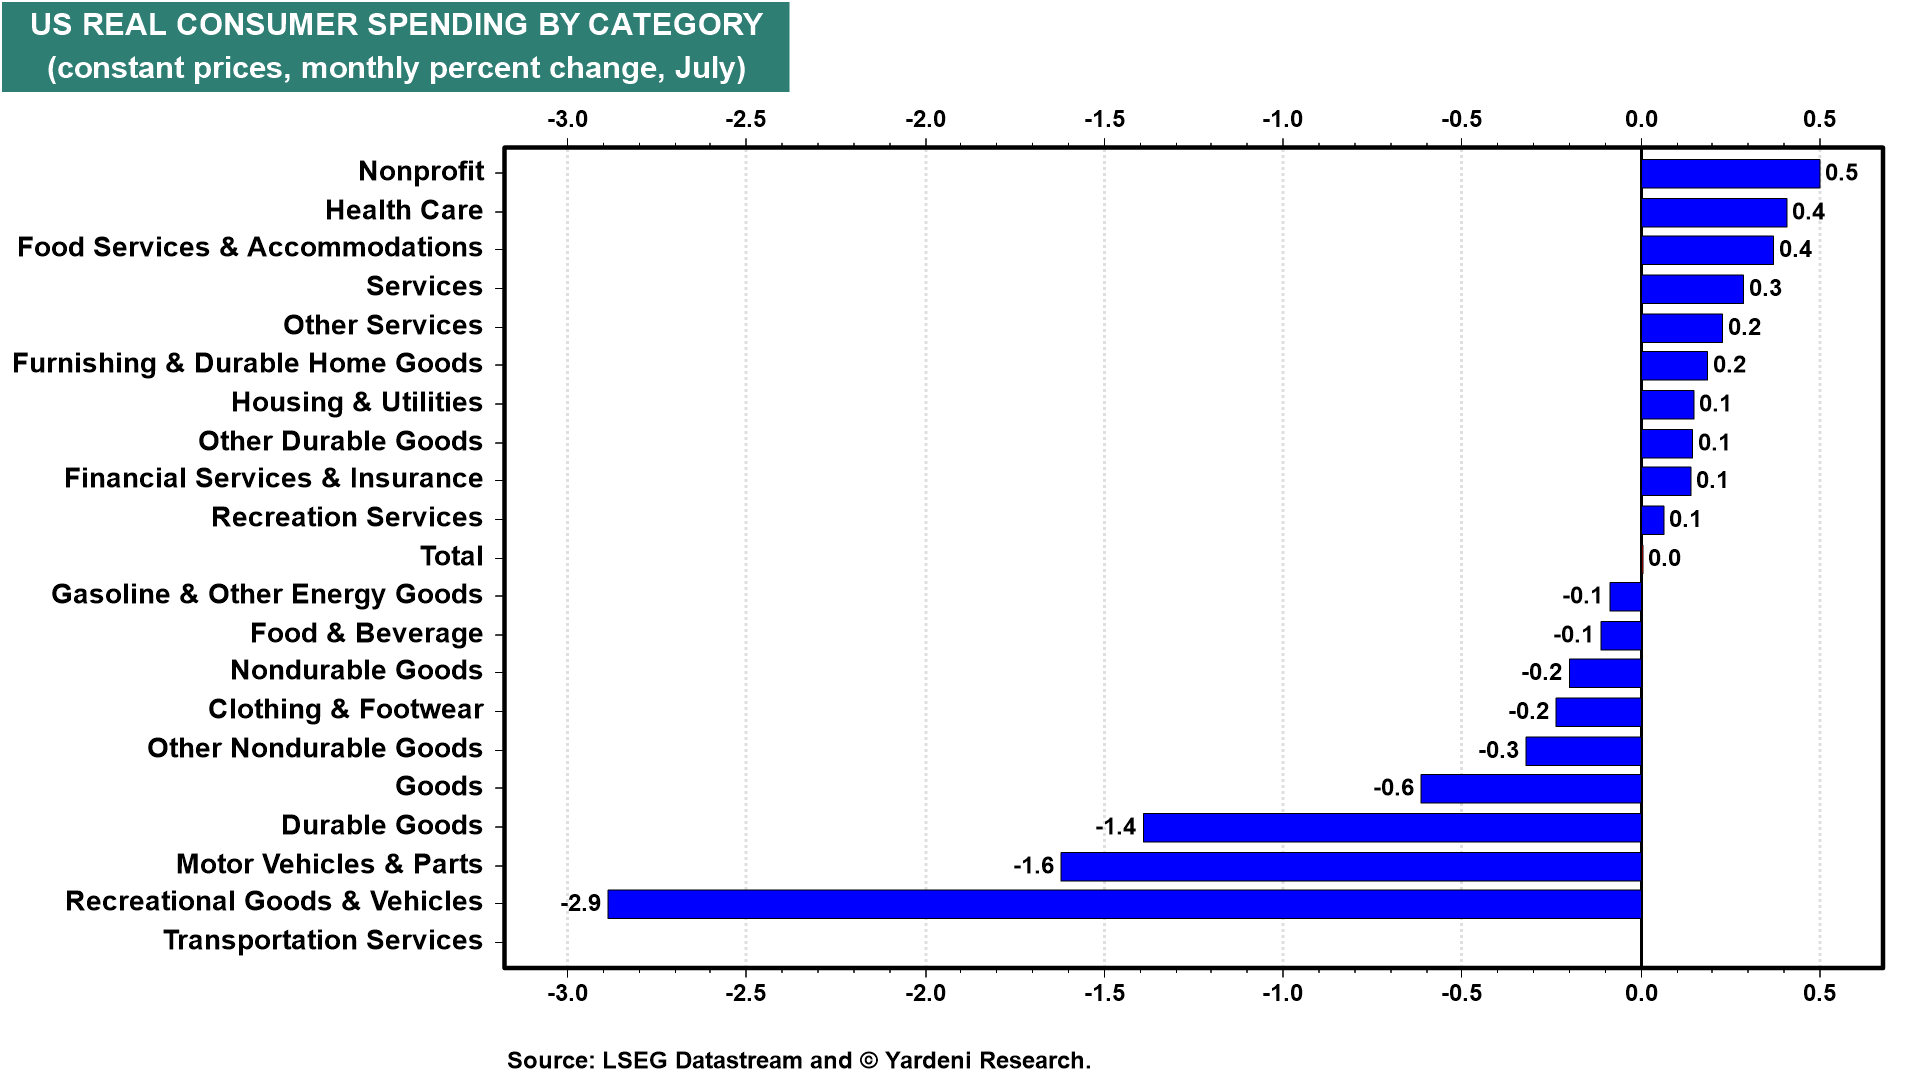
A closer look at the flat July spending reading shows that most of the weakness was concentrated in goods spending, likely reflecting a slowdown following June's Amazon Prime Day boost. By contrast, spending at food services and restaurants, a key discretionary category, rose a solid 0.4% (chart).
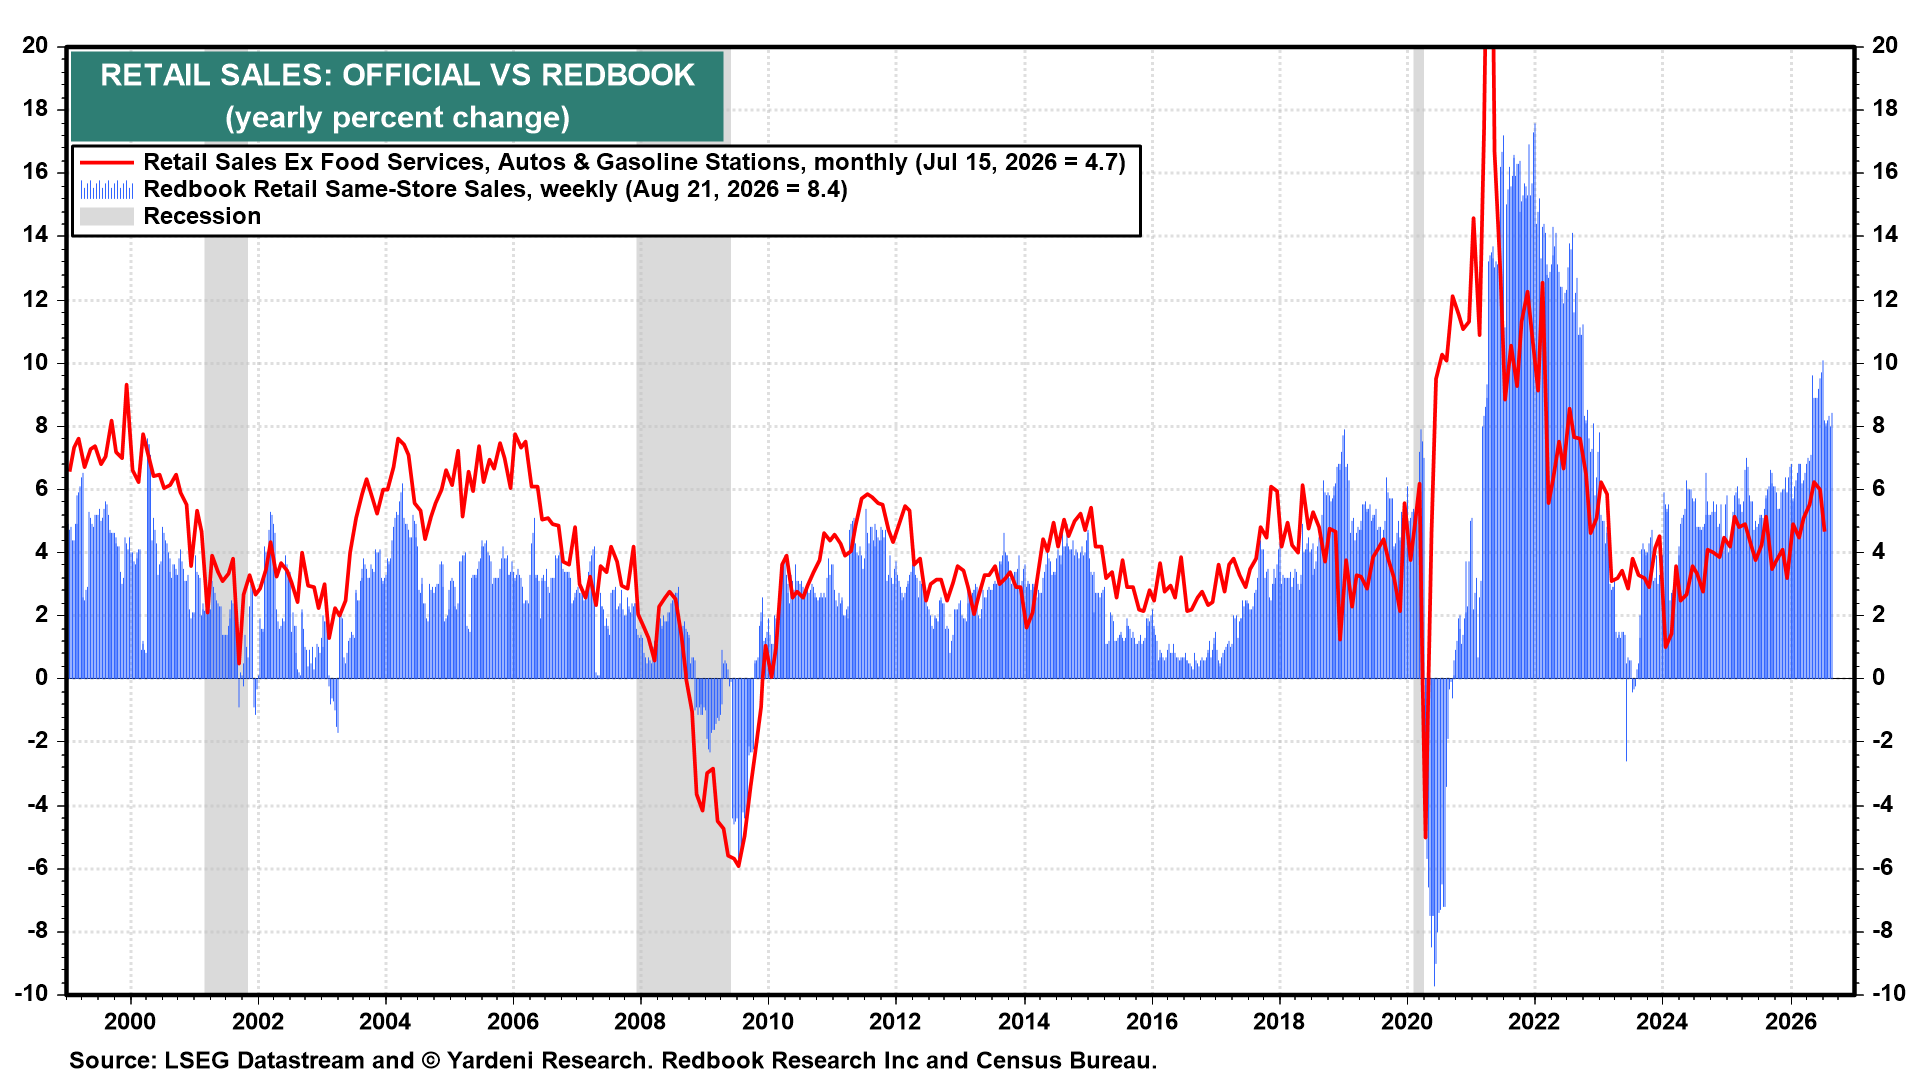
We expect consumer spending to remain resilient through the second half of the year. Supporting that view, Redbook's same-store sales index was up 8.4% y/y in the week of August 21, well above its 2025 average of 5.8% (chart).