The following is an excerpt from our Morning Briefing dated January 12, 2025.
US Economy I: Productivity Is Roaring
Last week was a very good one for our Roaring 2020s scenario. That’s because last week’s batch of economic data supported our productivity-led economic boom narrative. Real GDP growth was very strong during the last three quarters of 2025. The growth rate of employment slowed dramatically. As a result, productivity growth soared last year. Unit labor costs inflation fell significantly, suggesting that consumer price inflation should fall closer to 2.0% this year.
If this scenario continues to play out during 2026 and through the end of the decade in 2029, the outlook for S&P 500 earnings is excellent and consistent with our S&P 500 target of 10,000 by the end of the Roaring 2020s. Unlike the Roaring 1920s, which ended badly during the 1930s, the Roaring 2020s could be followed by the Roaring 2030s.
Let’s assume that productivity growth transitioned from 2.0% to 3.0% in 2025 and will remain at that higher pace for the foreseeable future. That would boost real GDP growth by a full percentage point per year. It would lower unit labor costs inflation by as much. It would boost real wages of workers, more than offsetting the slower pace of employment. So the real purchasing power of consumers would continue to grow, with less of that growth coming from new workers and more coming from higher real wages. Profit margins would rise, boosting total profits and driving capital spending higher.
That picture-perfect outlook seemed delusional when we first laid it out during the summer of 2020. Six years later, it remains on track. We obviously are feeling more confident about it. But we are still assigning a 60% subjective probability to our Roaring 2020s scenario. We are also still assigning 20% to a meltup/meltdown scenario and 20% to a bearish outcome for the economy and the stock market before the end of the decade.
US Economy II: Productivity by the Numbers
I’ve been writing about productivity for a very long time. I mention the word 201 times in my 2018 book Predicting the Markets: A Professional Autobiography. It is an economic variable that, like the late comedian Rodney Dangerfield, “gets no respect.” It is usually underestimated or totally ignored by most macroeconomists.
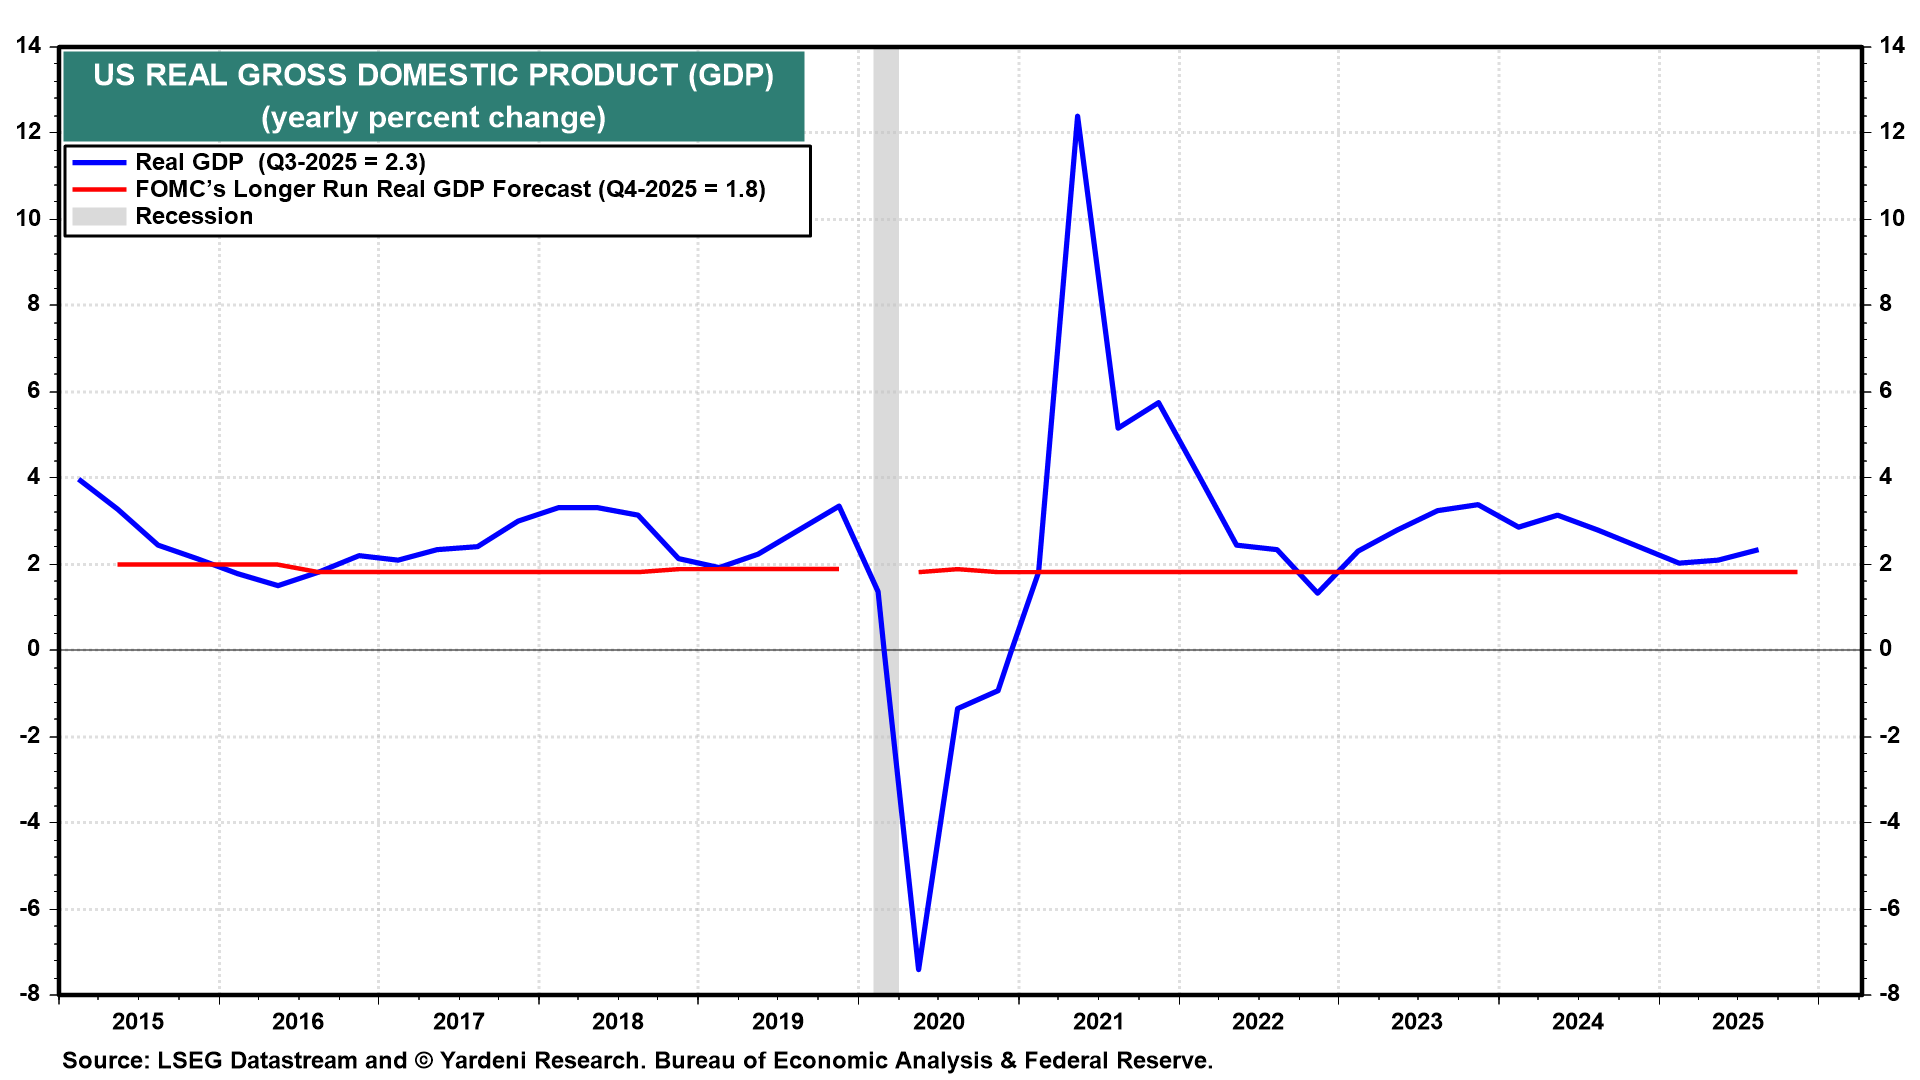
The FOMC’s latest Summary of Economic Projections shows that the 19 participants on the monetary policy committee, on average, estimate the “longer run” growth rate in real GDP to be only 1.8% (Fig. 1 below). This average projection is available since Q2-2025. In our Roaring 2020s scenario, better-than-expected productivity growth is likely—and likely the reason that the FOMC may be underestimating the growth of real GDP in coming years.
Let’s have a closer look at the productivity-related data:
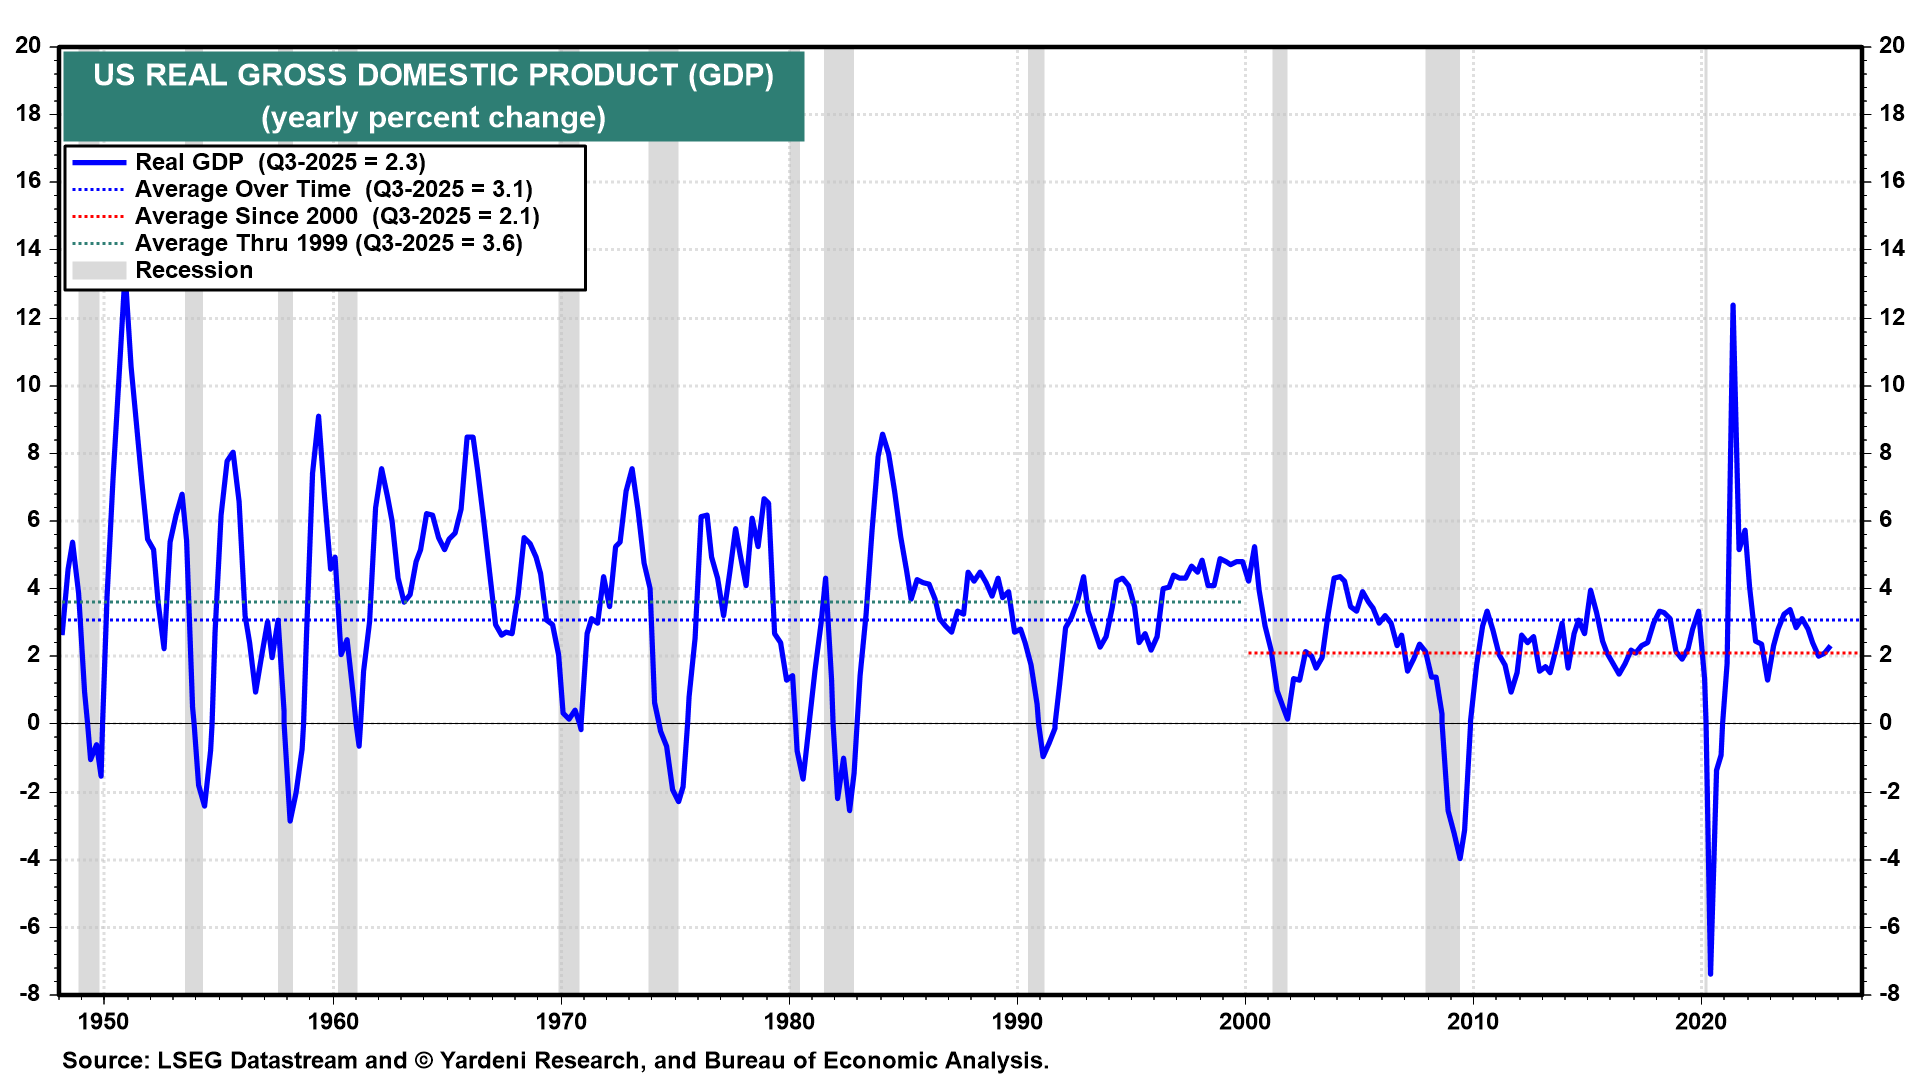
(1) Real GDP & real output. Since the late 1940s, the growth rate of real GDP has averaged 3.1% (Fig. 2 below). This average slowed to 2.1% measured since 2000. It was 2.3% y/y during Q3-2025. In our Roaring 2020s scenario, real GDP growth should grow 3.5%-4.0% in coming years if productivity growth continues to improve.
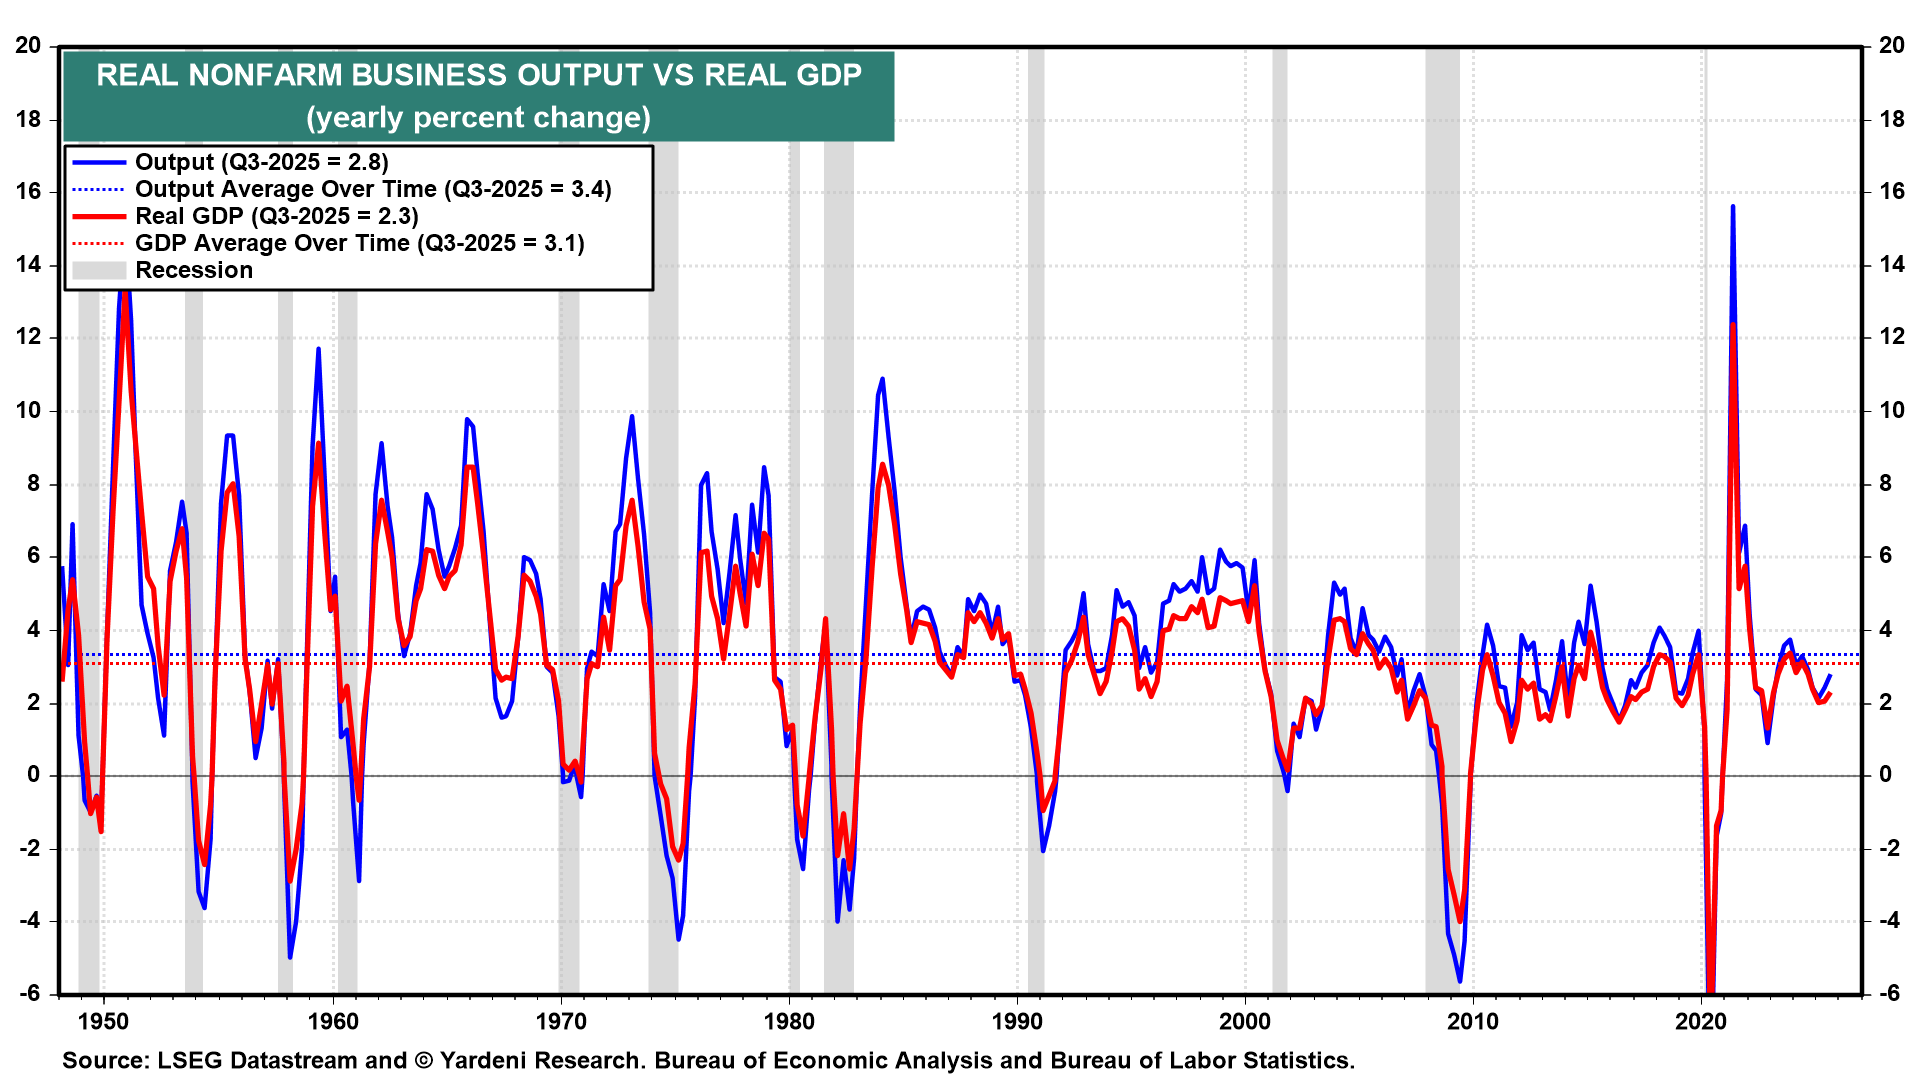
The measure of productivity, which is compiled by the Bureau of Economic Analysis, is the ratio of nonfarm business output to labor hours. Output closely tracks real GDP (Fig. 3 below). On a y/y basis, the former was up 3.4% while the latter was up 2.3% through Q3-2025.
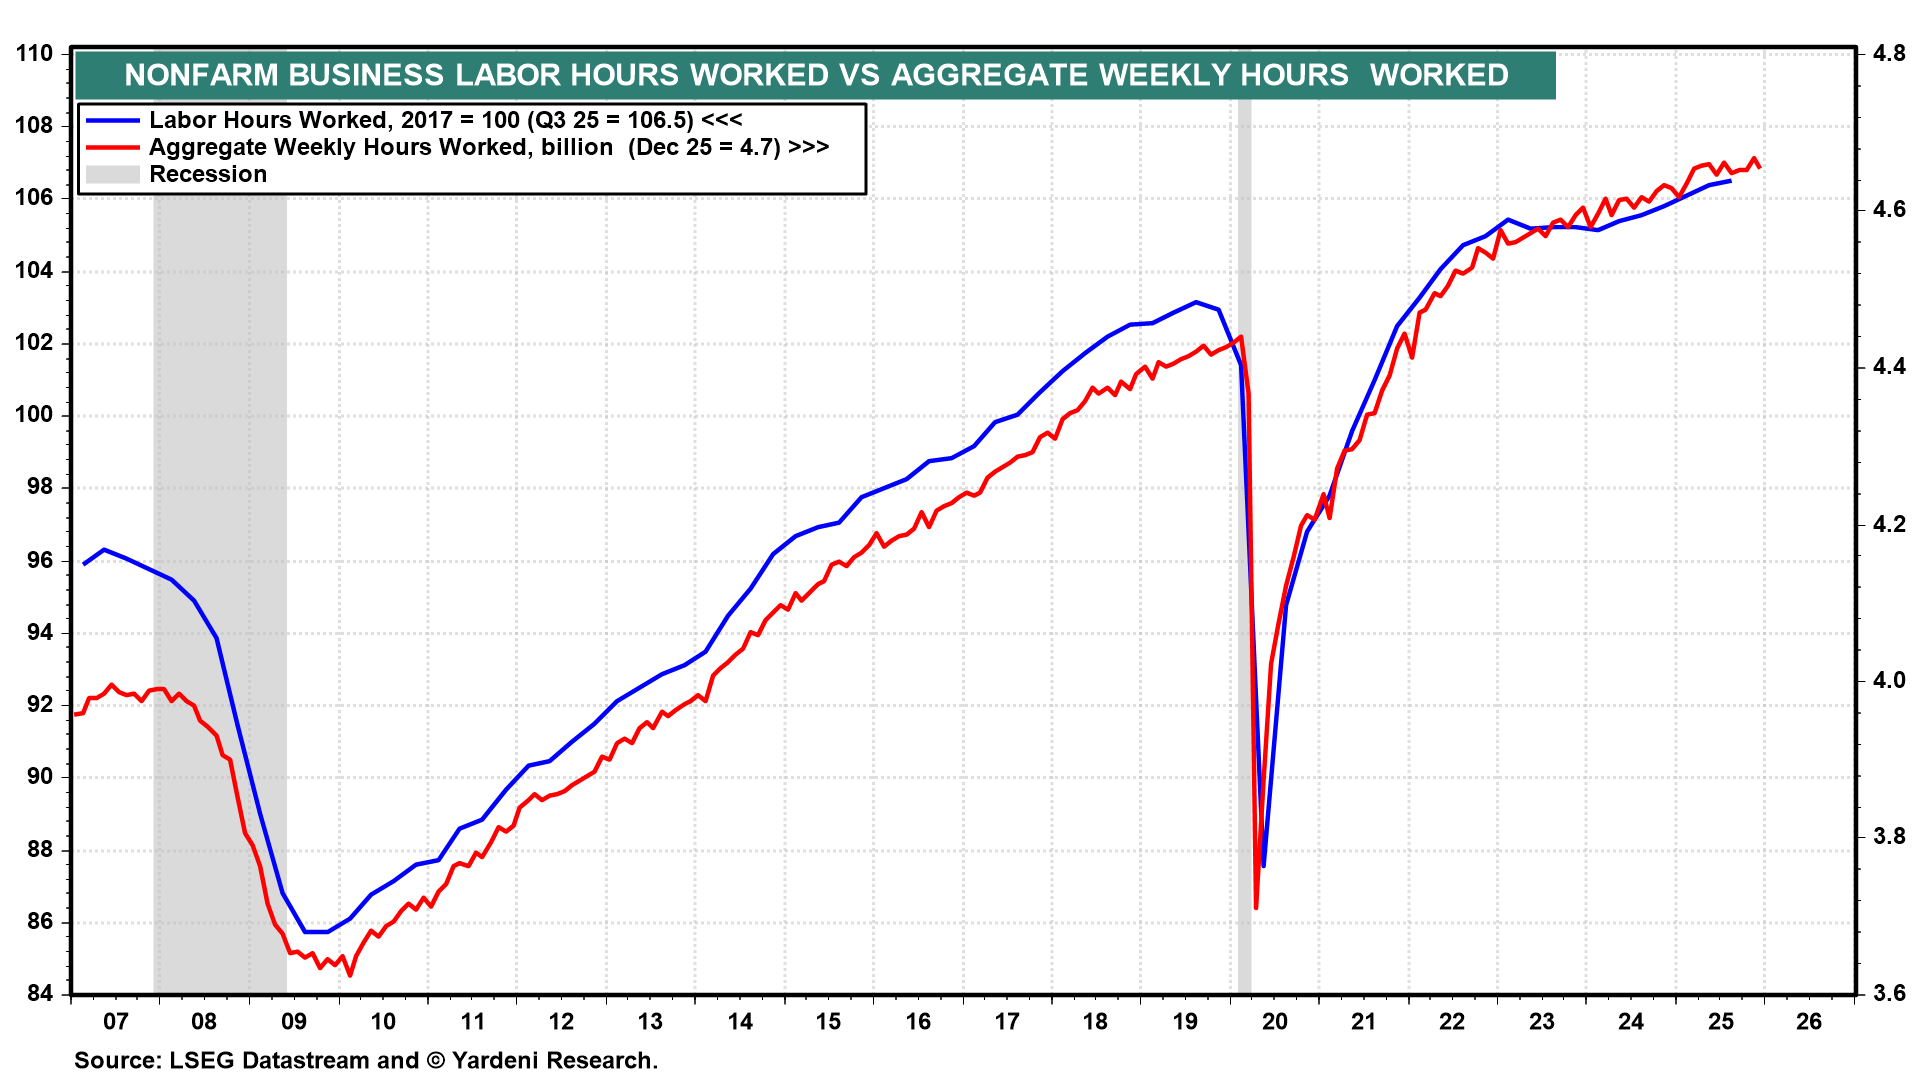
(2) Labor hours & the labor force. The denominator in the productivity ratio is determined by aggregate hours worked, which is total nonfarm business payroll employment (which counts the number of full-time and part-time jobs, not the number of workers) times average weekly hours in the private sector.
Contributing to the dramatic rebound in productivity during both Q2 and Q3 of last year was the virtual flattening in aggregate hours worked from April through December 2025 (Fig. 4 below). Both payrolls and the average weekly hours in private industry were relatively flat over this period (Fig. 5 and Fig. 6).
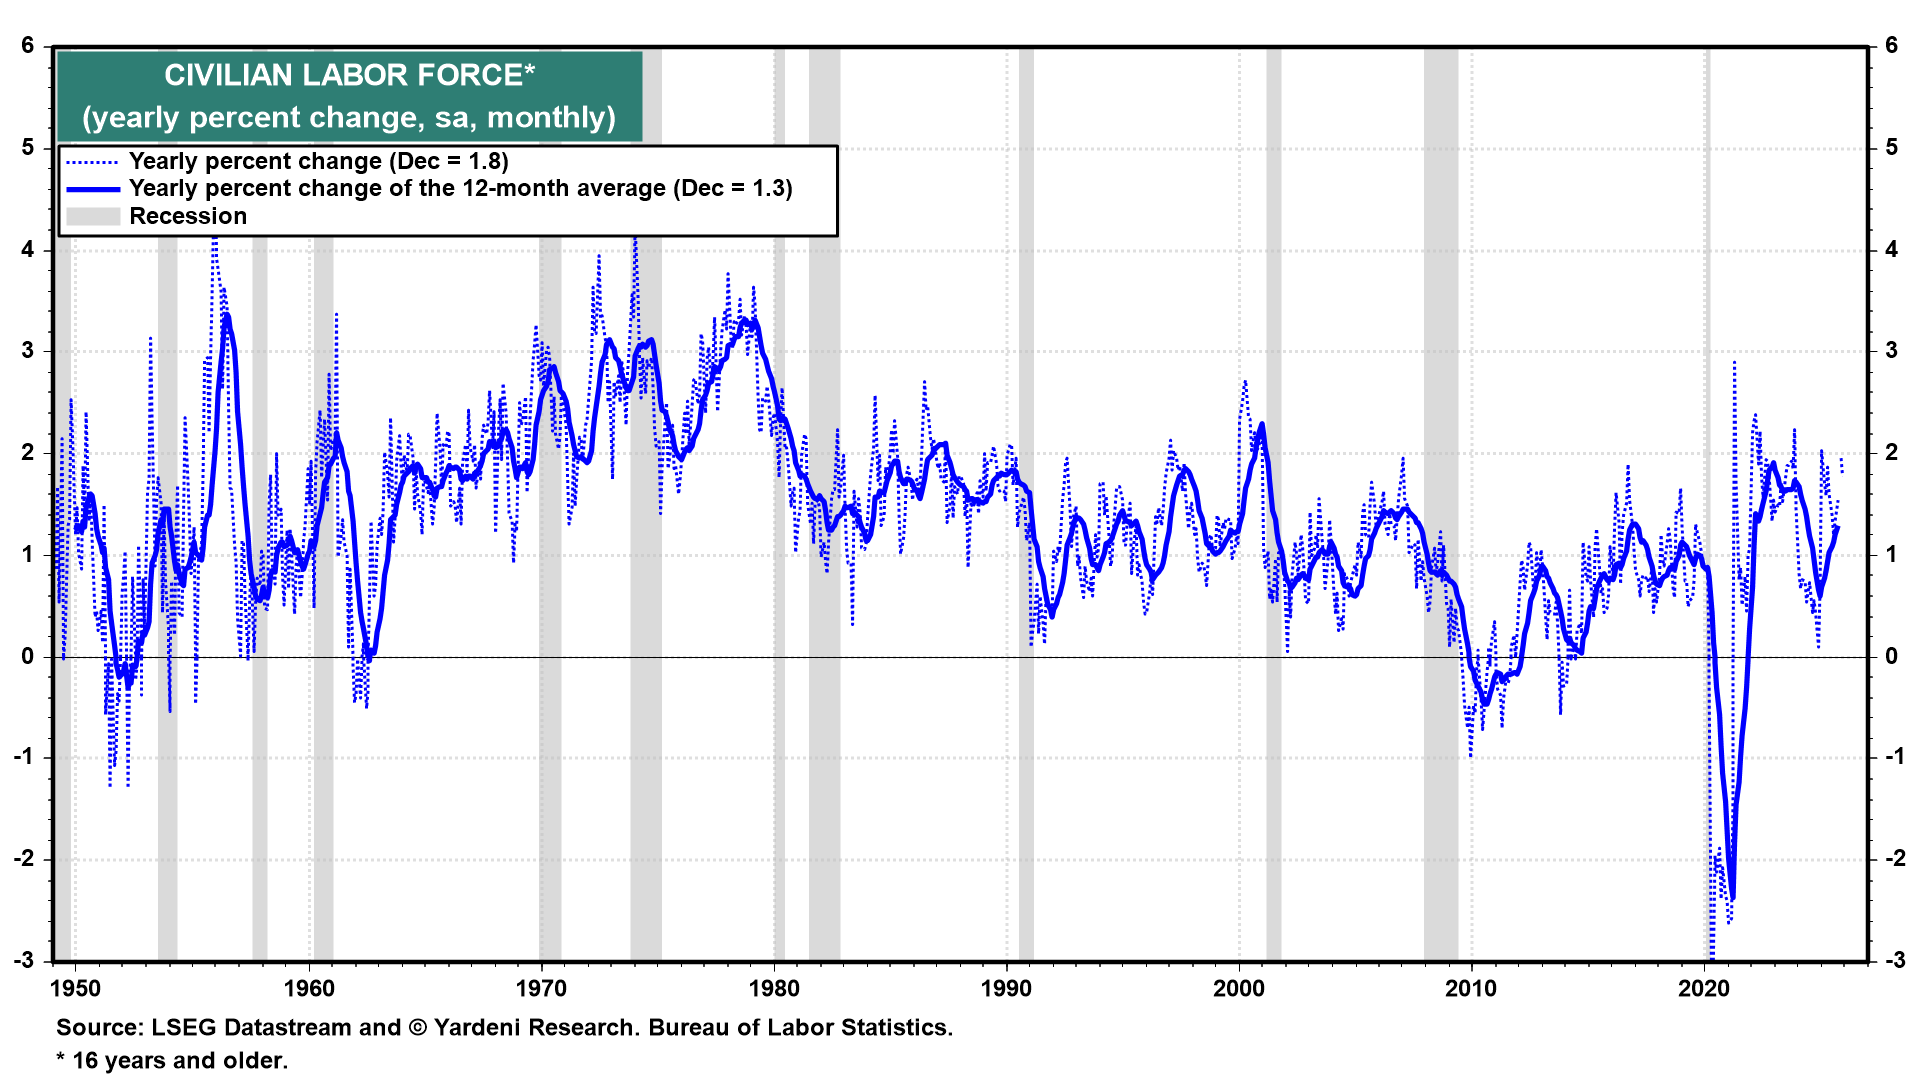
Interestingly, the weakness in employment occurred despite a solid increase in the labor force. The latter was up 1.8% y/y, and its 12-month average was up 1.3% (Fig. 7 below). Those are reasonably solid growth rates considering the surge in deportations and the restrictions on immigration. Despite these developments, the foreign-born labor force still rose 1.8% y/y in 2025, down from a peak of 6.3% during December 2022 (Fig. 8).
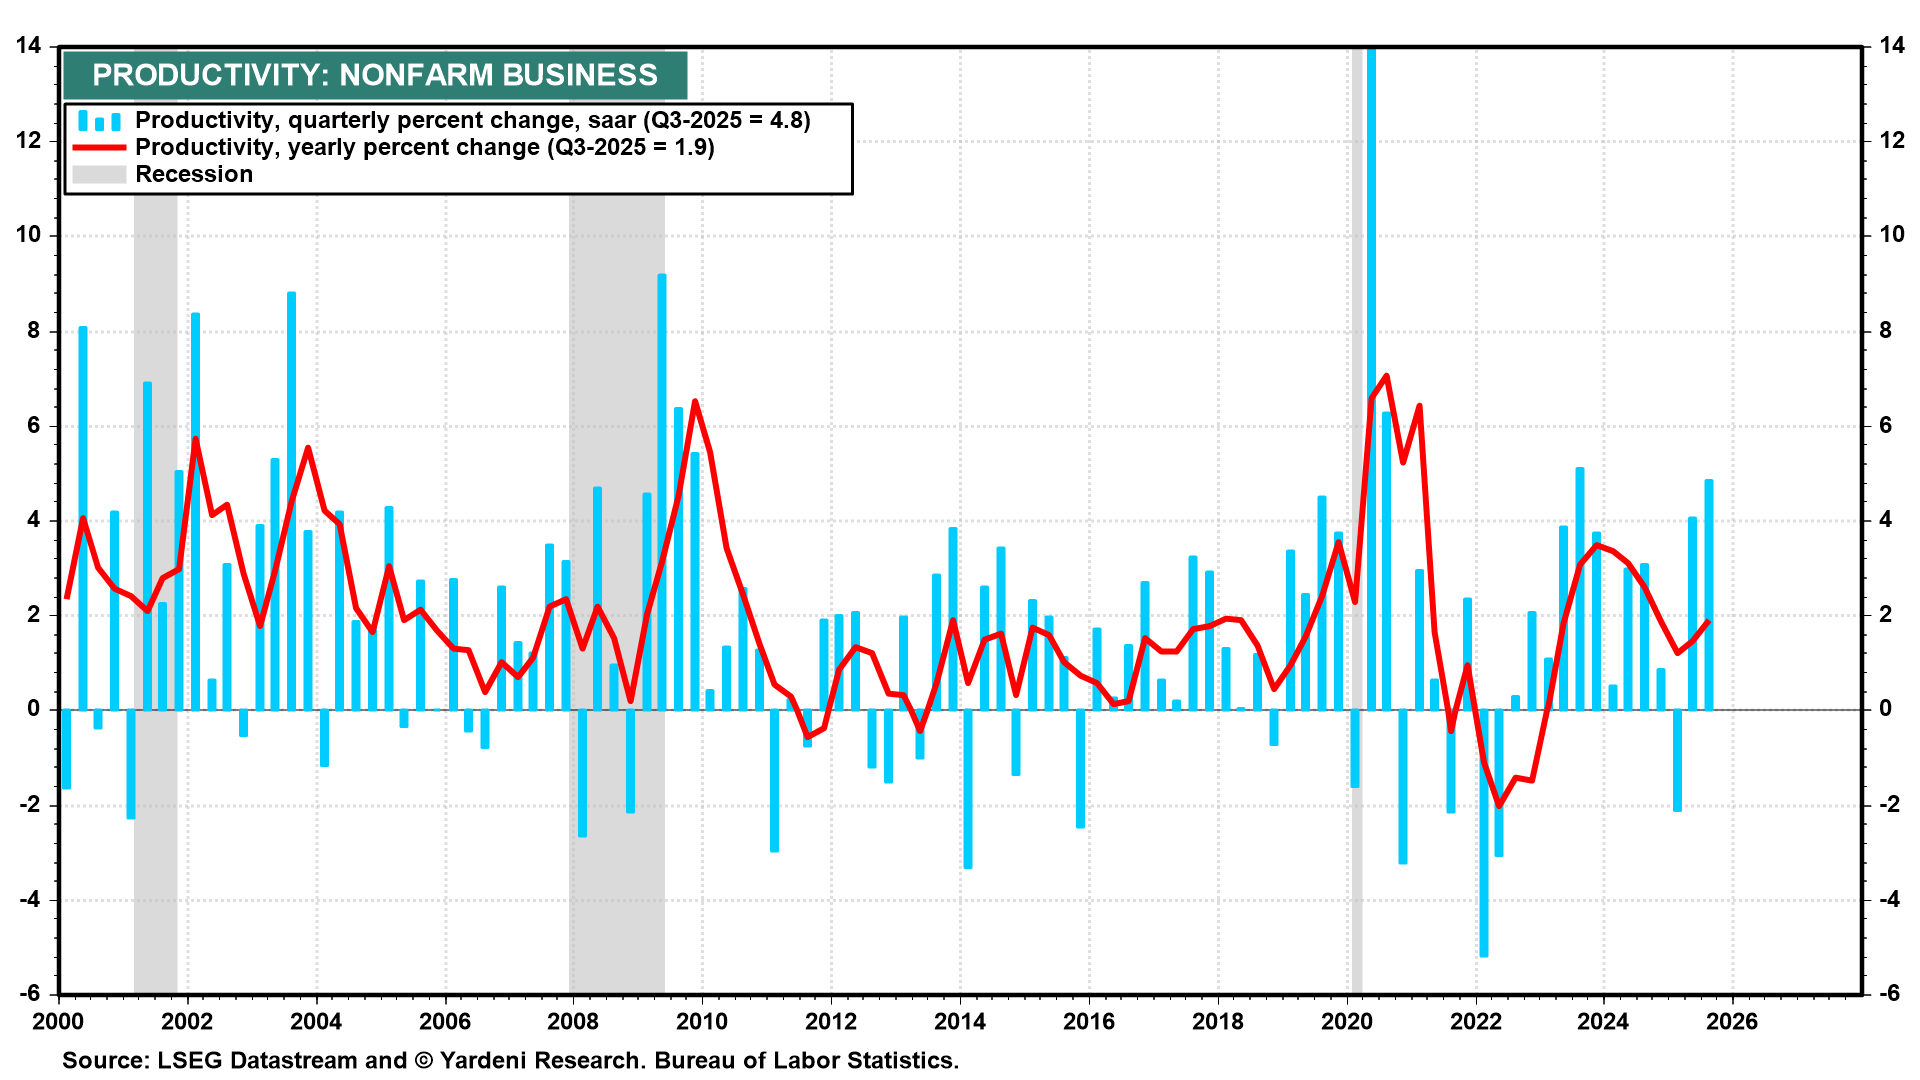
(3) Productivity. Nonfarm business sector labor productivity increased 4.9% (saar) in Q3-2025, as output increased 5.4% and hours worked increased 0.5% (Fig. 9 below). Q2-2025 productivity was revised up from 3.3% to 4.1%, as output increased 5.2% while hours worked rose 1.0%. These are awesome numbers!
(4) Unit labor costs and inflation. Unit labor costs (ULC) in the nonfarm business sector decreased 1.9% in Q3-2025, reflecting a 2.9% increase in hourly compensation and a 4.9% increase in productivity (Fig. 10). ULC during Q2-2025 was revised down from 1.0% to -2.9%. ULC increased only 1.2% (y/y). This confirms our view that CPI inflation should fall to 2.0% this year.
(5) Real wages & purchasing power. Productivity is the driver of real hourly compensation, which is the purchasing power of American workers (Fig. 11). The level of productivity rose to a record high during Q3-2025 and should continue doing so in 2026. If it does, then real hourly compensation should also move higher this year. We can monitor consumers’ purchasing power by tracking real average hourly earnings for all workers, which continues to rise along a 1.0% y/y trend line (Fig. 12).
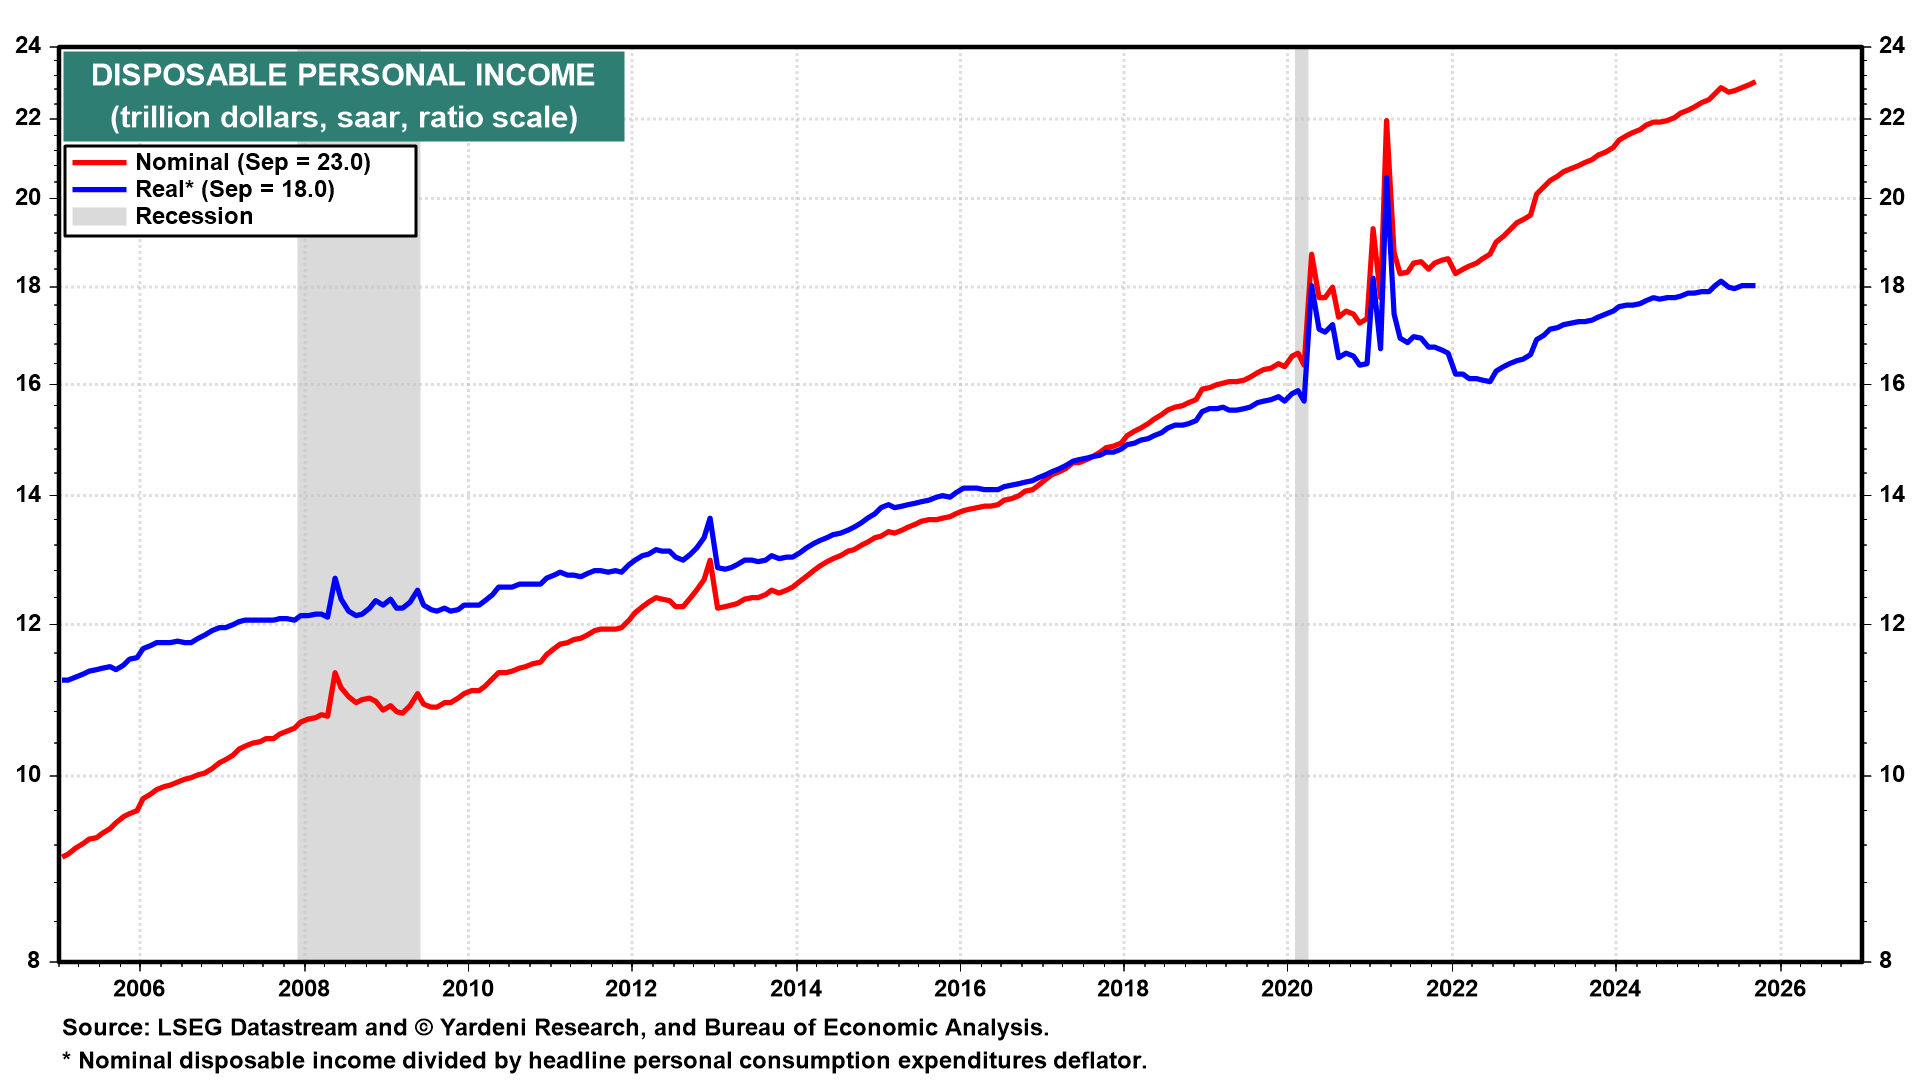
A potential risk to our Roaring 2020s scenario is that real wages don’t rise fast enough to fully offset the weakness in employment. In fact, real disposable personal income has been flat in recent months (Fig. 13 below). The latter is the best measure of the total purchasing power attributable to labor and nonlabor income.
However, there is another potentially massive source of purchasing power, i.e., the $85.4 trillion in the household net worth of the retiring Baby Boom generation (Fig. 14). In the January 5 Morning Briefing titled “The Gen-Shaped Economy,” we discussed the economic effects of the Baby Boomers’ continued spending of their retirement nest eggs on themselves and on their adult children and young grandchildren. In this uncommon economic scenario, consumption would remain strong even as disposable income stays flat. Savings would fuel the consumption strength, and the personal savings rate would turn negative.
The Baby Boomers’ net worth includes $27.4 trillion of corporate equities and mutual fund shares (Fig. 15). So the bull market in stocks continues to bolster their net worth and their potential purchasing power. There is clearly a very positive wealth effect on consumption. Of course, the risk to this happy scenario is a bear market that might cause the retiring Baby Boomers to retrench. As we noted above, our subjective probability of this happening over the rest of the decade is 20%.
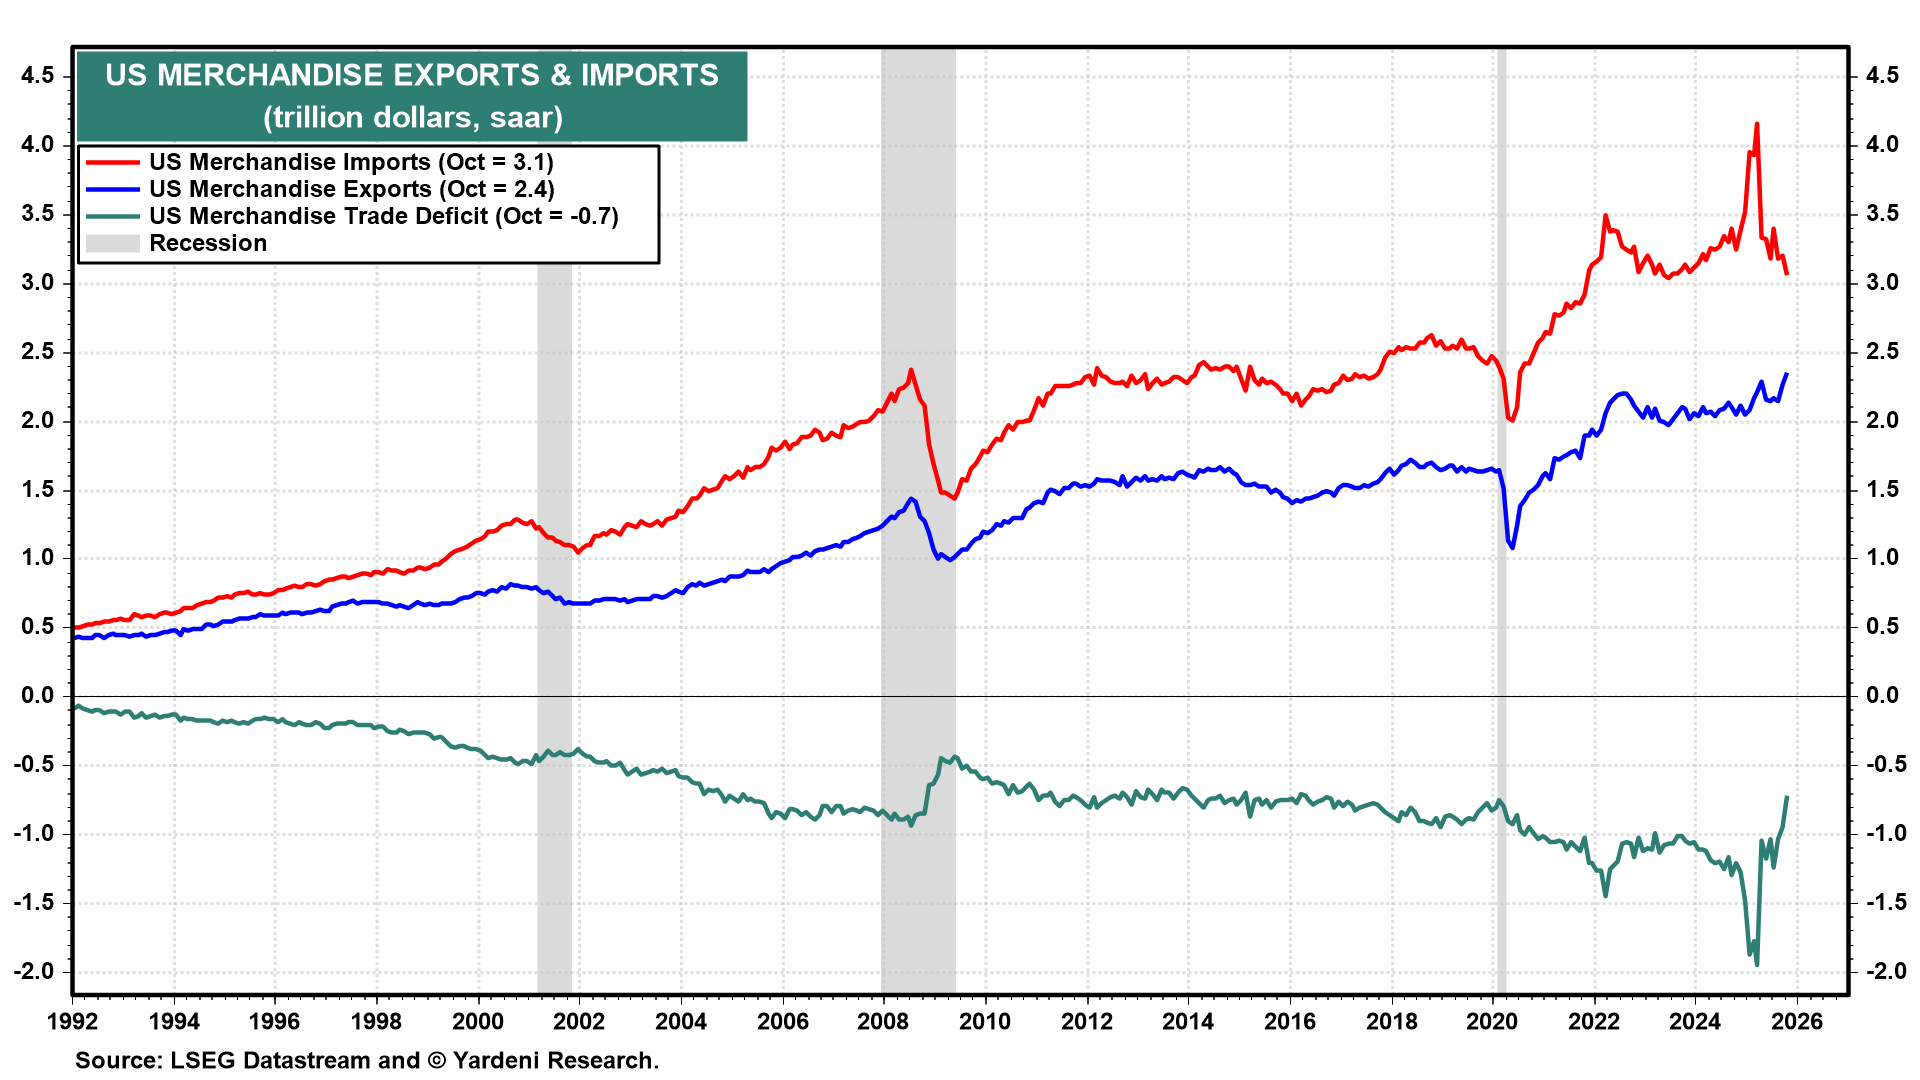
(6) Q4-2025 productivity and earnings. Productivity probably continued to grow rapidly during Q4-2025. Following Thursday’s merchandise trade report showing a big drop in imports and a big increase in exports during October, the Atlanta Fed’s GDPNow model showed that real GDP rose 5.4% (saar) during the quarter (Fig. 16 below). After Friday’s employment report, this estimate was revised down to 5.1% (Fig. 17). So the economy continued to grow rapidly, while labor hours remained weak.
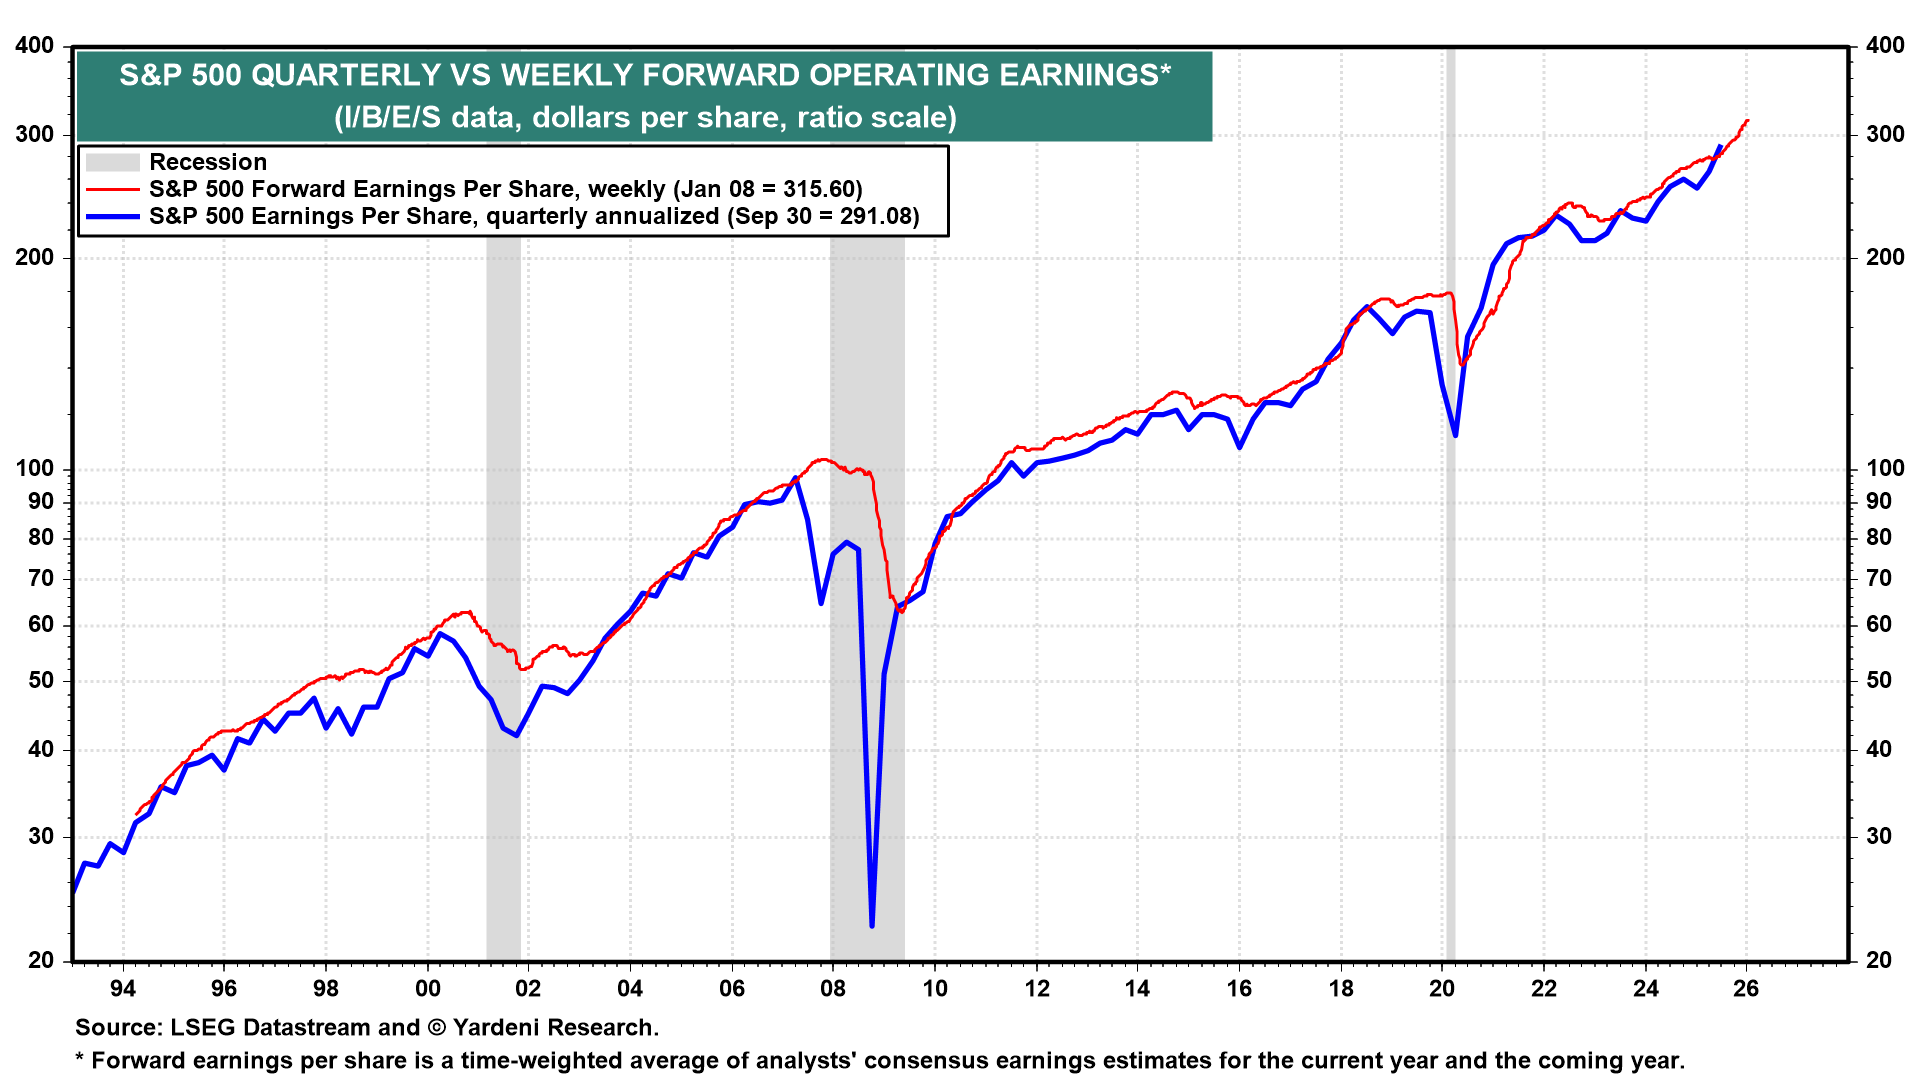
This implies that S&P 500 earnings per share rose to yet another record high during Q4 (Fig. 18 below). That’s corroborated by S&P 500 forward earnings per share, which rose sharply in recent weeks to a new record high. The same can be said for S&P 500 forward revenues per share (Fig. 19). The latest S&P 500 forward profit margin data, through the week of January 2, show that the S&P 500’s actual quarterly profit margin rose to a new record high at the end of last year (Fig. 20).