Oil prices stabilized today, so stock prices rose. We expected a pullback in the S&P 500 in early 2026. The S&P 500 fell 2.3% from its record high of 6987.60 on January 27 through Wednesday's close. It was up 0.77% today. Is the pullback over? If so, that's quite remarkable, suggesting investors believe Iran has lost the war and that oil will be flowing through the Strait of Hormuz very soon.
As of today, March 4, 2026, the data confirms that shipping traffic through the Strait of Hormuz has essentially collapsed. While the waterway is not actually closed, the threat of military action has created a de facto blockade. Iranian officials have stated they will "set ablaze" any ship attempting to cross the Strait, claiming total control of the passage. President Donald Trump offered to provide maritime insurance and US naval escorts yesterday.
While the situation remains dicey over there, over here it feels like home on the range, where seldom is heard a discouraging word about the latest economic indicators. Consider the following:
(1) Purchasing managers' survey of business activity
The manufacturing PMI stabilized at 52.4 in February (down from 52.6 in January). The PMI survey suggests that factory activity is finally improving. That message aligns with the latest Fed Beige Book, which reported today that manufacturers in eight of the Fed's twelve districts reported increases in new orders, and employment levels were generally stable. (See our new AI tool, Beige Book Monitor.)
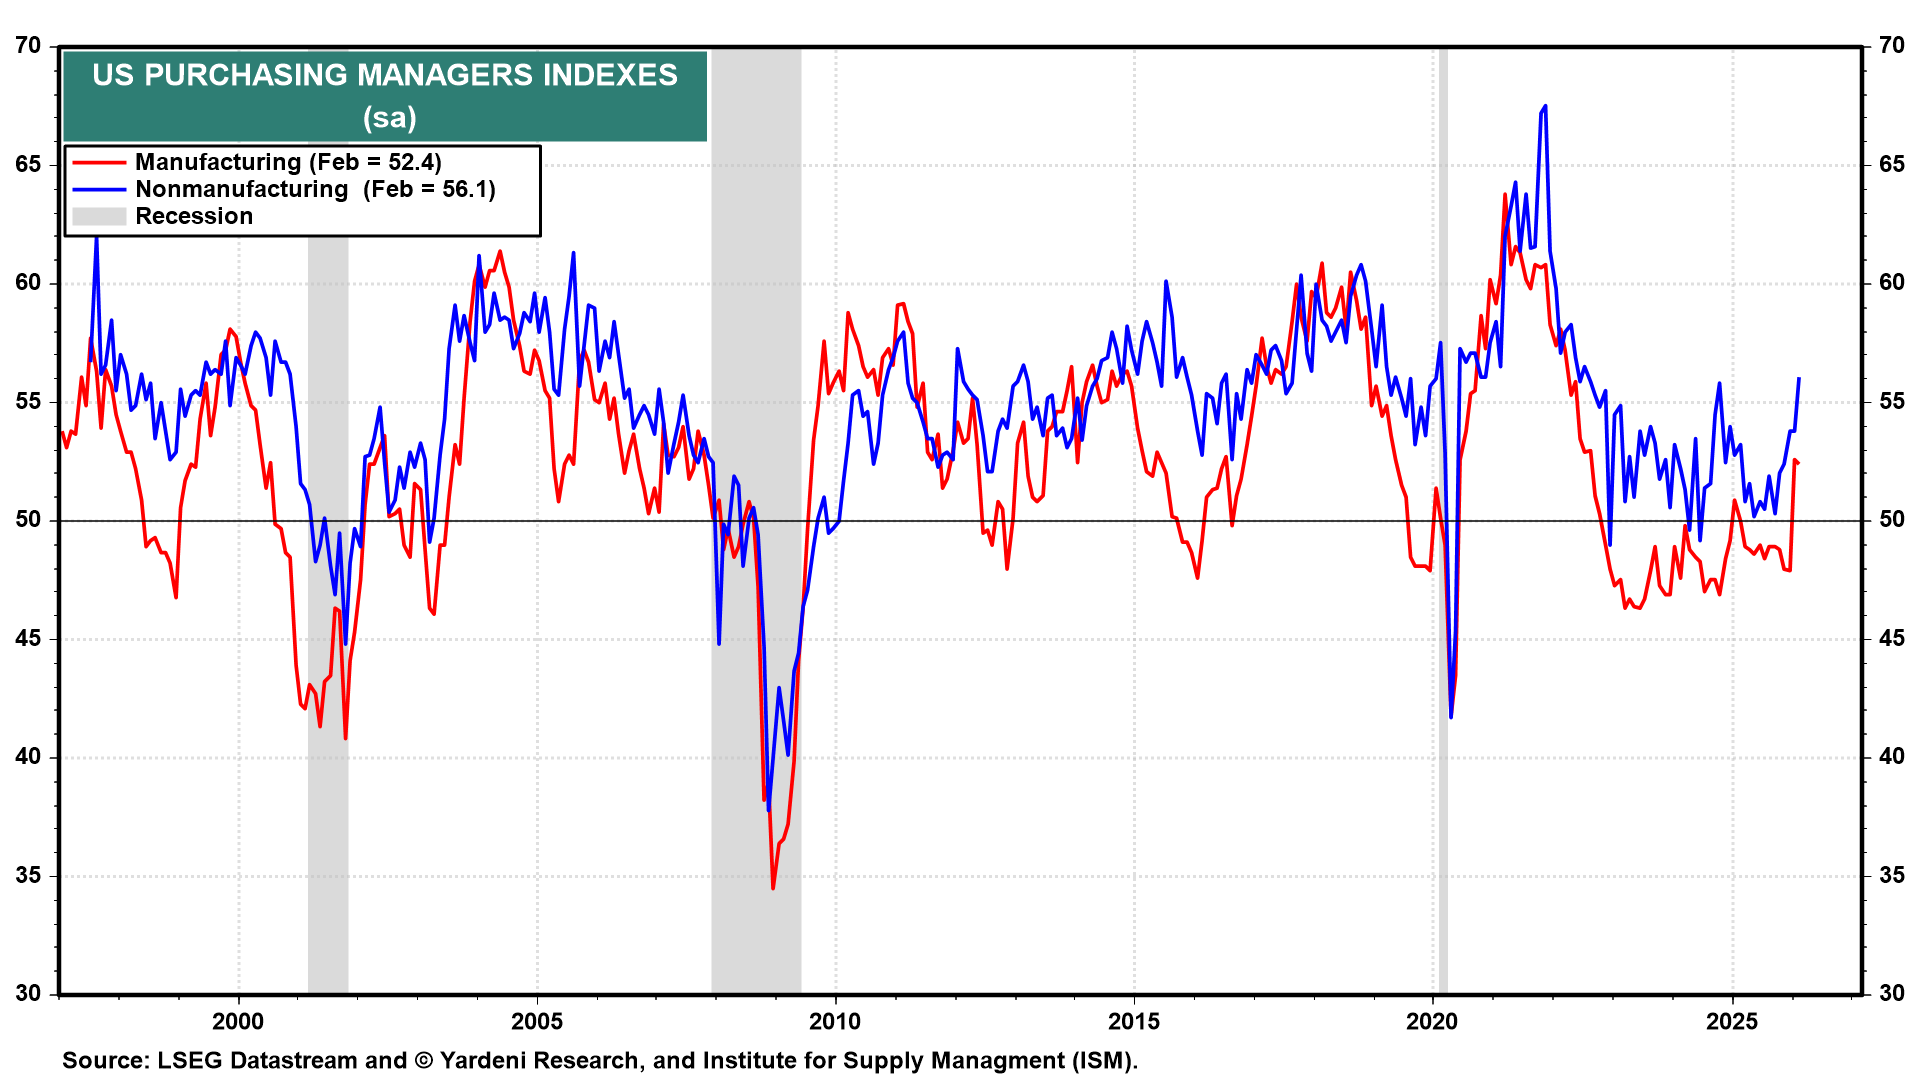
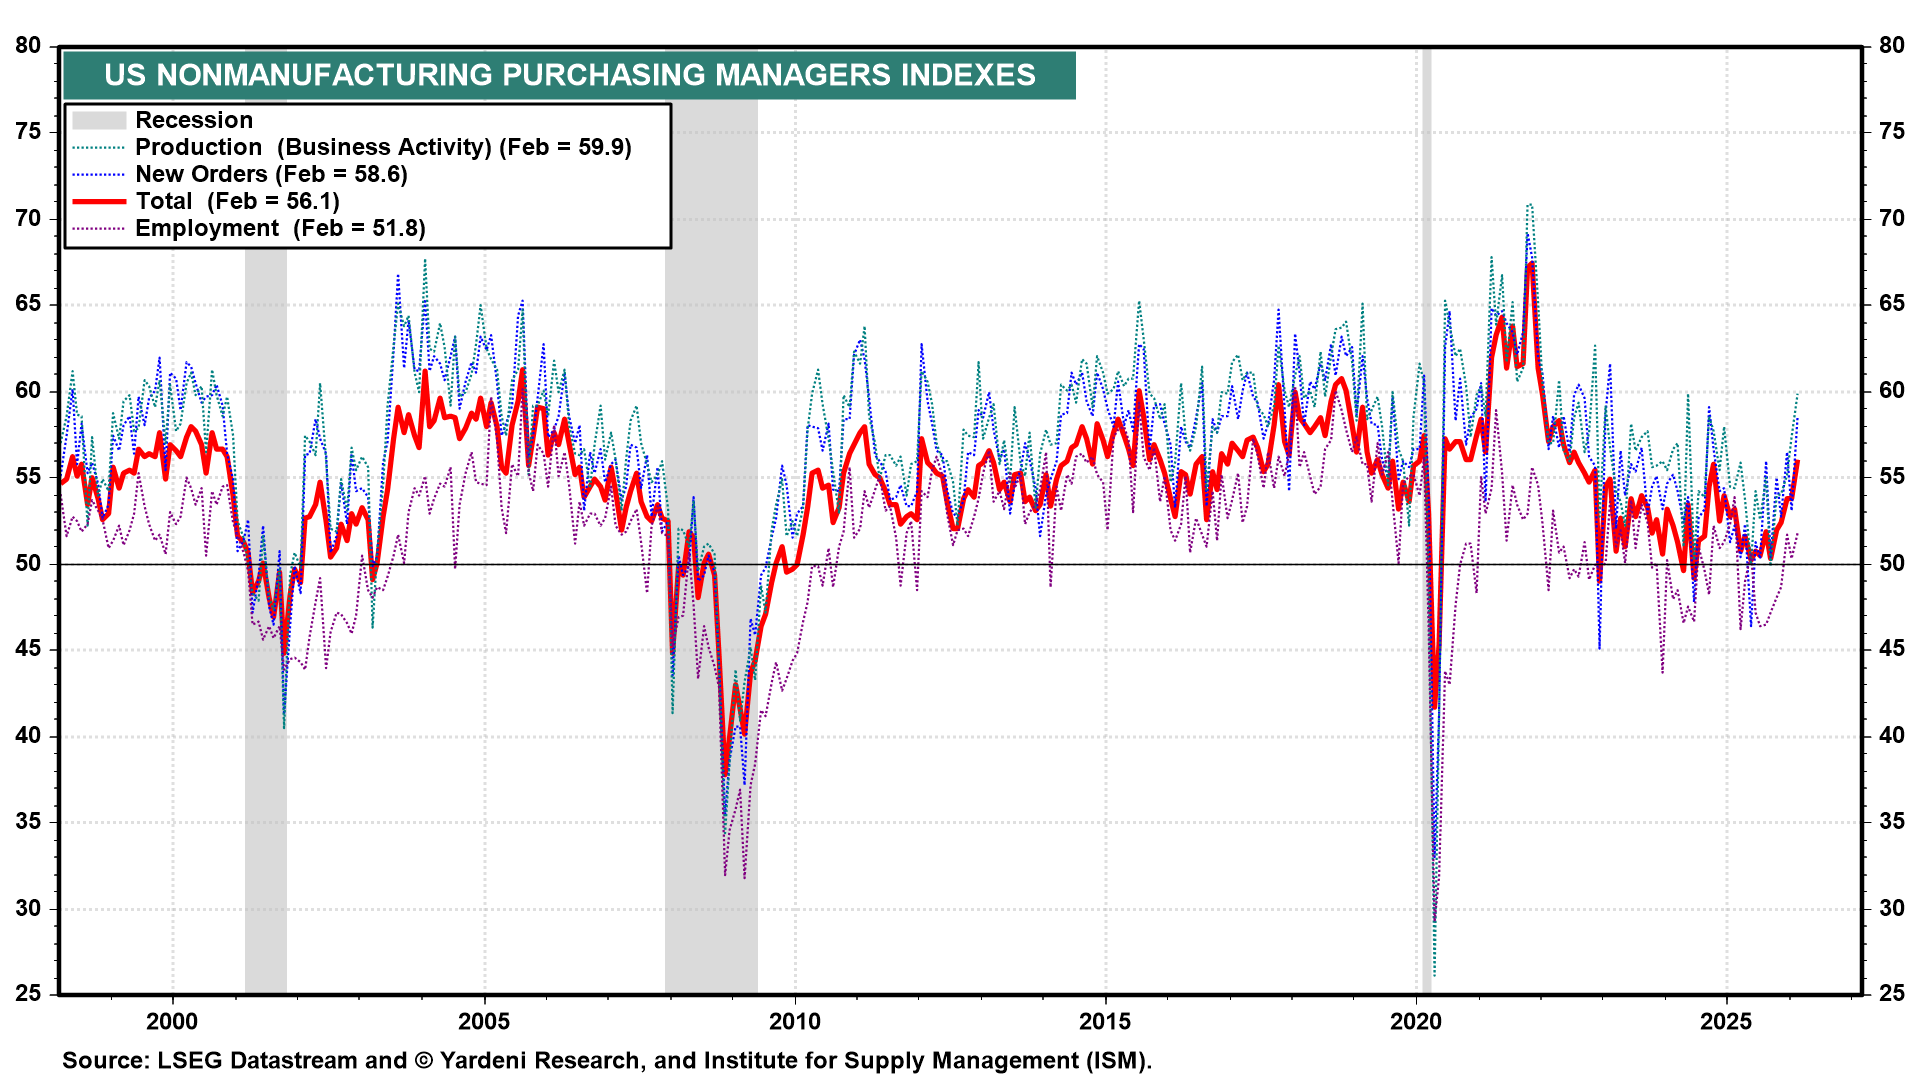
The services sector continues to lead the economy. The non-manufacturing PMI registered a very solid 56.1 in February (chart), with production and new orders the highest since 2024. Given that services account for the majority of US economic output, the strength of the index suggests the broader economy remains resilient despite pockets of uncertainty reported in the Beige Book, including more price-sensitive consumers and some pullback in lower-income spending.
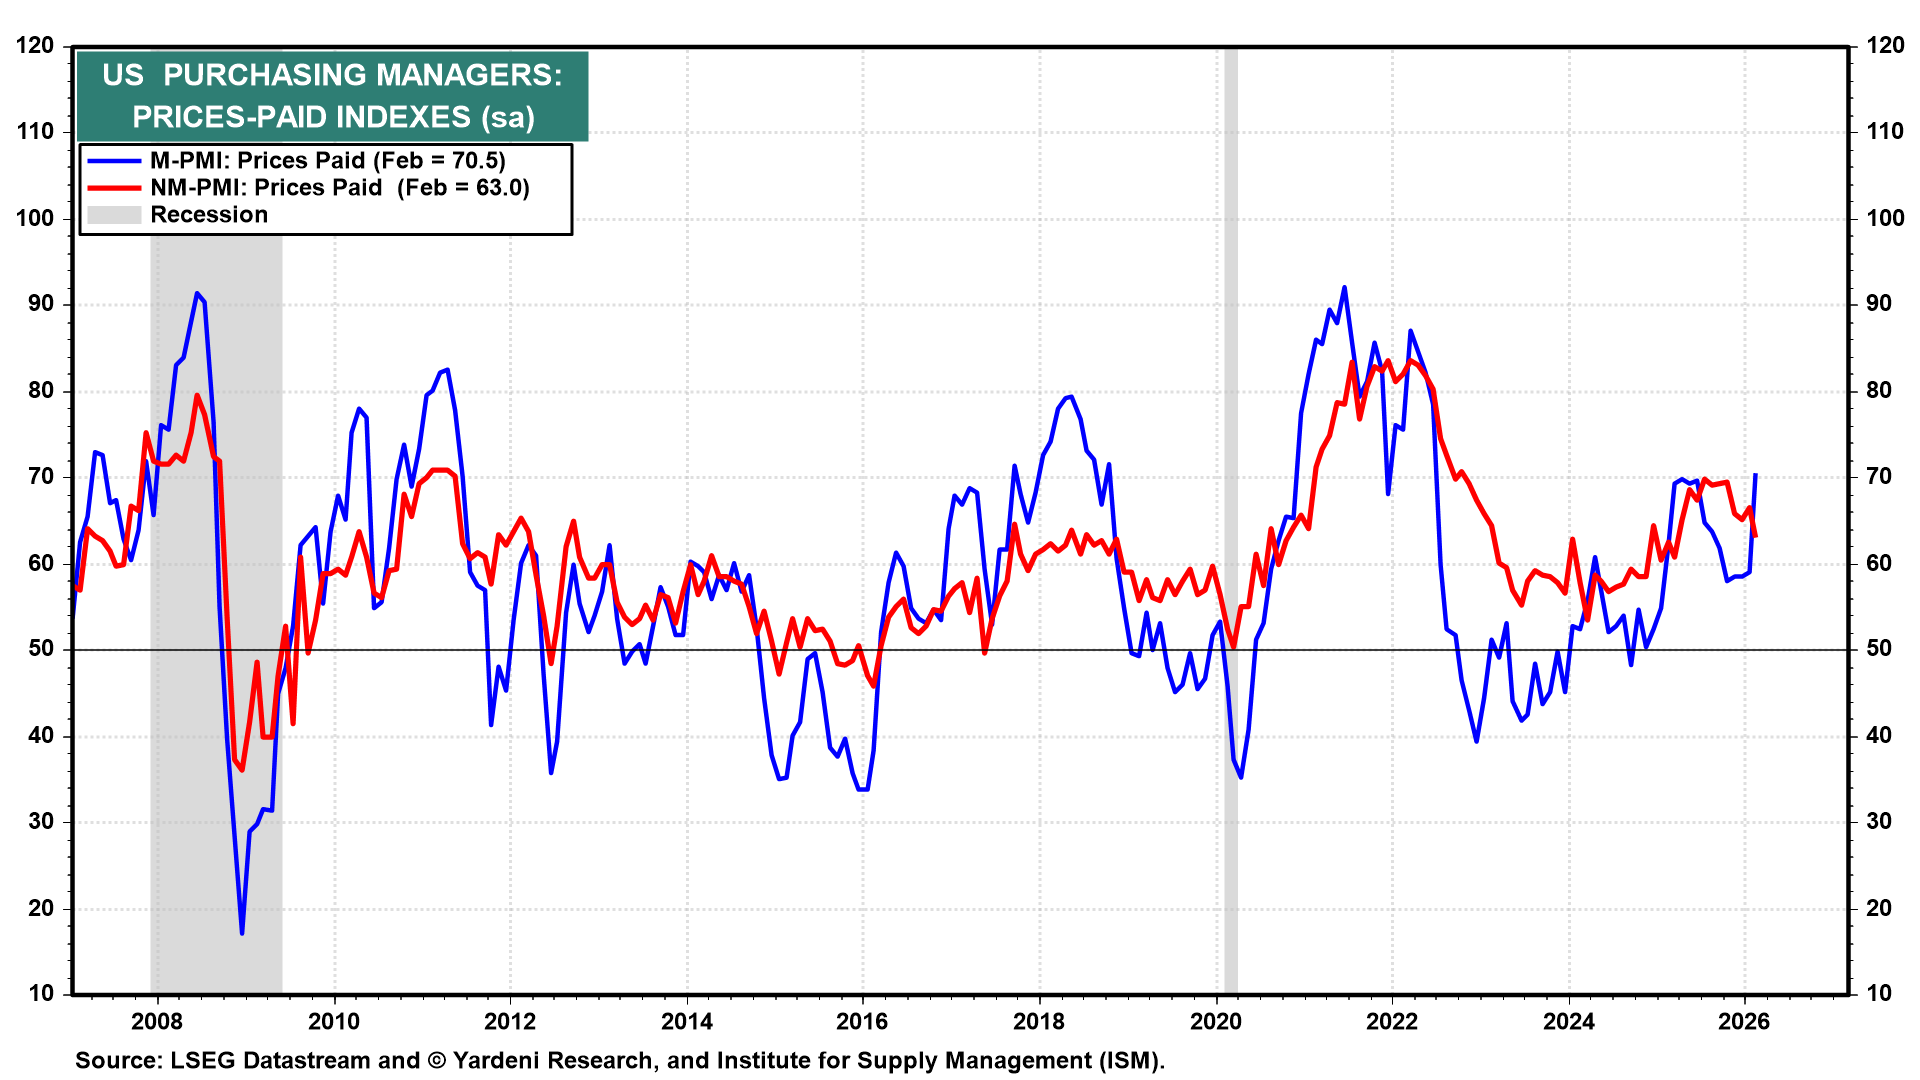
(2) Purchasing managers' survey of prices
Inflation pressures picked up in manufacturing during February, according to the manufacturing prices-paid index, which rose sharply to 70.5 (chart). That's up from 59.0 in January and the highest level since June 2022, reflecting rising input costs for materials such as aluminum and steel. Meanwhile, the non-manufacturing prices-paid index eased to 63.0 (chart). That's consistent with the Beige Book's observation that firms expect prices to rise at a somewhat slower pace in the near term. Even so, both price-paid indices remain well below the extreme levels reached during the pandemic.
(3) ADP employment
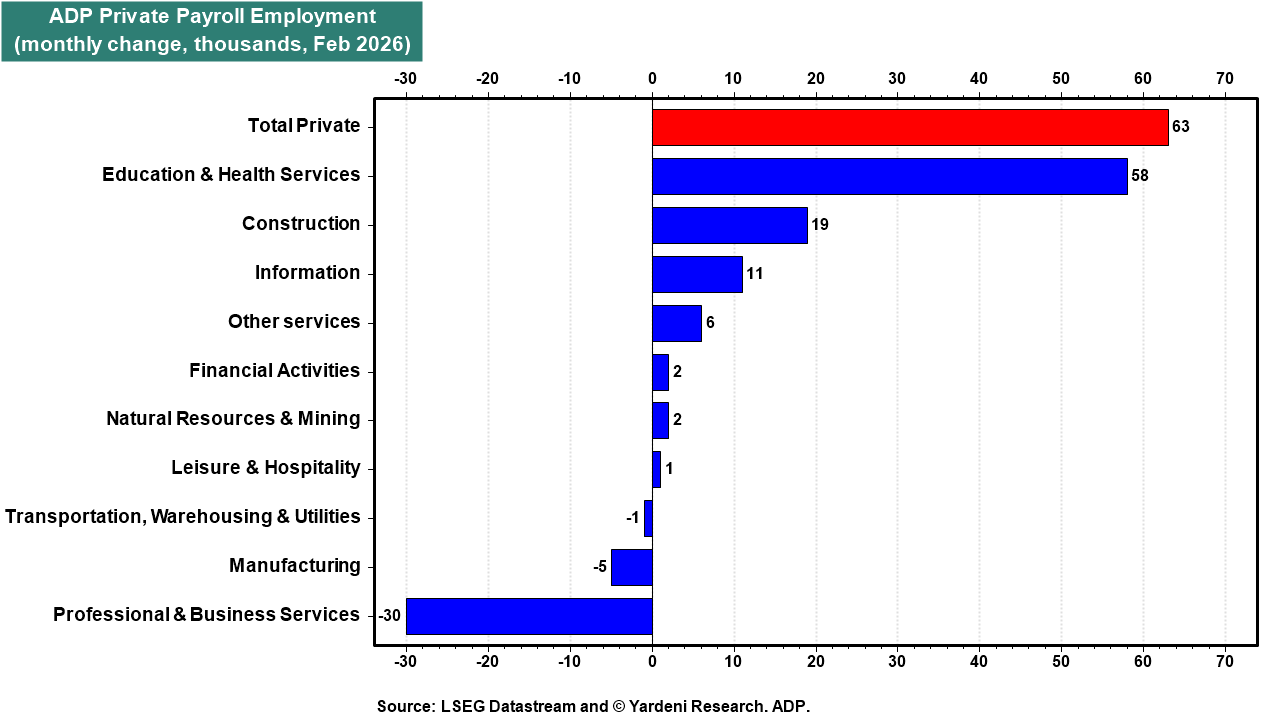
February's ADP report showed that private payrolls increased by 63,000, beating expectations (chart). Hiring strength was concentrated in services, particularly education and health services, which added 58,000 jobs. Construction employment continues to pick up, reflecting the data center buildout, while manufacturing employment declined modestly. Professional & business services payrolls fell by 30,000. Job growth was driven primarily by small businesses, which added 60,000 jobs.
(4) Bank loans
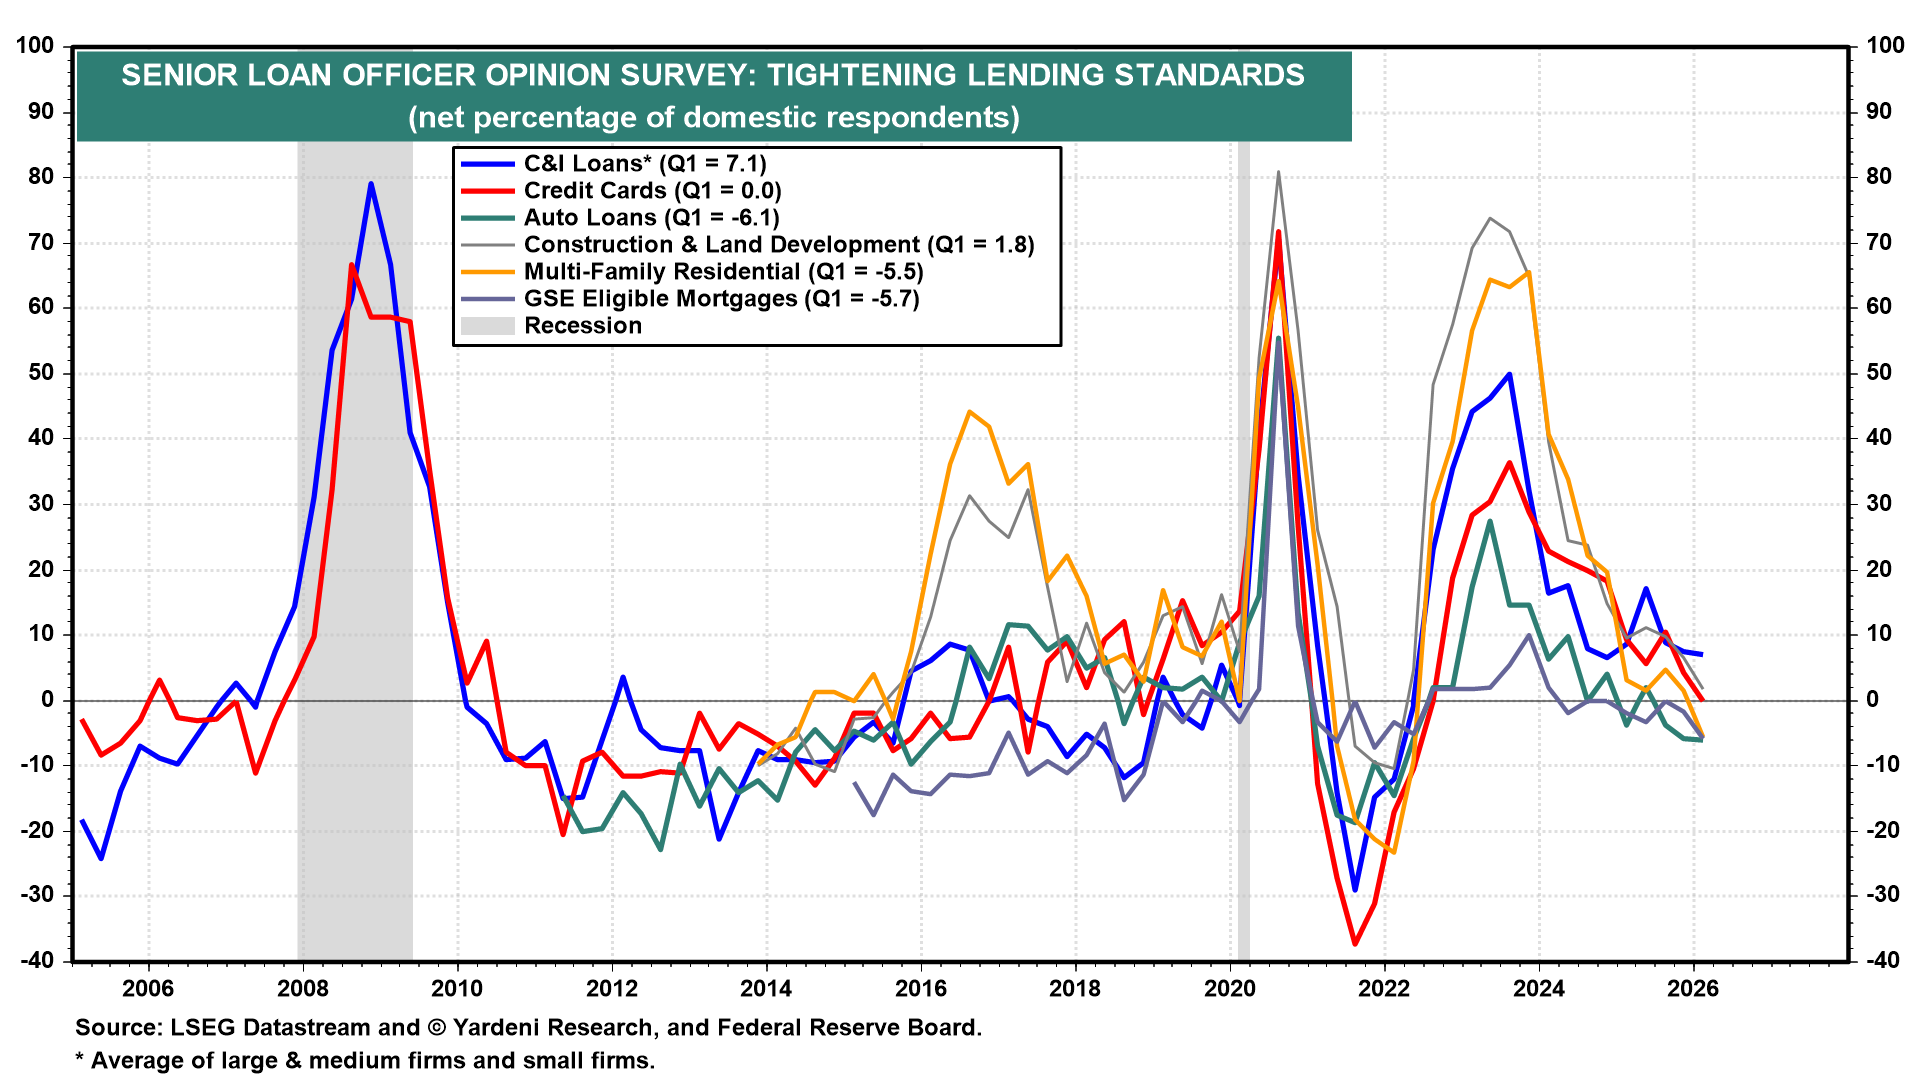
The Fed's latest senior loan officer opinion survey shows that the severe tightening in lending standards during 2022–23 has eased across all major loan categories (chart).
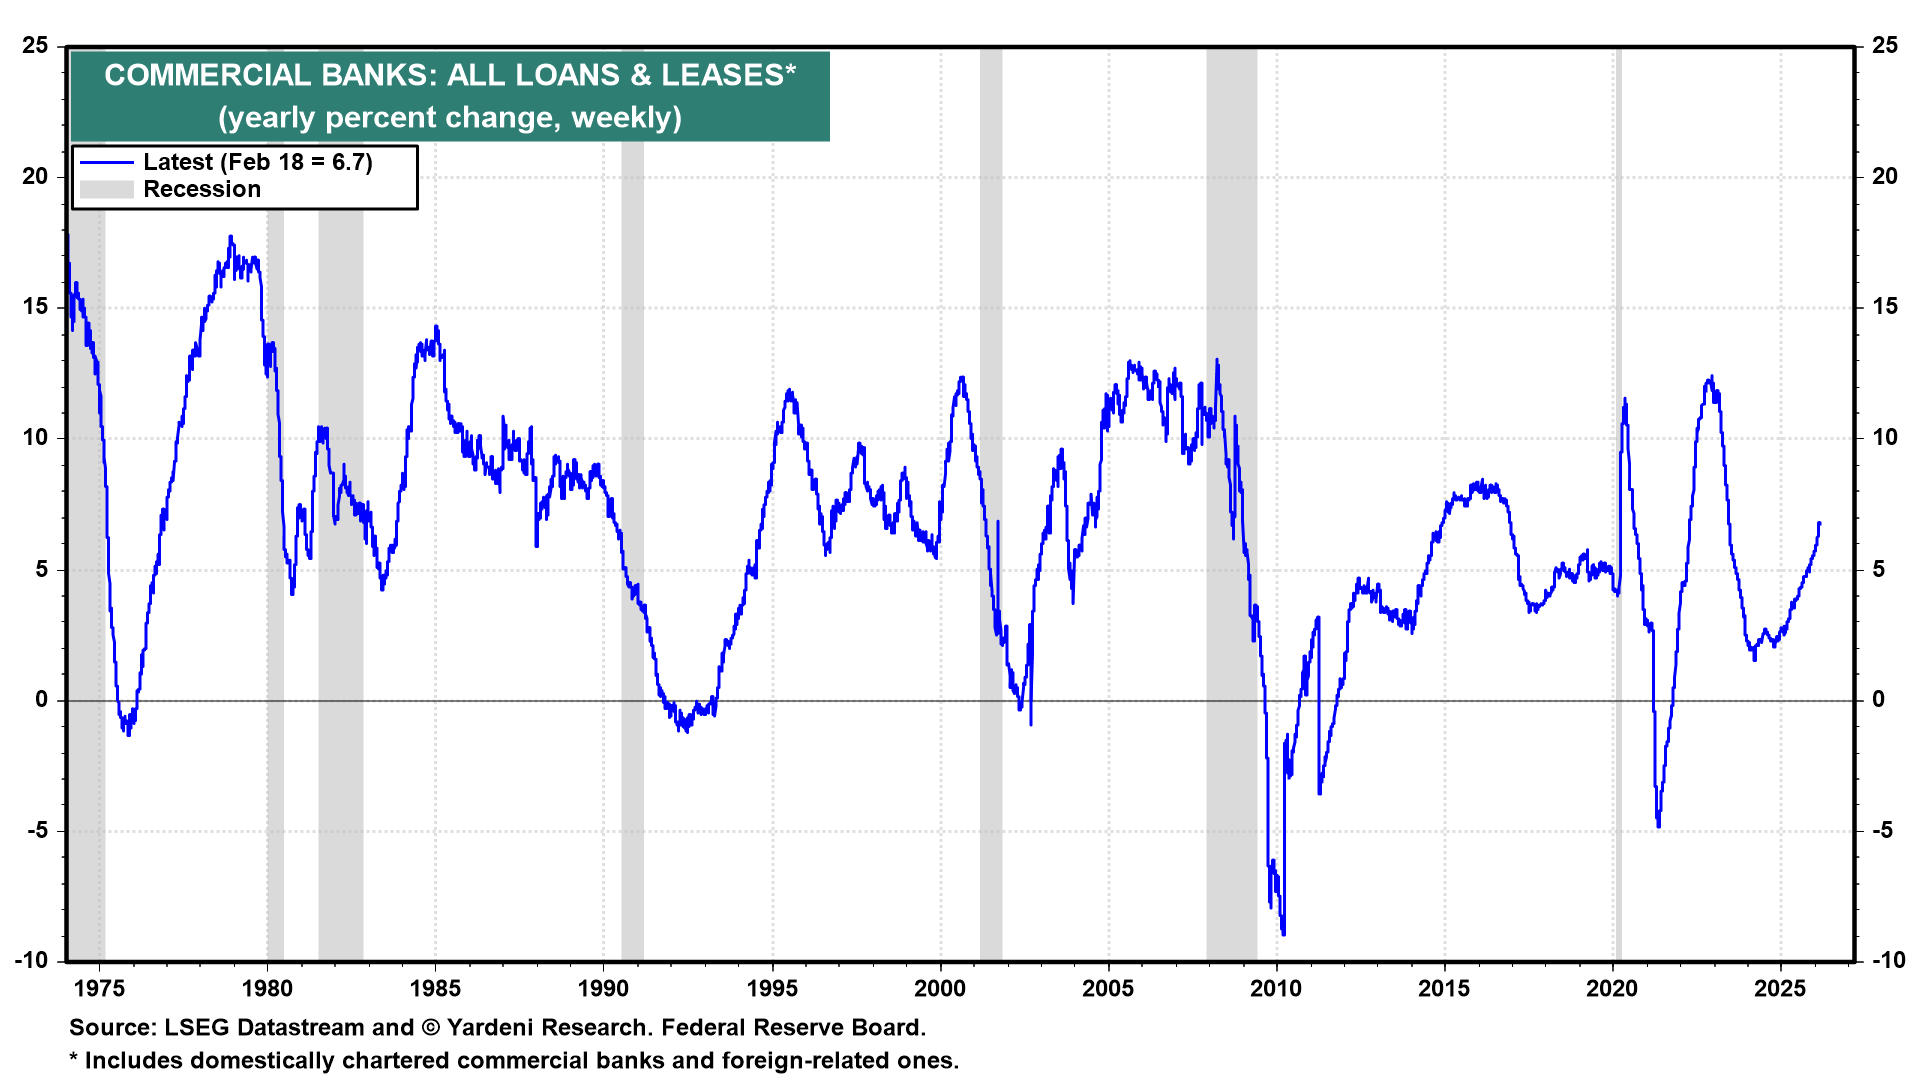
Bank lending continues to expand, with commercial banks' loans and leases rising 6.7% y/y (chart). This suggests traditional banks are expanding their lending despite concerns about stress in the private credit markets.
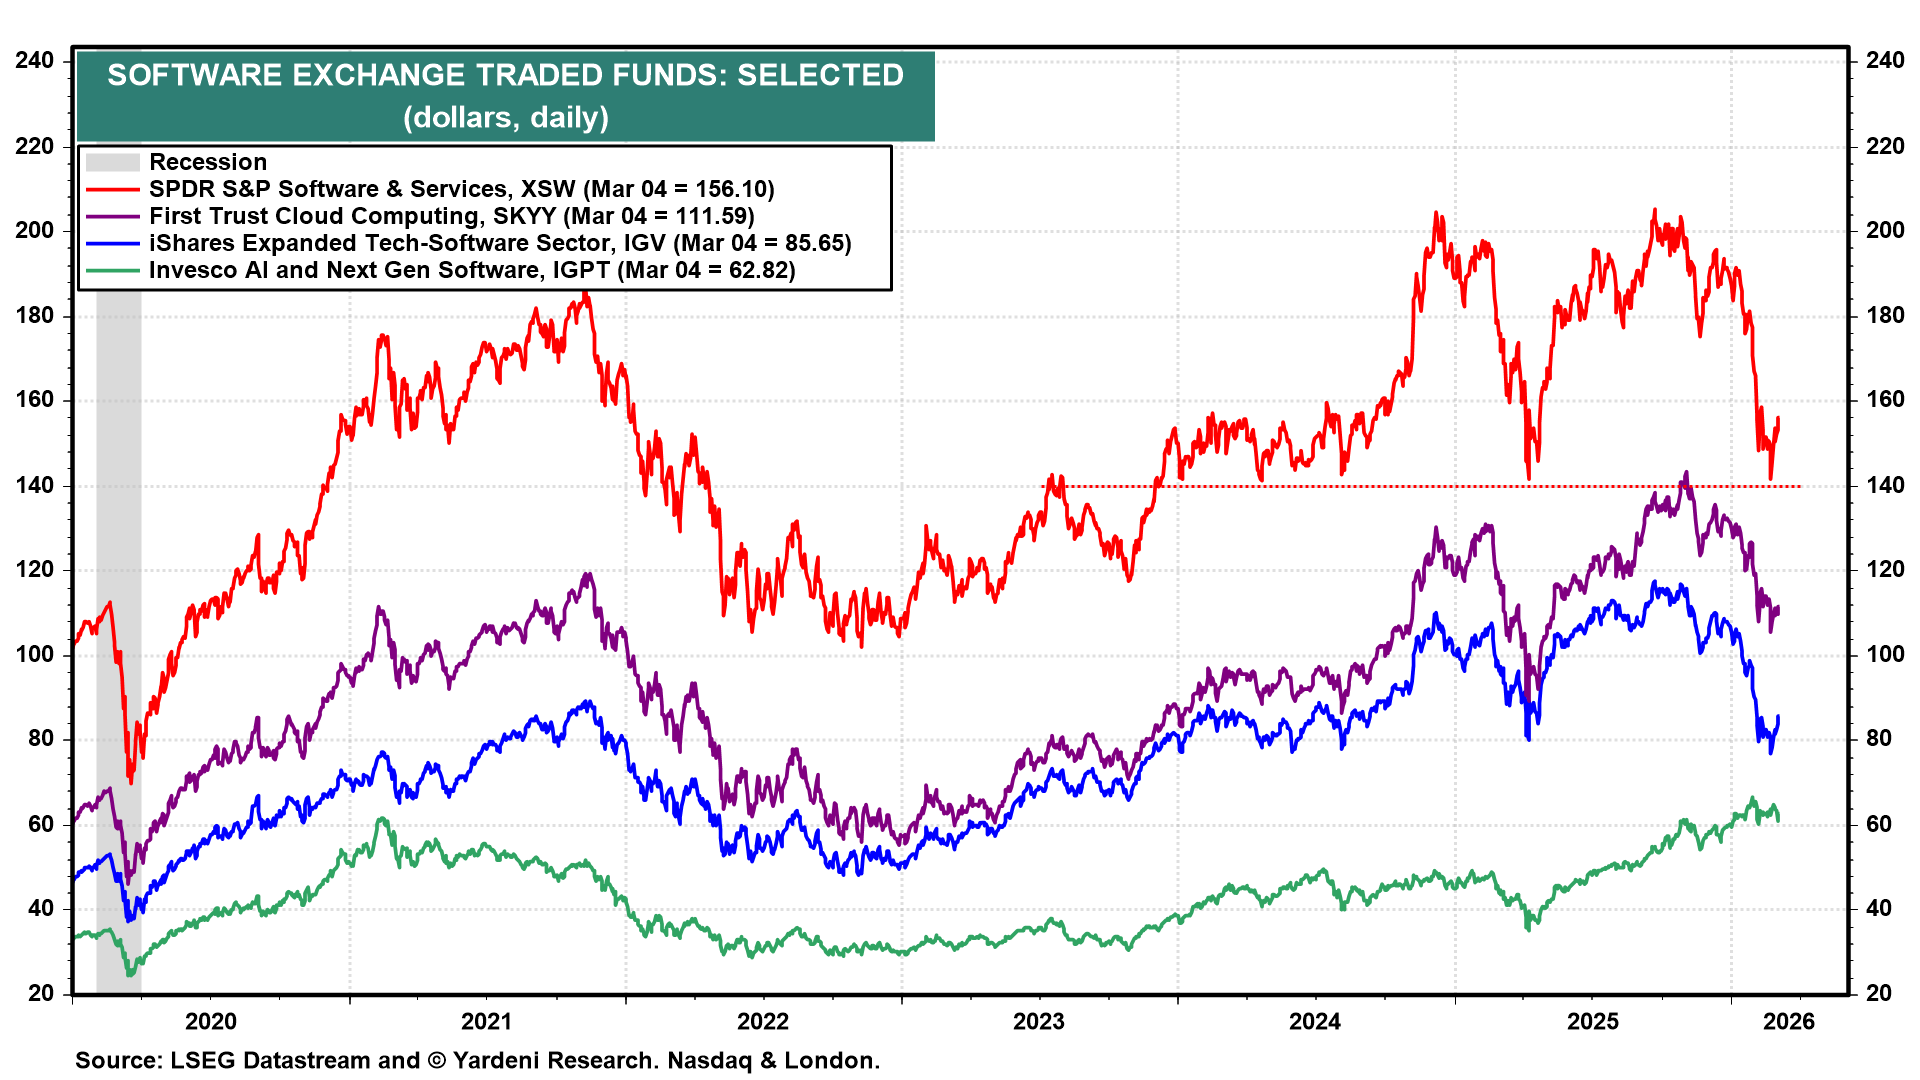
(5) Software stock prices
Recently, equity investors have been concerned that AI coding could disrupt the software industry. However, software ETFs appear to have found technical support during the latest bout of market volatility (chart). Despite the broader market's selloff on geopolitical fears, several major software ETFs stabilized and bounced yesterday and today, suggesting investors are done rerating the software stocks and regaining some confidence in their longevity.