


I. The Fed's Stock Valuation Model
In his famous December 5, 1996 speech, Fed Chair Alan Greenspan asked, "How can we judge whether stocks are overvalued or undervalued?" His staff apparently scrambled to examine various stock valuation models to help him gauge the market’s exuberance. One such model was made public, albeit buried in the Fed’s Monetary Policy Report to Congress that accompanied Greenspan’s congressional testimony on July 22, 1997. I dubbed it "The Fed's Stock Valuation Model" (FSVM). The name stuck, though Fed officials never publicly endorsed it.
The model quite simply compares the S&P 500 forward earnings yield to the 10-year US Treasury bond yield (chart). The forward earnings yield is the reciprocal of the forward P/E.
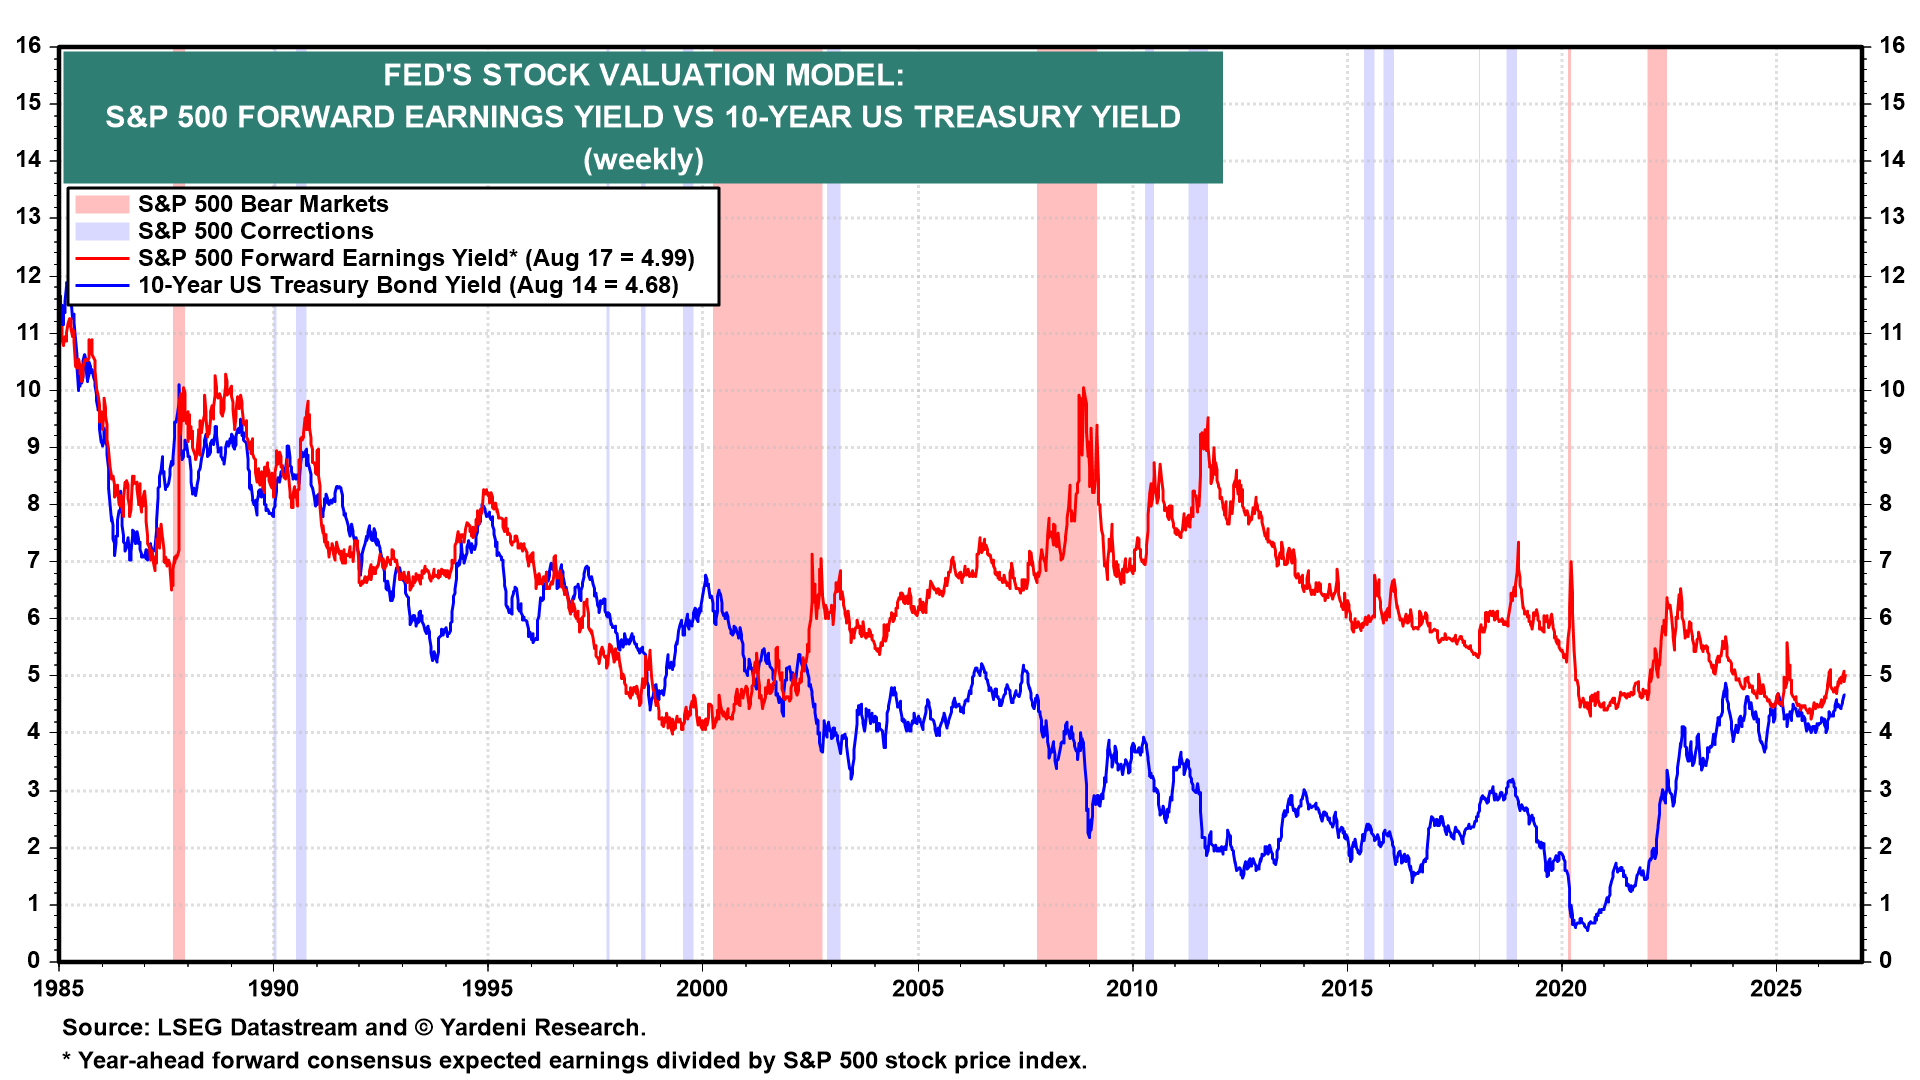
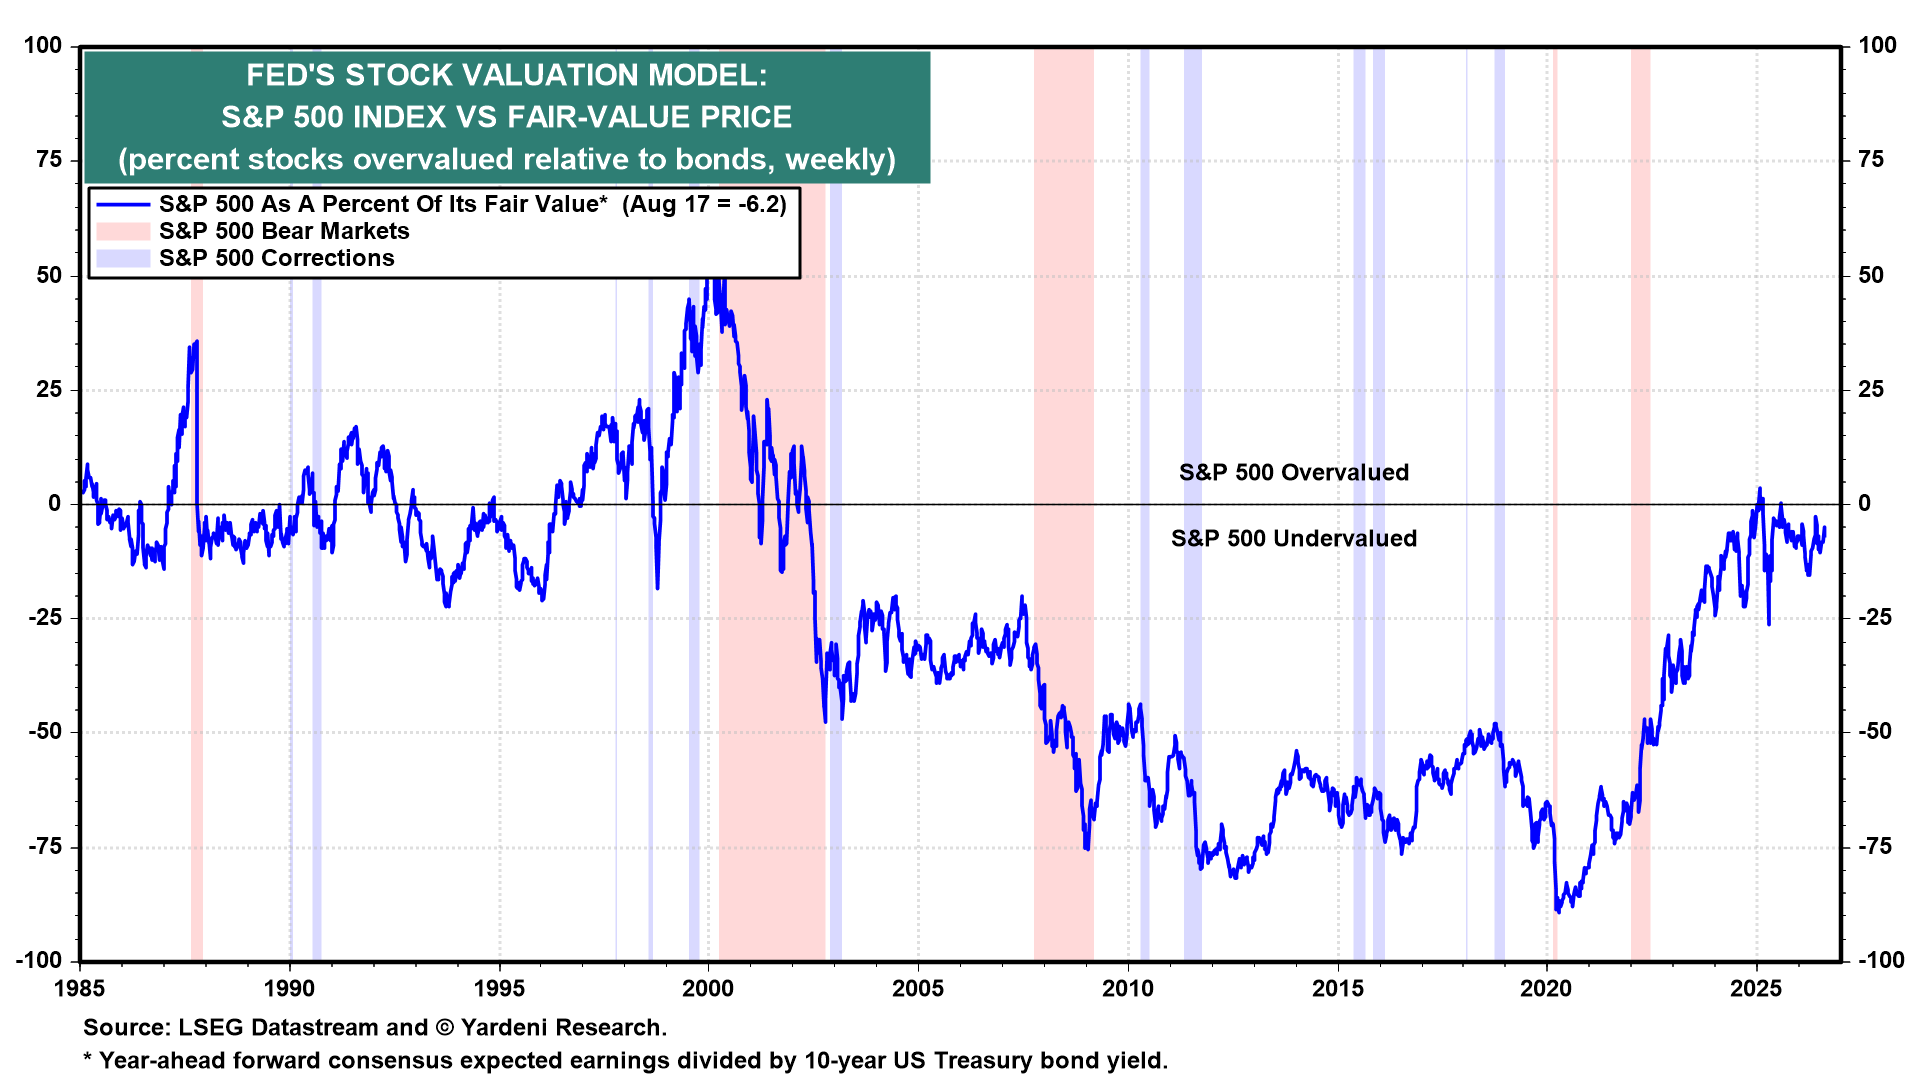
When the forward earnings yield is above (below) the bond yield, the S&P 500 is deemed to be undervalued (overvalued) (chart). The FSVM worked well during the 1980s and 1990s. Then it stopped working because it always showed that stocks were undervalued relative to bonds. That was a good long-term call, but it didn't work as a market-timing tool and missed the bear market during the Great Financial Crisis (GFC).
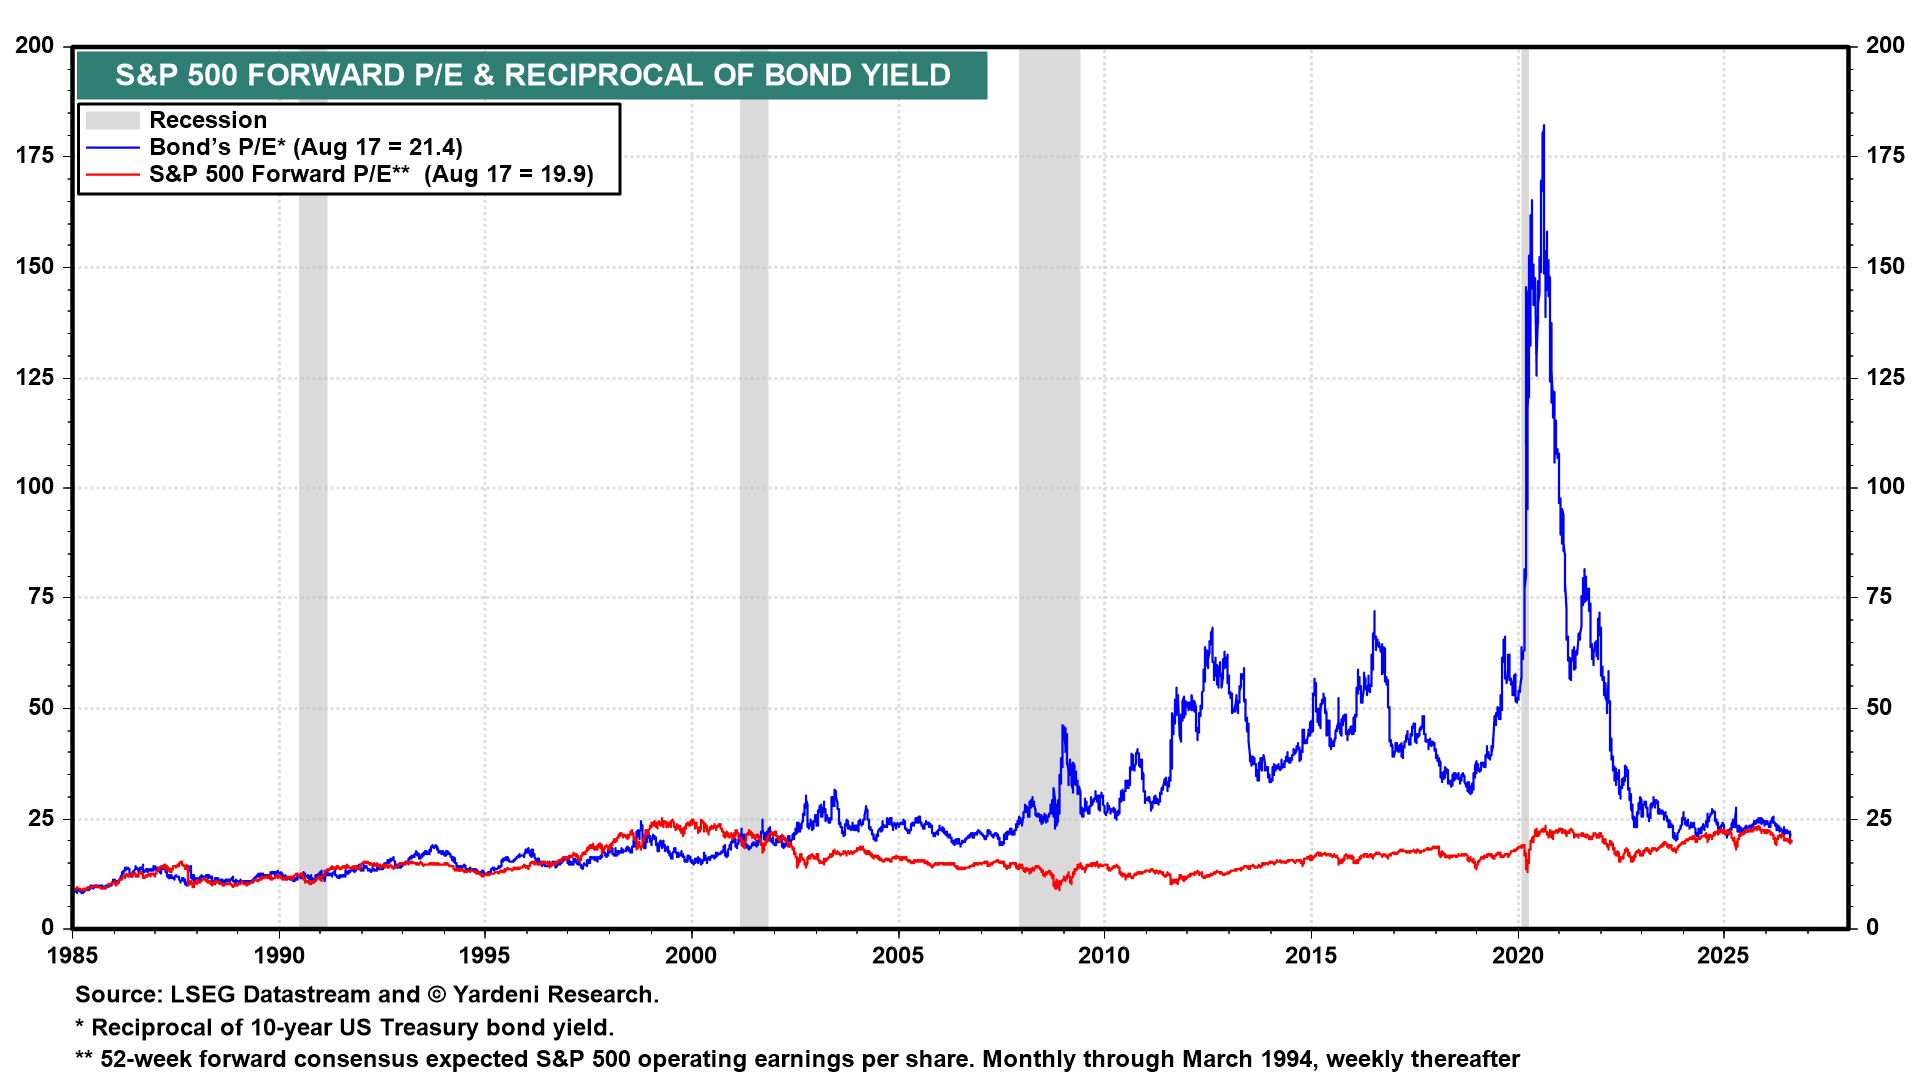
The FSVM may be starting to work again now that the bond market is no longer rigged by the Fed with quantitative easing programs designed to keep the 10-year bond yield close to zero. As a result, the spread between the reciprocal of the bond yield (currently at 21.4) and the S&P 500's forward P/E (currently at 19.9) has narrowed dramatically (chart).
Interestingly, despite the recent rise of the 10-year Treasury bond yield, the S&P 500 remains slightly undervalued. If the yield rises to 5.00%, the "fair-value" P/E would be 20.0 (i.e., the reciprocal of the bond yield). That’s roughly where it is now.
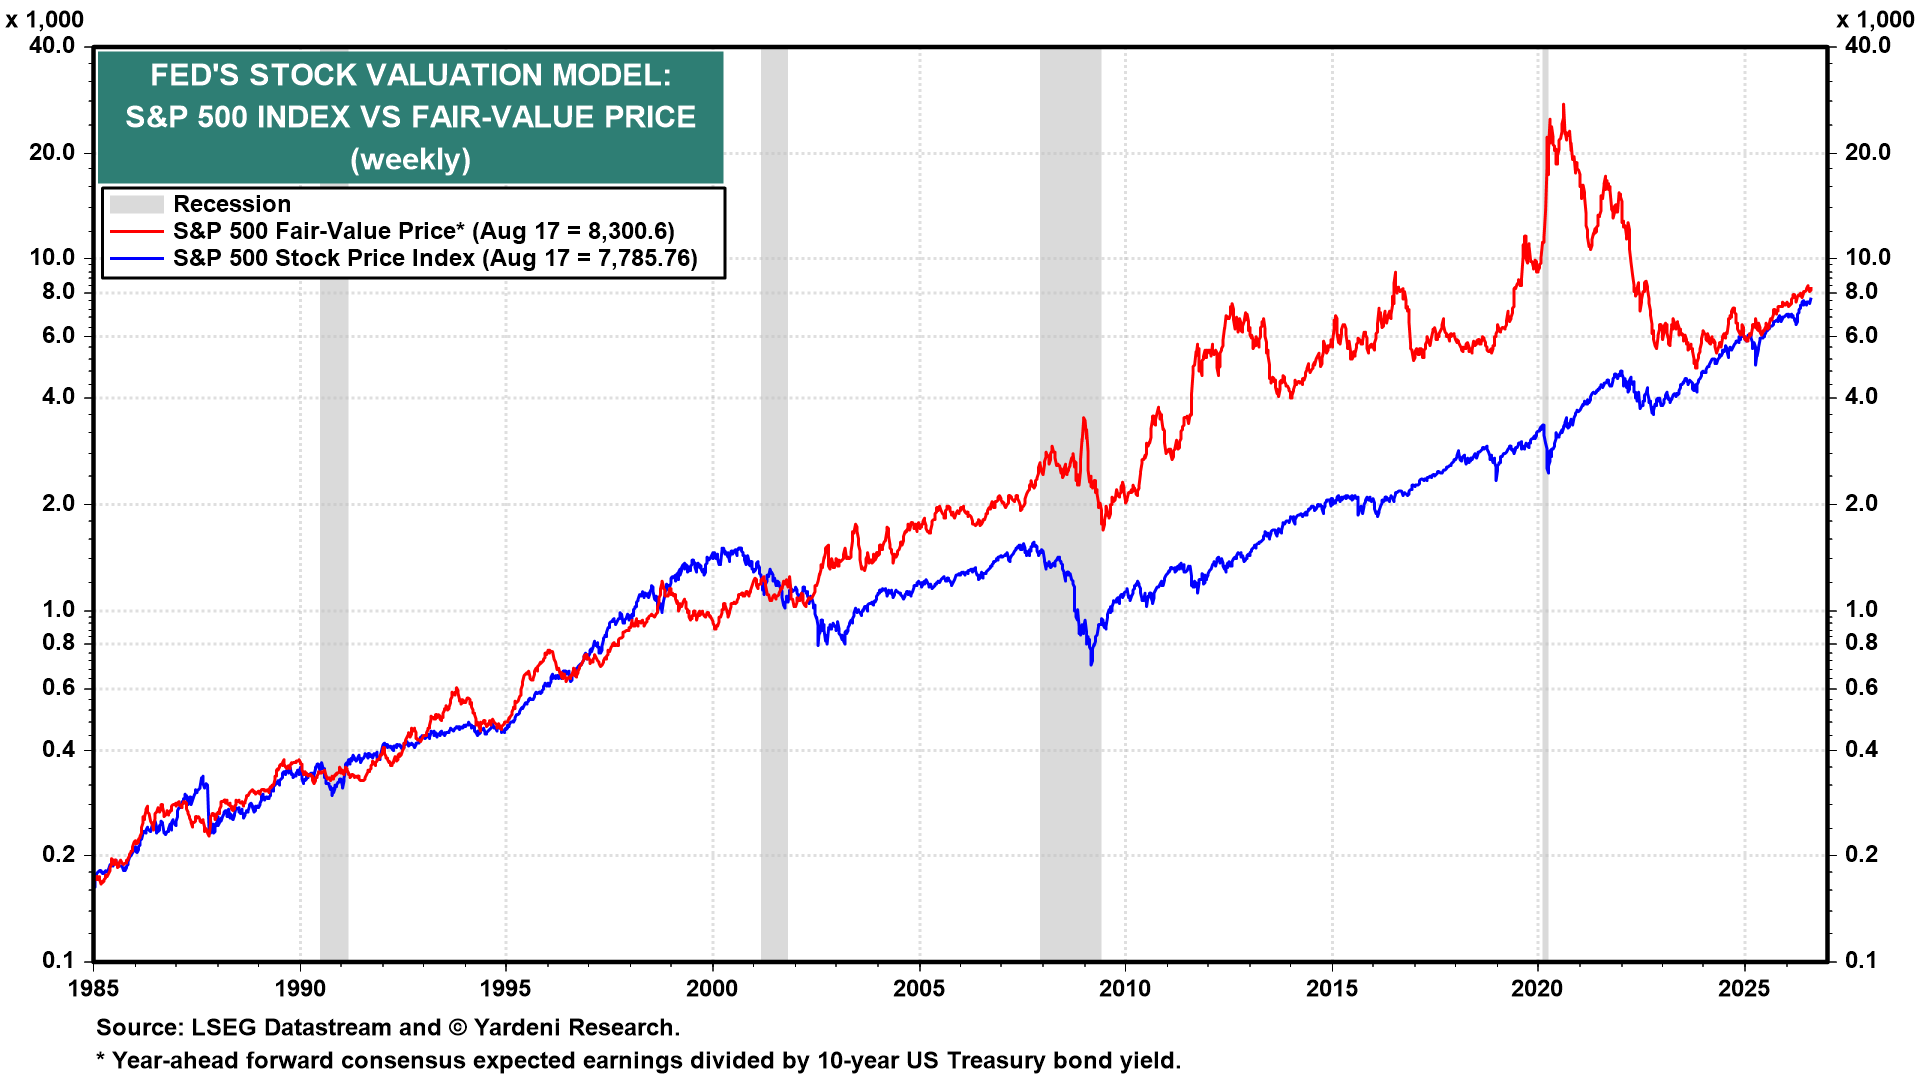
With the bond yield at 4.68% last week, the fair-value price of the S&P 500 was 8,300 (chart).
II. Bond Yield
