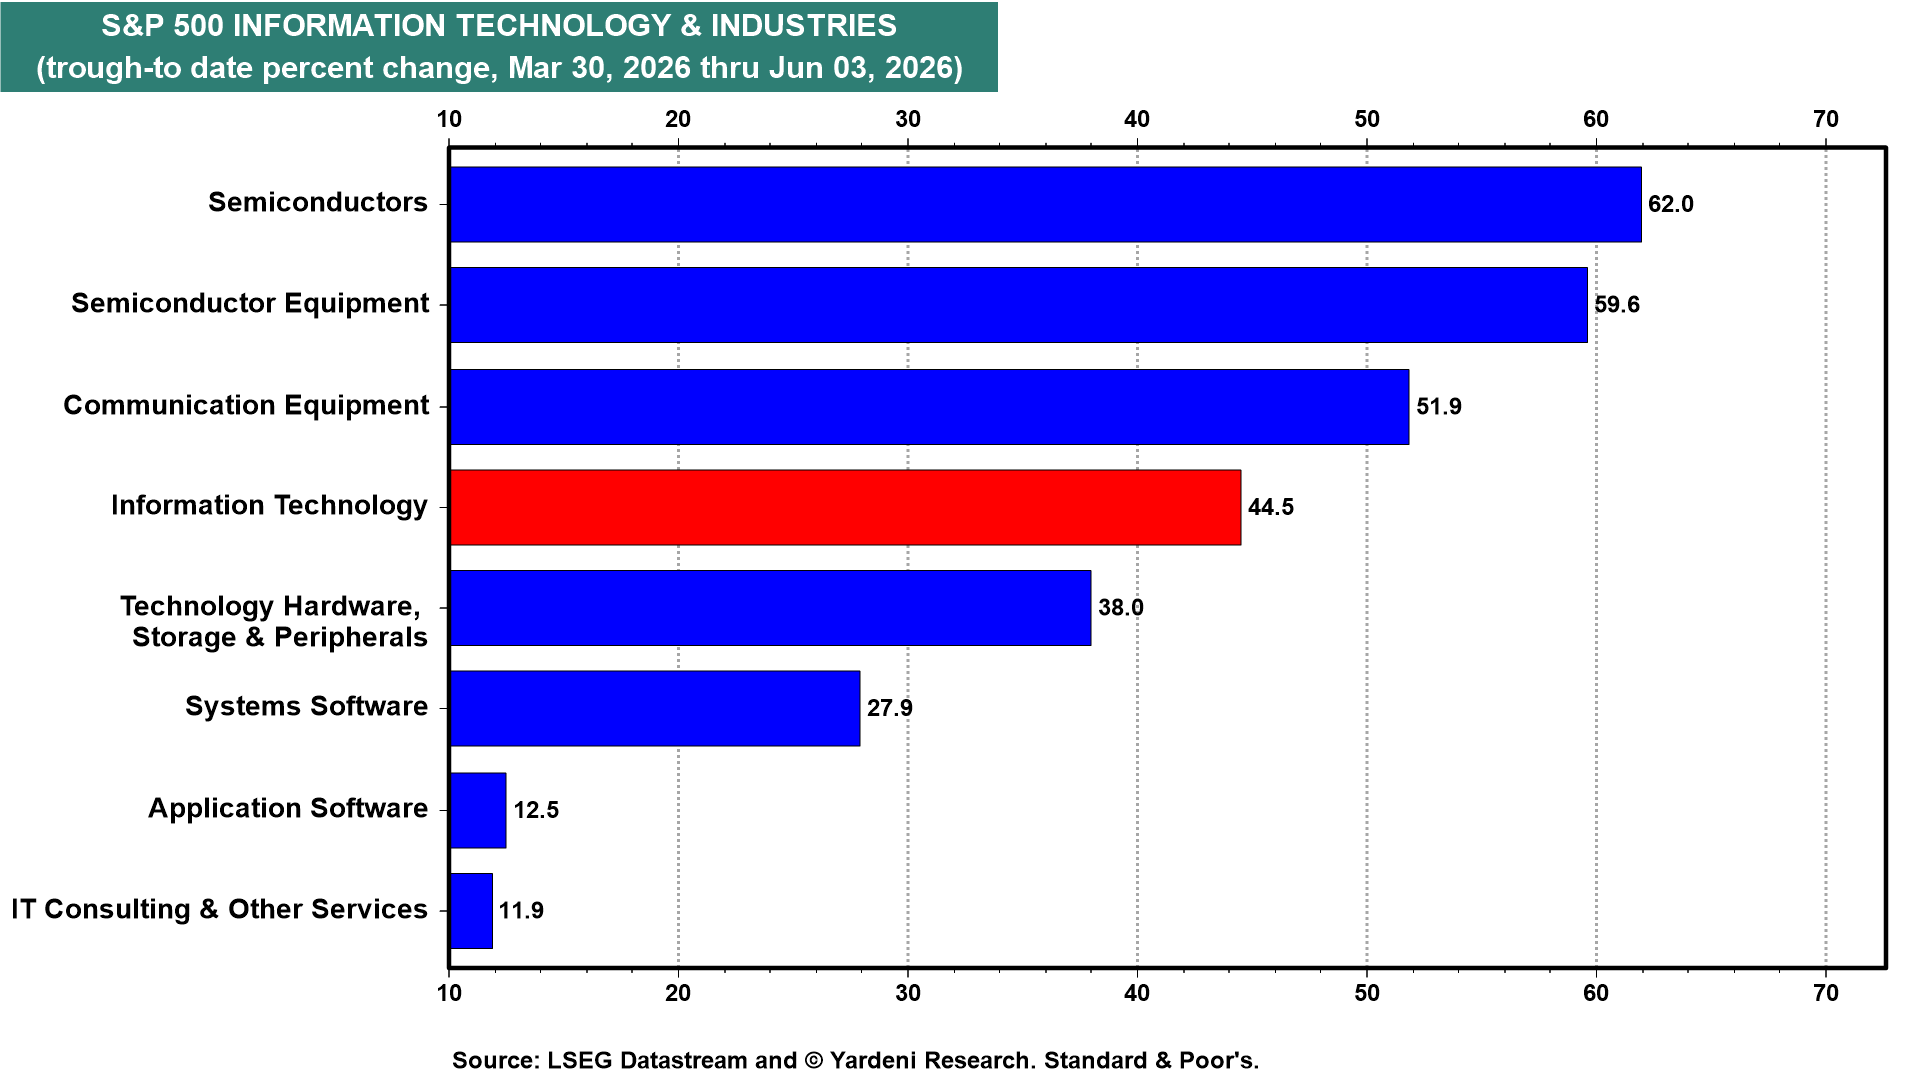
So far, the S&P 500 bottomed this year on March 30 in response to the latest Gulf War. Since then, Fabulous Earnings Momentum (FEMO) during the Q1 earnings reporting season fueled a remarkable 19.1% rally in the index, led by an amazing 44.5% increase in the S&P 500 Information Technology sector (chart).
Yesterday, we raised the caution flag, suggesting a possible pullback over the next few weeks. We are concerned about warnings from Exxon and Chevron executives that global crude oil inventories are so low that the crude oil price could spike to $150 a barrel unless the war ends very soon. We also expect the FOMC to pivot from an easing bias to a tightening bias at the committee's next meeting later this month. We then expect the FOMC to raise the federal funds rate by 25bps in July. The financial markets are also expecting a rate hike, but late this year. The SpaceX IPO should be a big hit because everyone knows Wall Street has bent the rules to ensure the stock price soars initially. However, that could cause lots of volatility if a price spike triggers a wave of profit-taking.
In any event, we view any pullback as a buying opportunity and maintain our 8250 target for the S&P 500 by year-end.
Might there be more FEMO ahead? Yes, but it might already be discounted by the market, making it vulnerable to even slight disappointments. A case in point is Broadcom's 13% after-hours sell-off today, when the company's solid earnings report was somewhat weaker than expected.
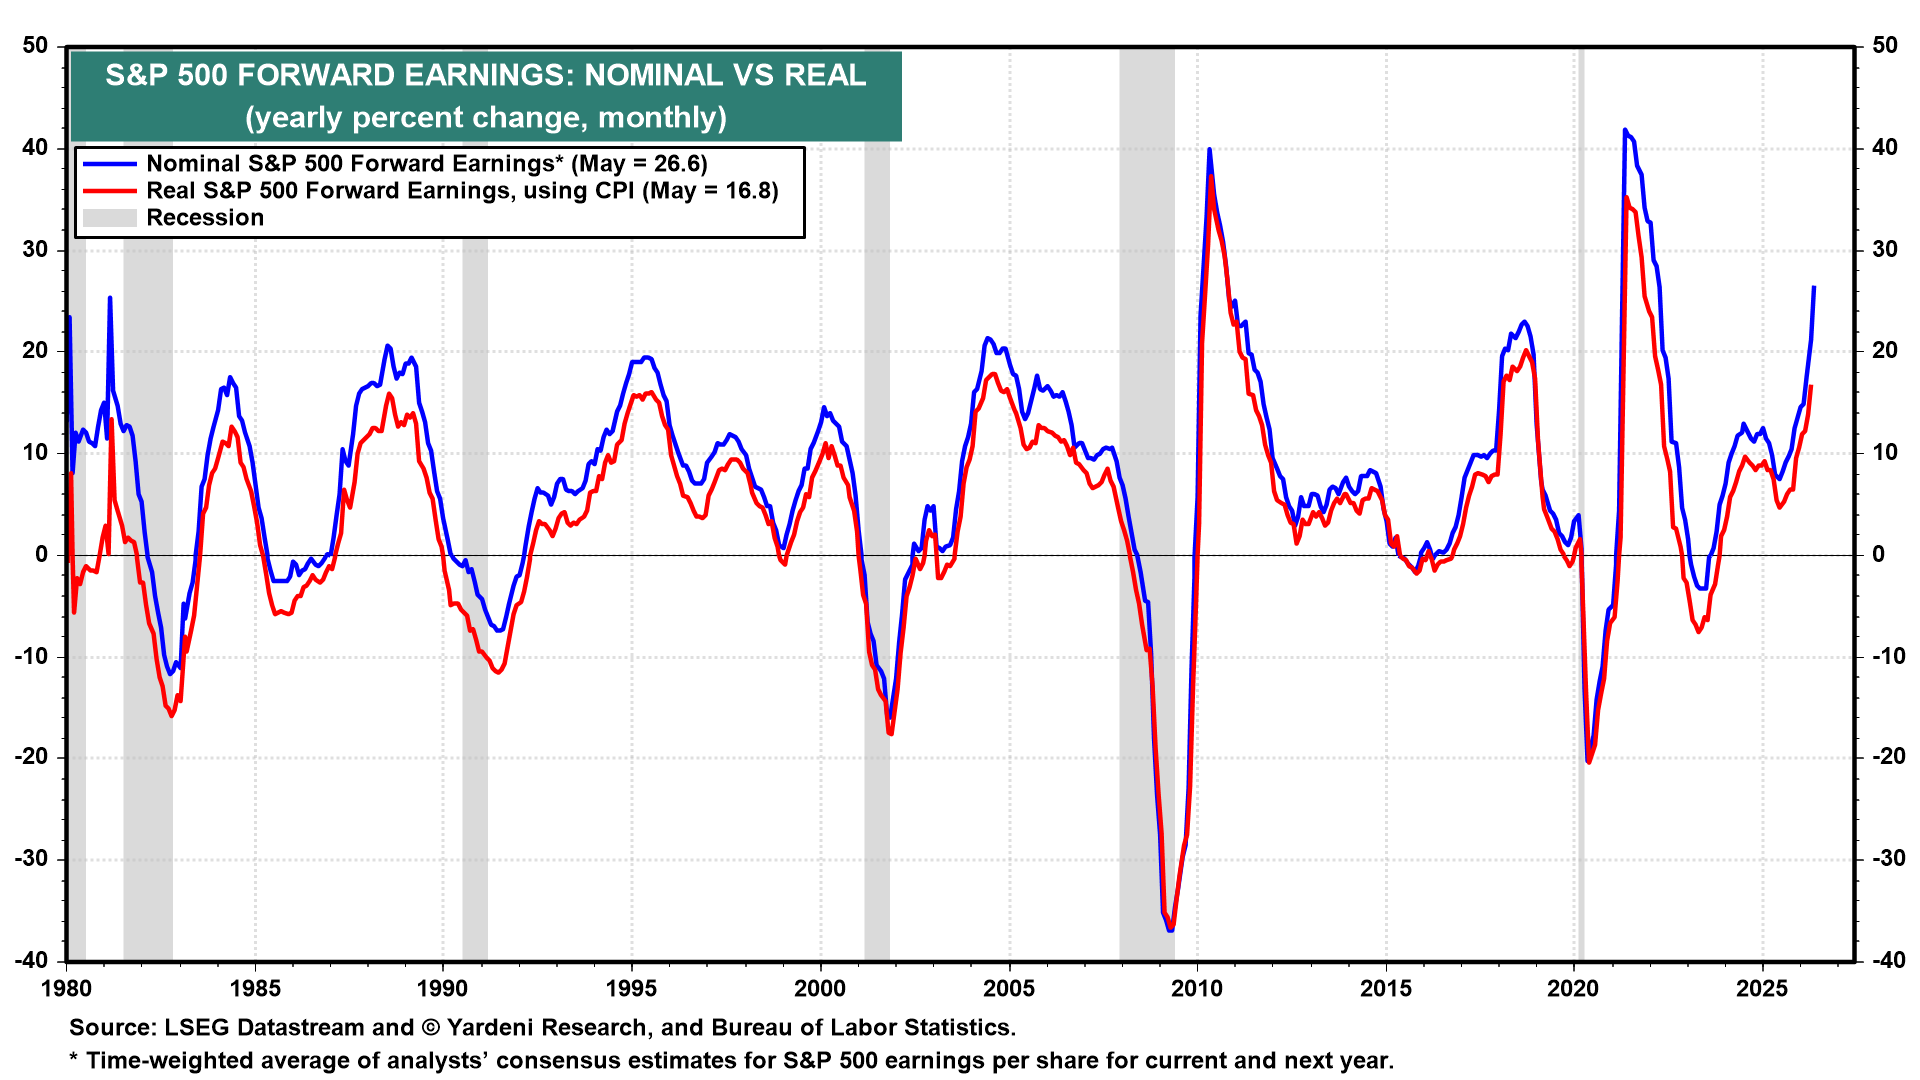
S&P 500 forward earnings is up 26.6% y/y through May. That's as good as FEMO gets historically, with the exception of post-recession recoveries (chart).
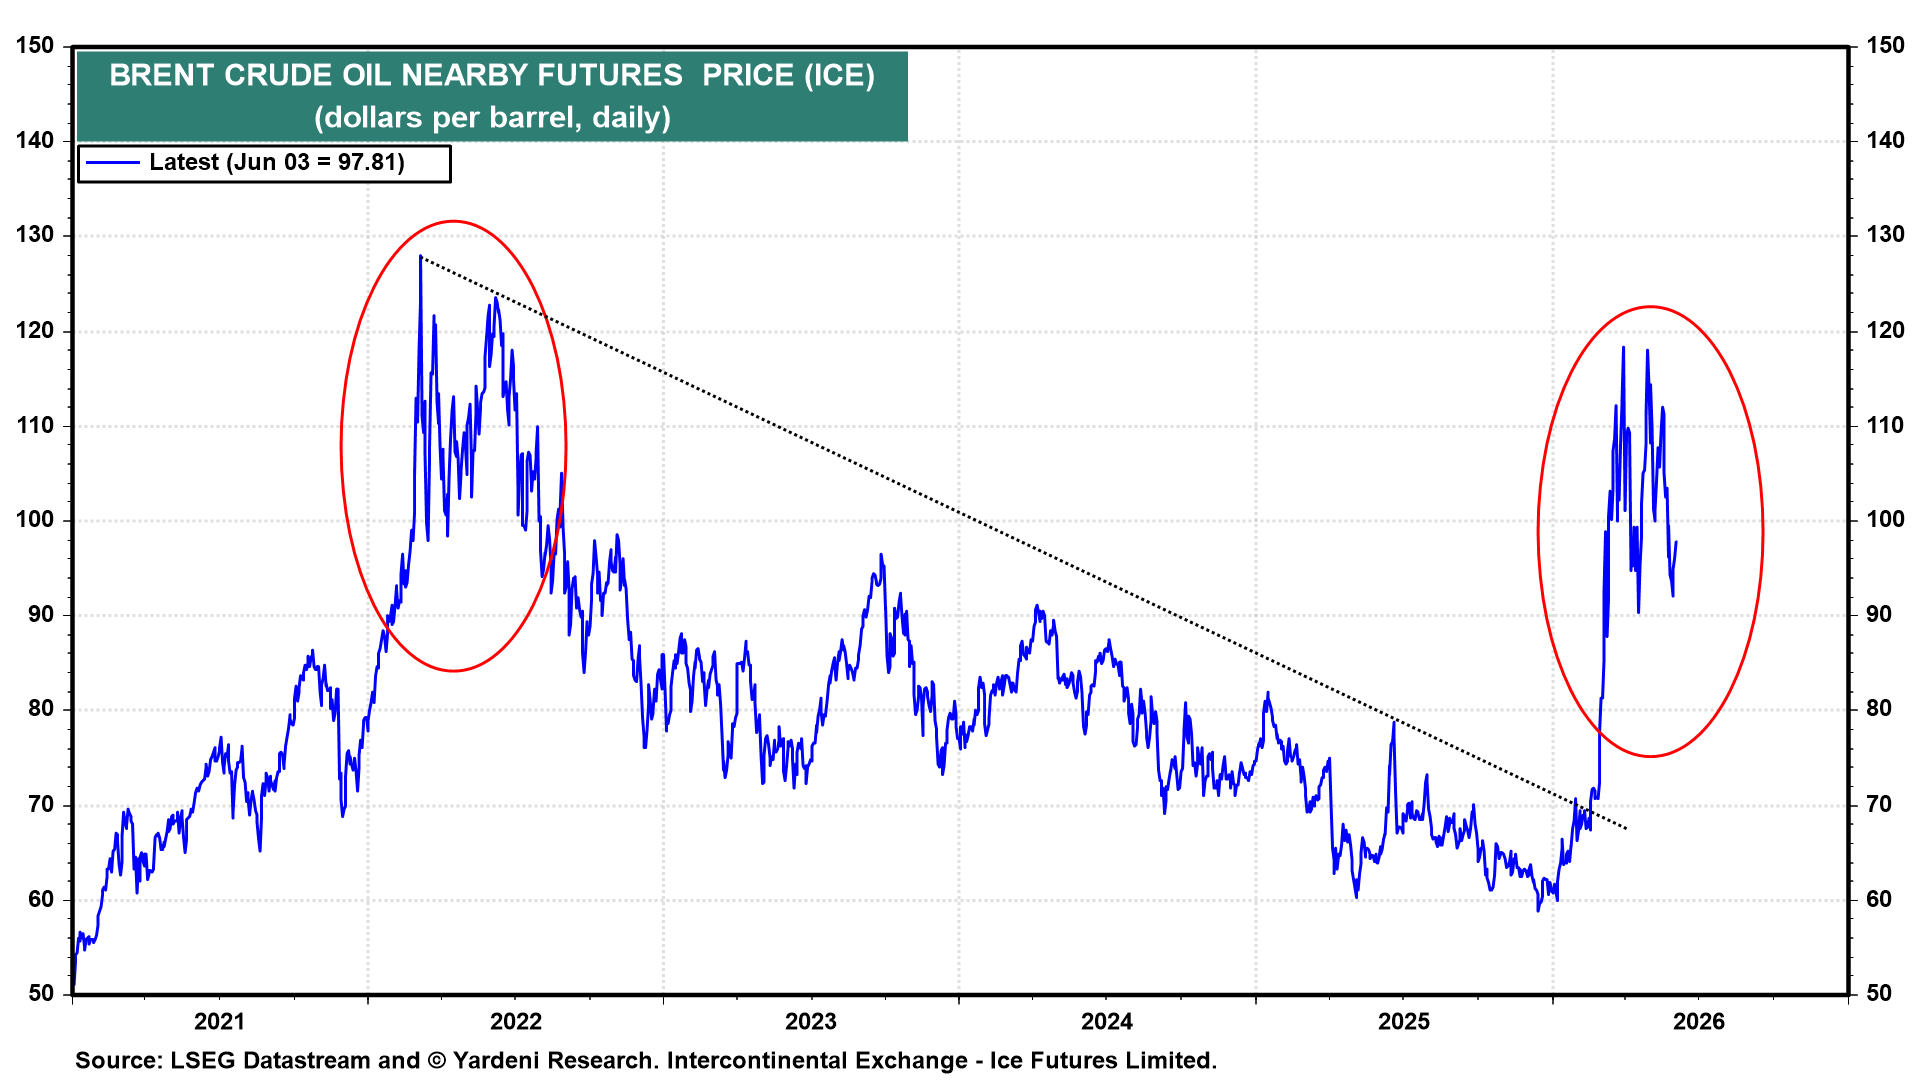
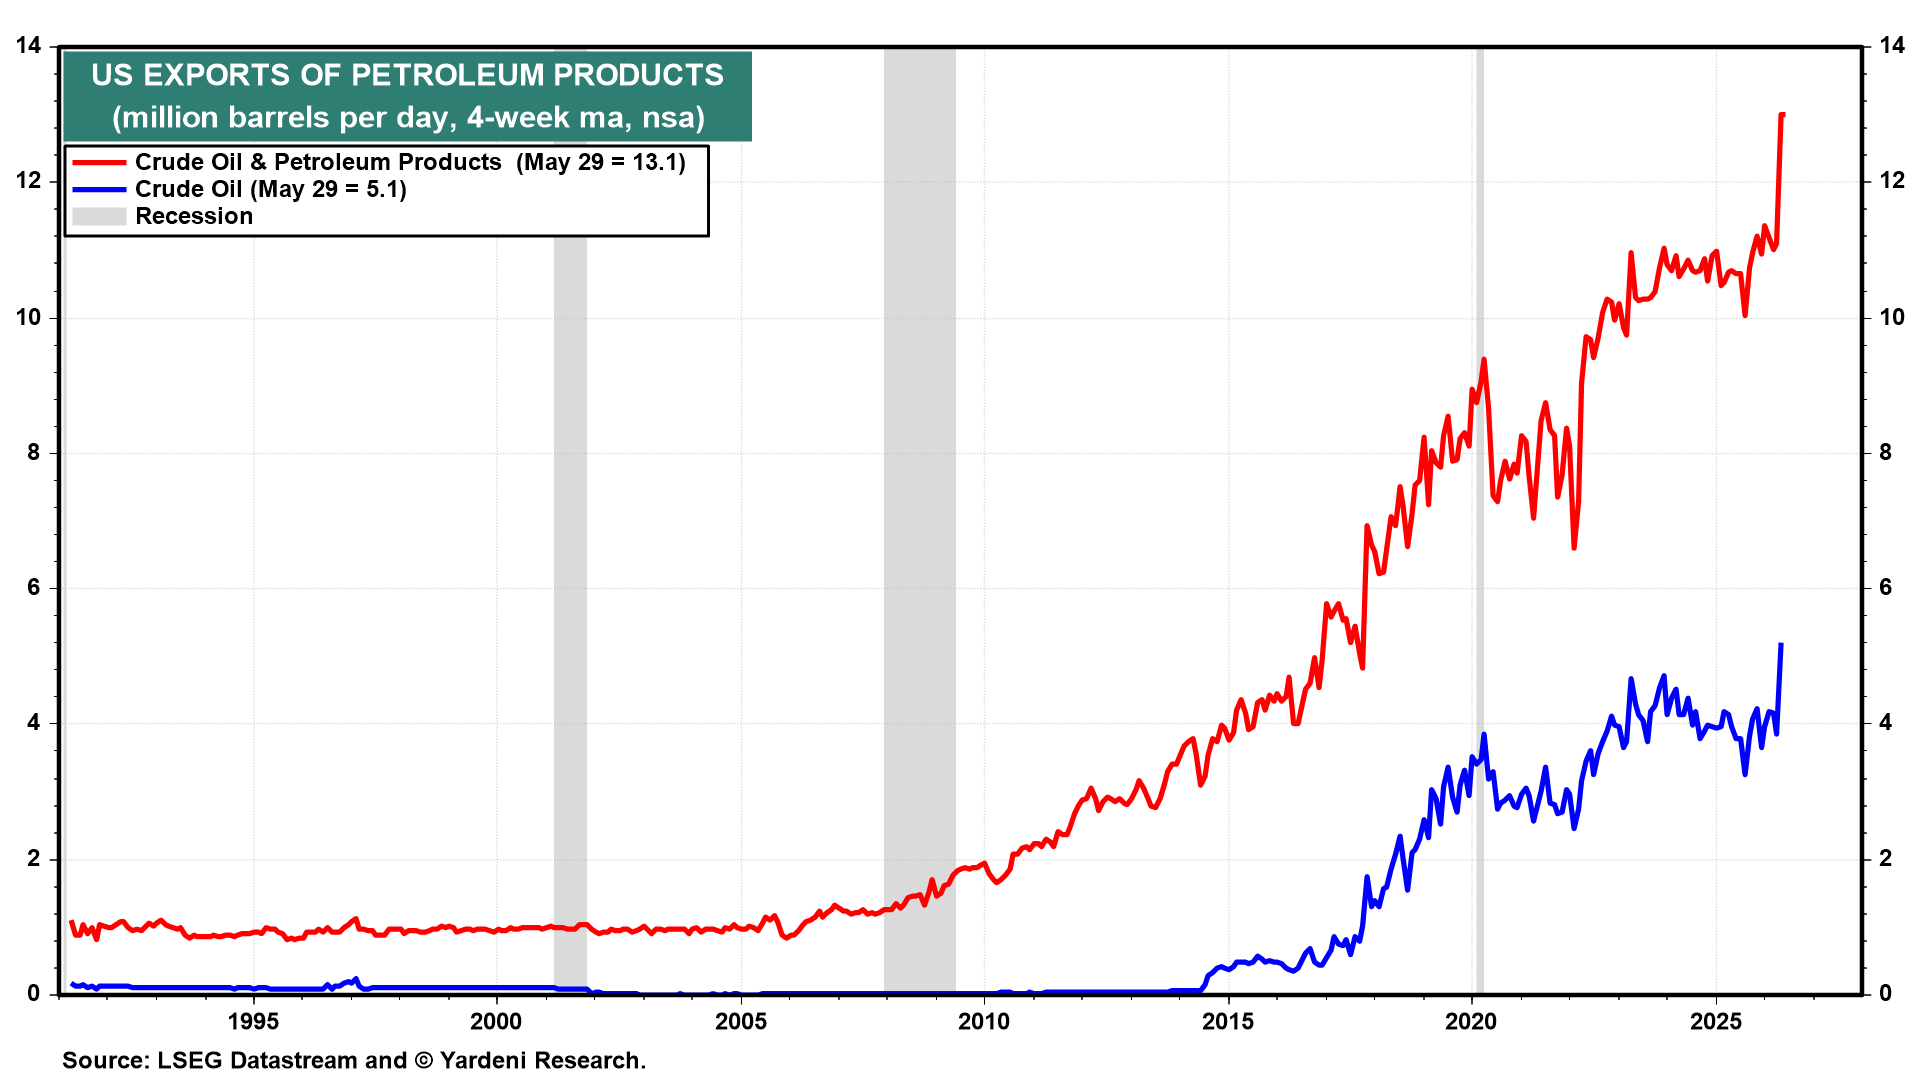
Meanwhile, it is puzzling that oil prices remain around $100 a barrel, despite warnings from oil industry leaders of much higher prices ahead (chart). Apparently, oil tanker owners are paying Iran a "toll" to allow them safe passage out of the Persian Gulf. Russia is selling lots of oil to China and India.
The US has also been exporting more crude oil an petroleum products in recent weeks (chart).
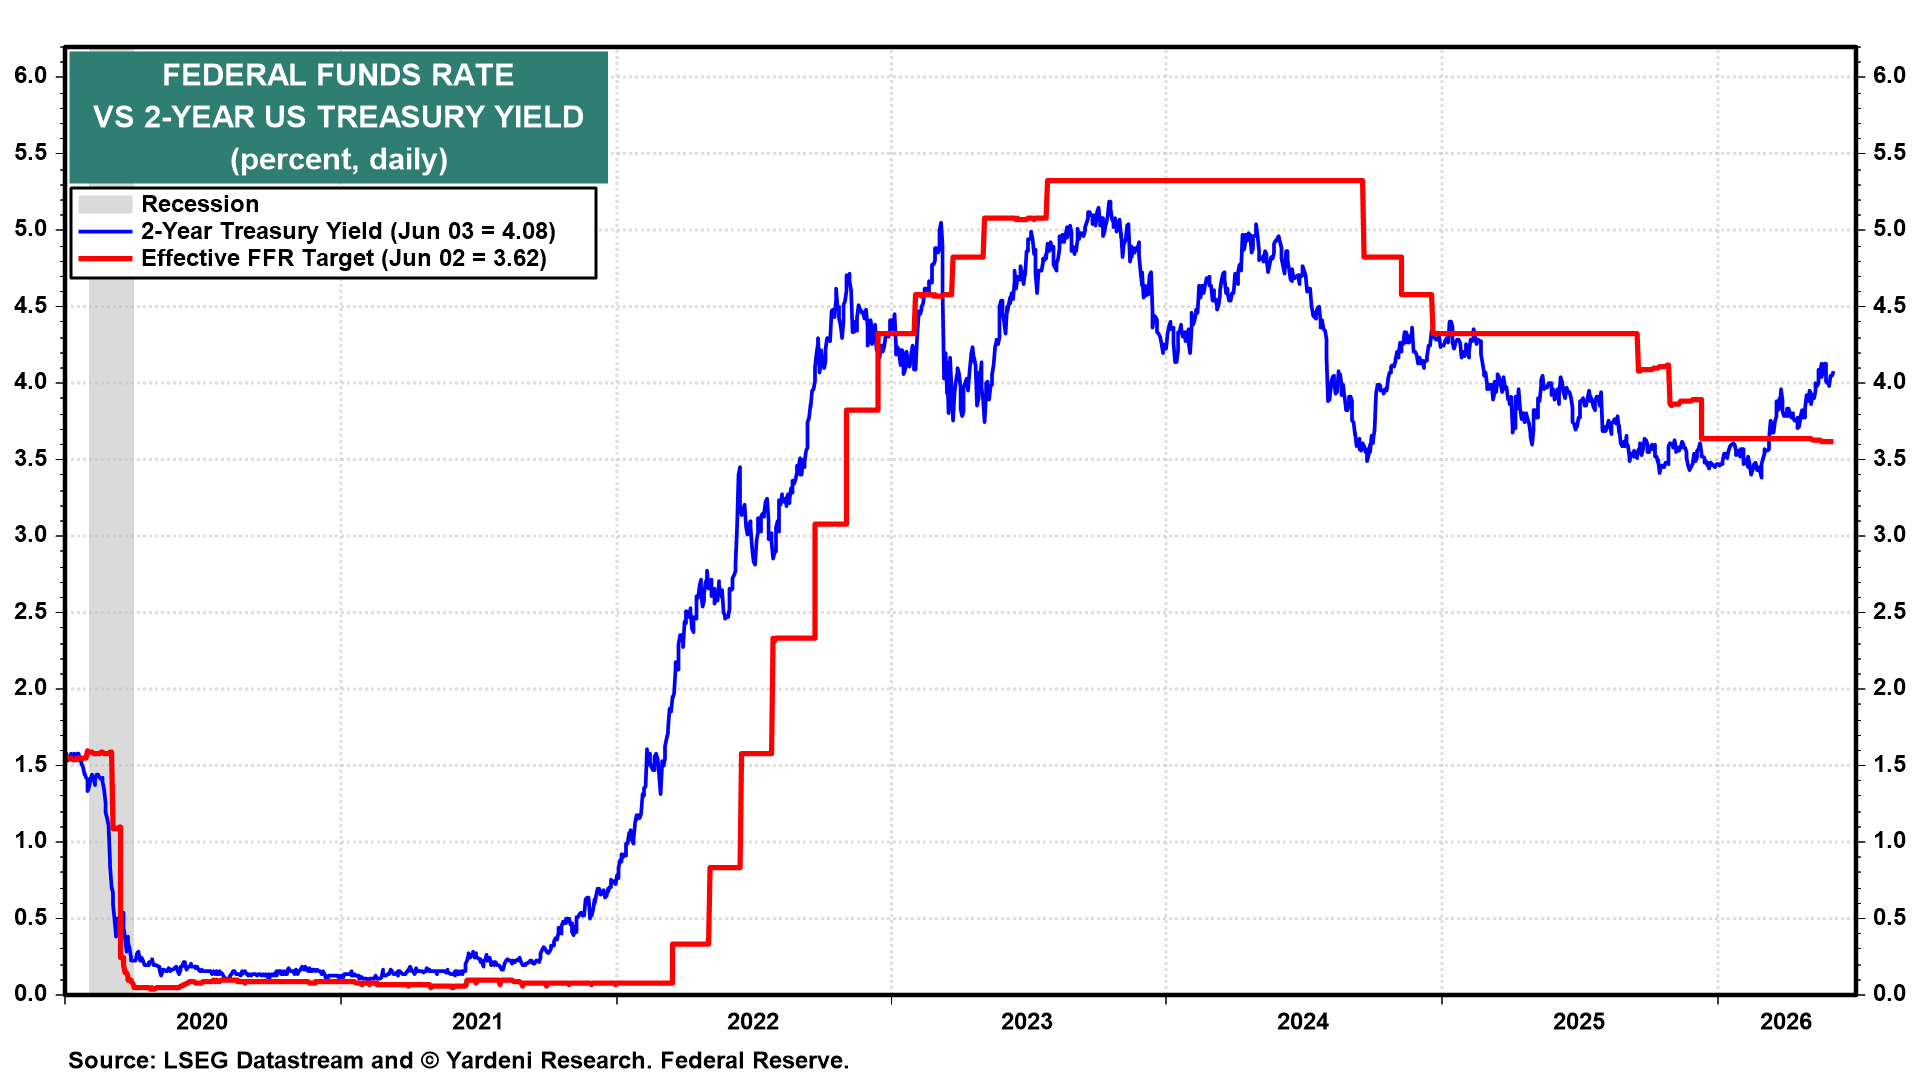
The 2-year US Treasury yield is a good leading indicator of the federal funds rate (FFR). It is up to 4.08%, exceeding the current 3.50%-3.75% FFR range (chart). It is anticipating a Fed rate hike in response to recent hotter-than-expected inflation reports and stronger-than-expected employment indicators.
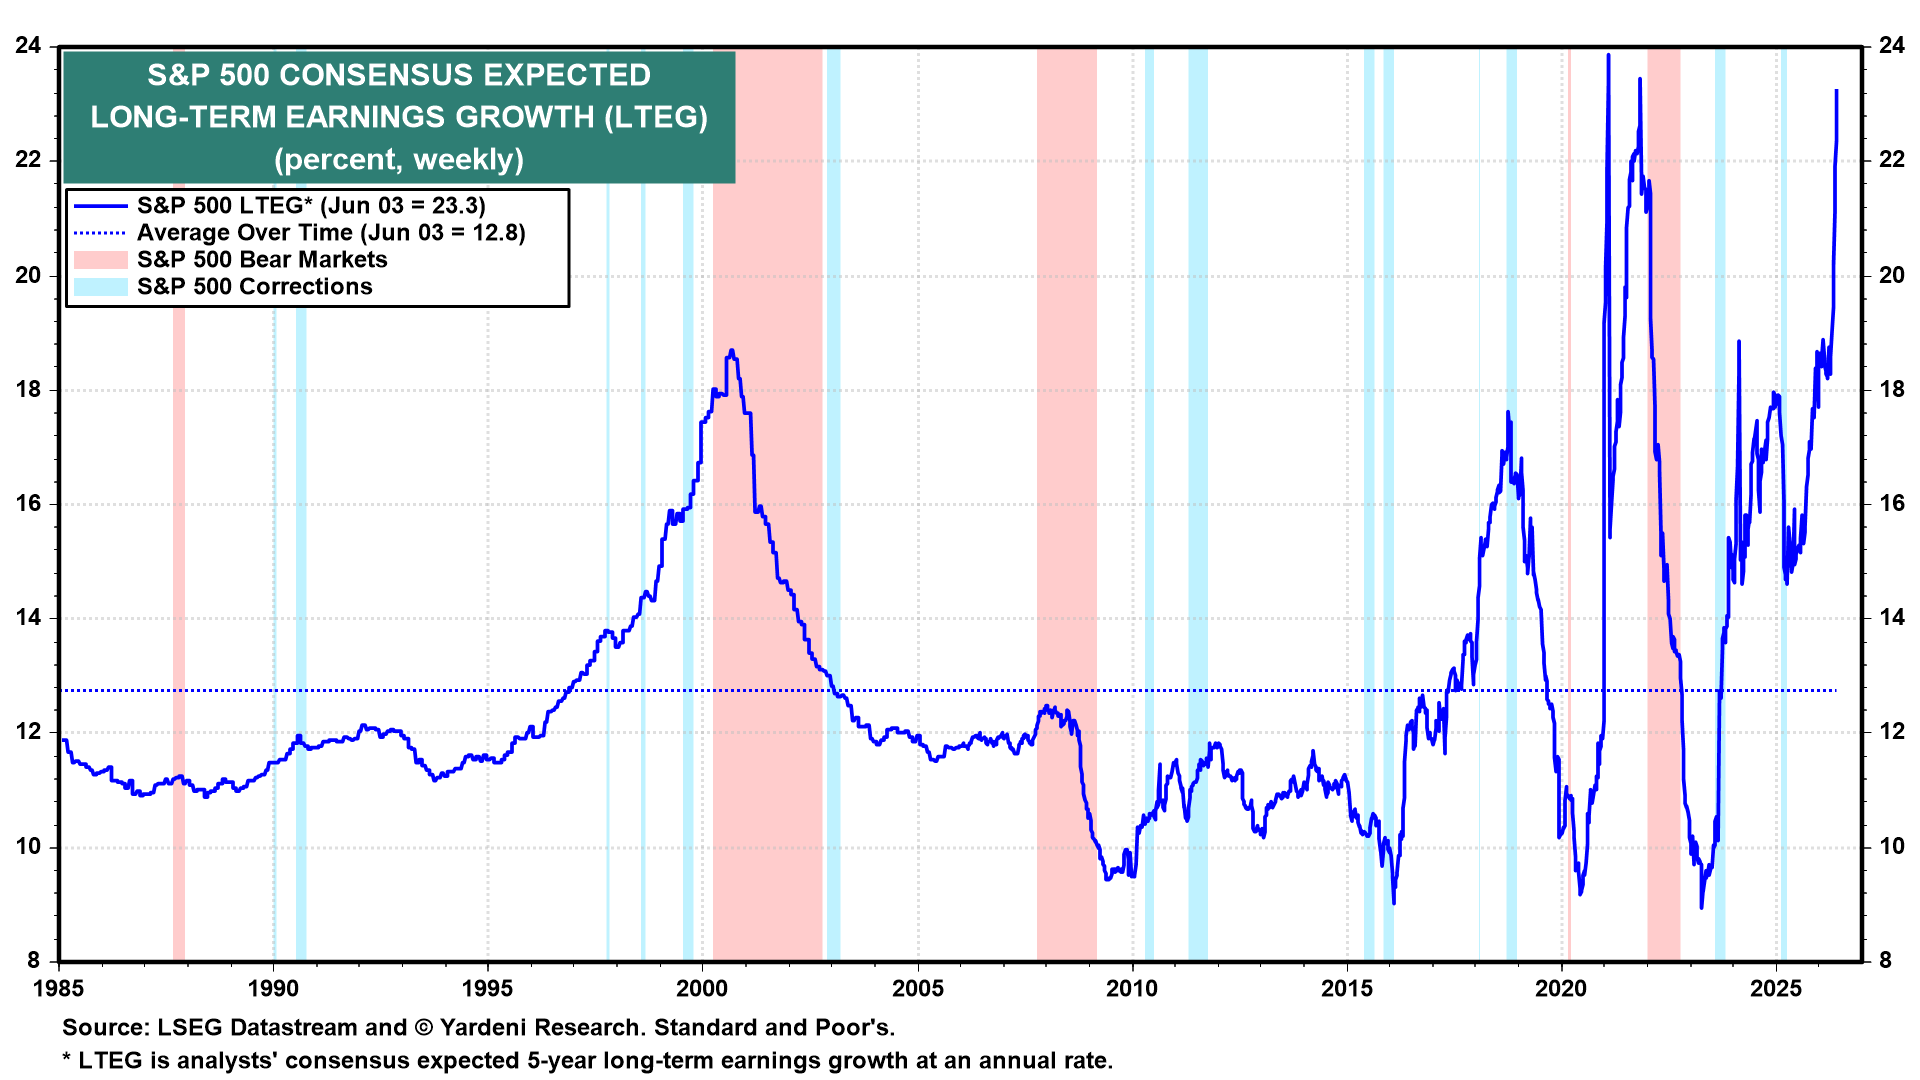
Another concern is that Q1's FEMO seems to have stimulated irrational exuberance about the long-term earnings growth (LTEG) prospects of the S&P 500 (chart).
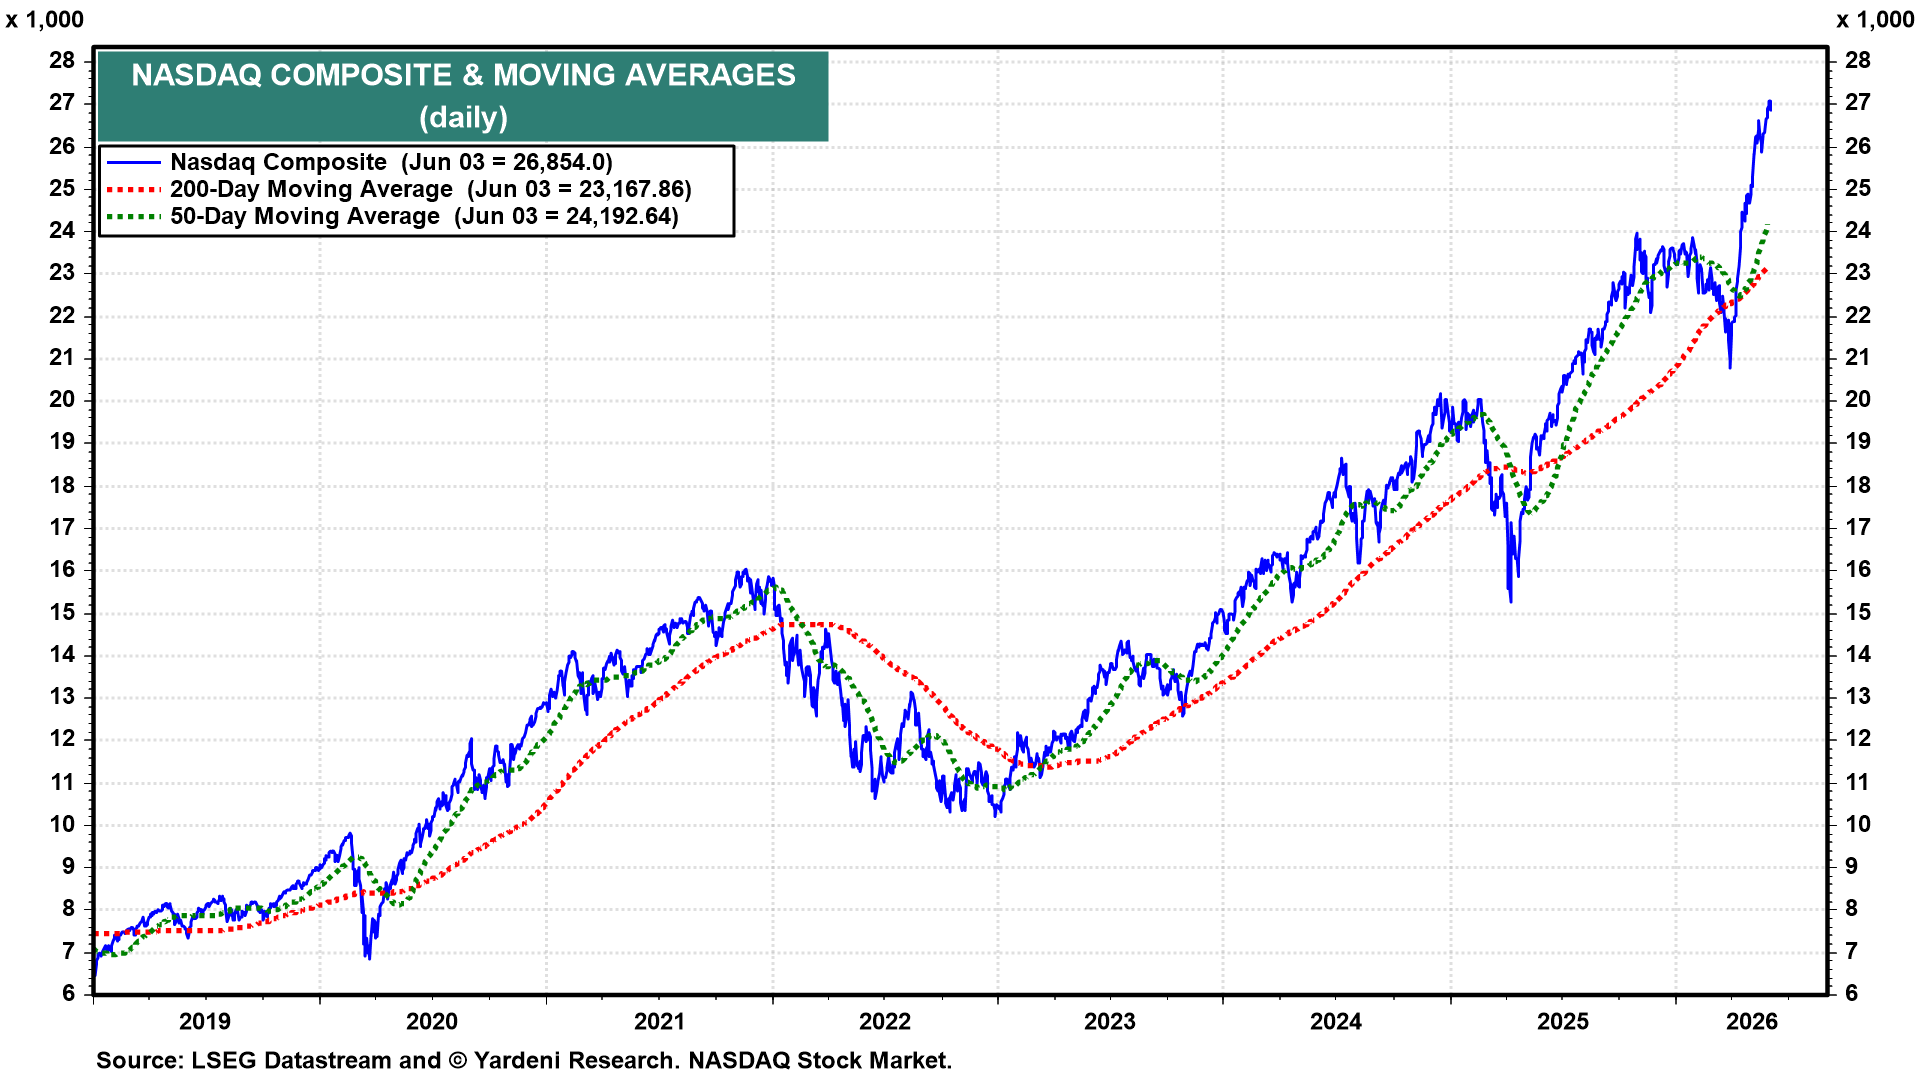
Analysts' heady expectations for LTEG are mirrored in the Nasdaq's vertical ascent (chart) ...
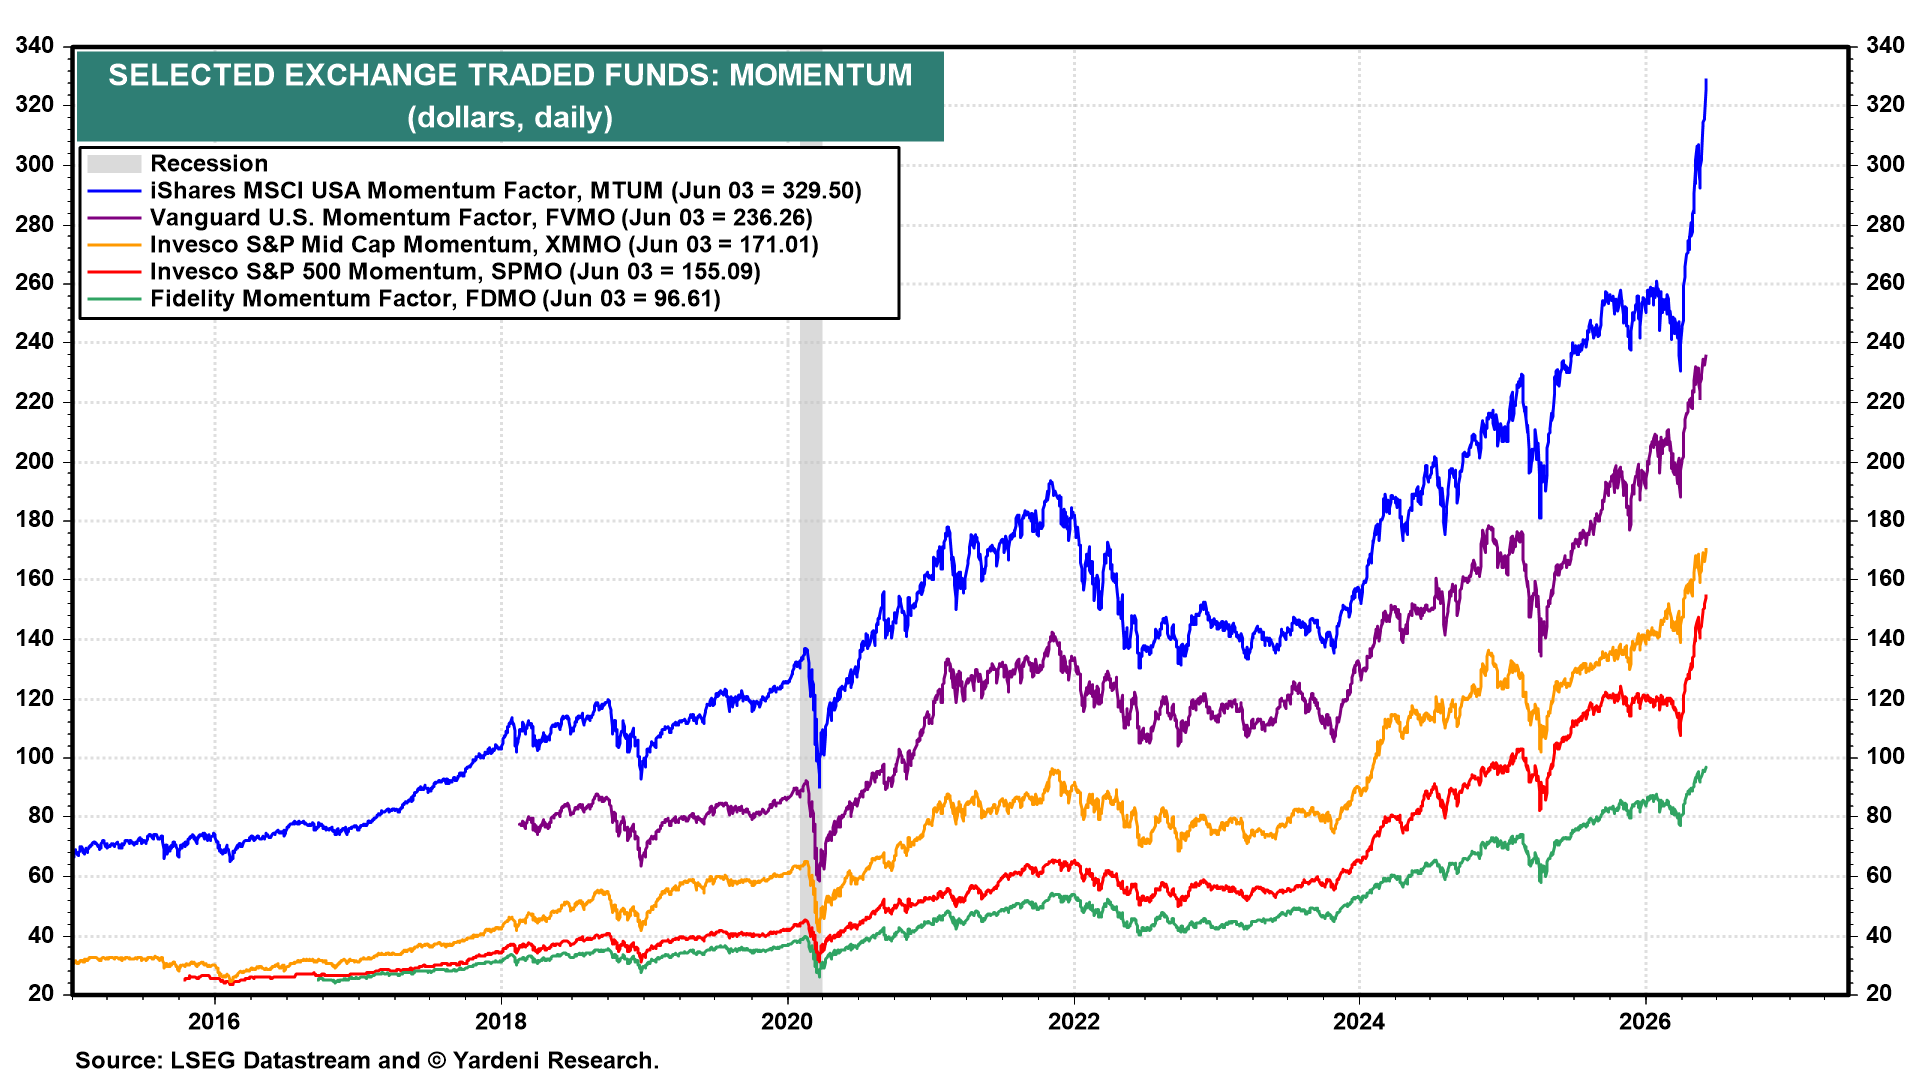
... momentum ETFs (chart) ...
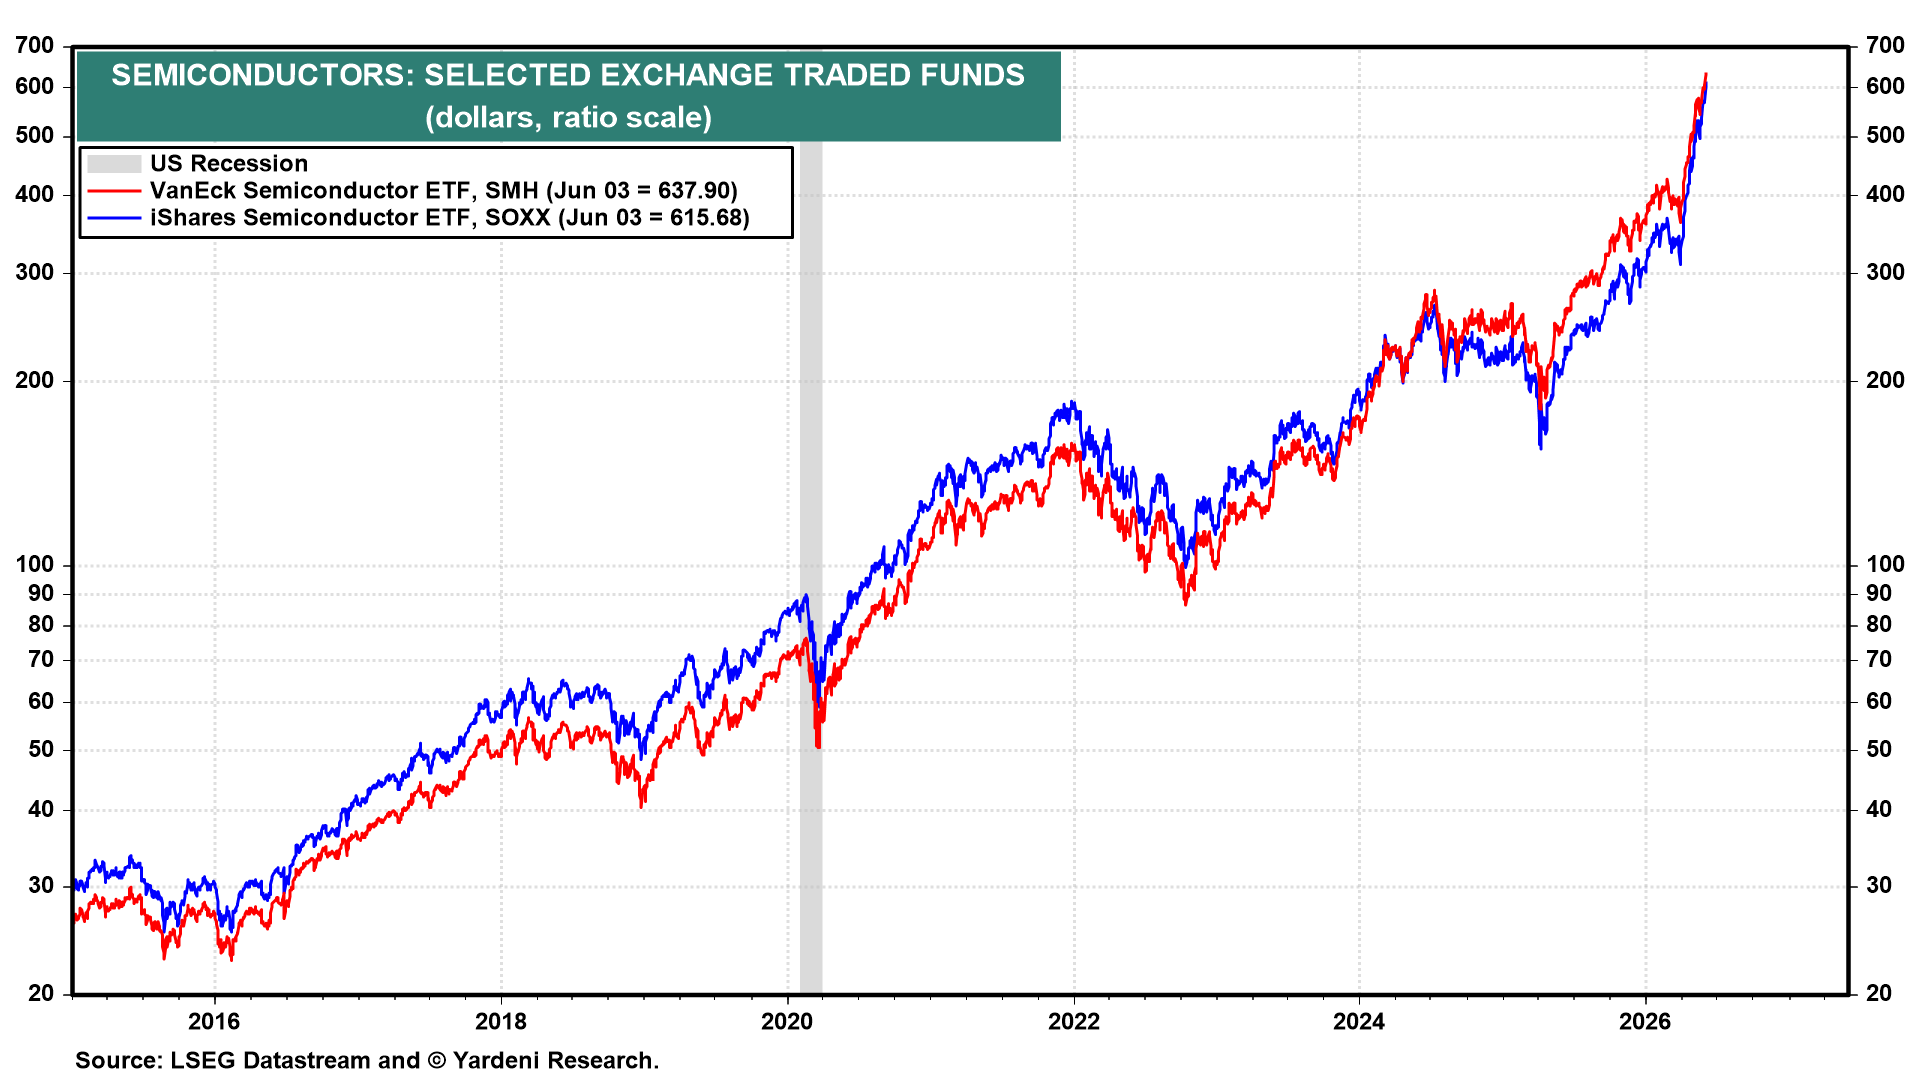
... semiconductor ETFs (chart) ...
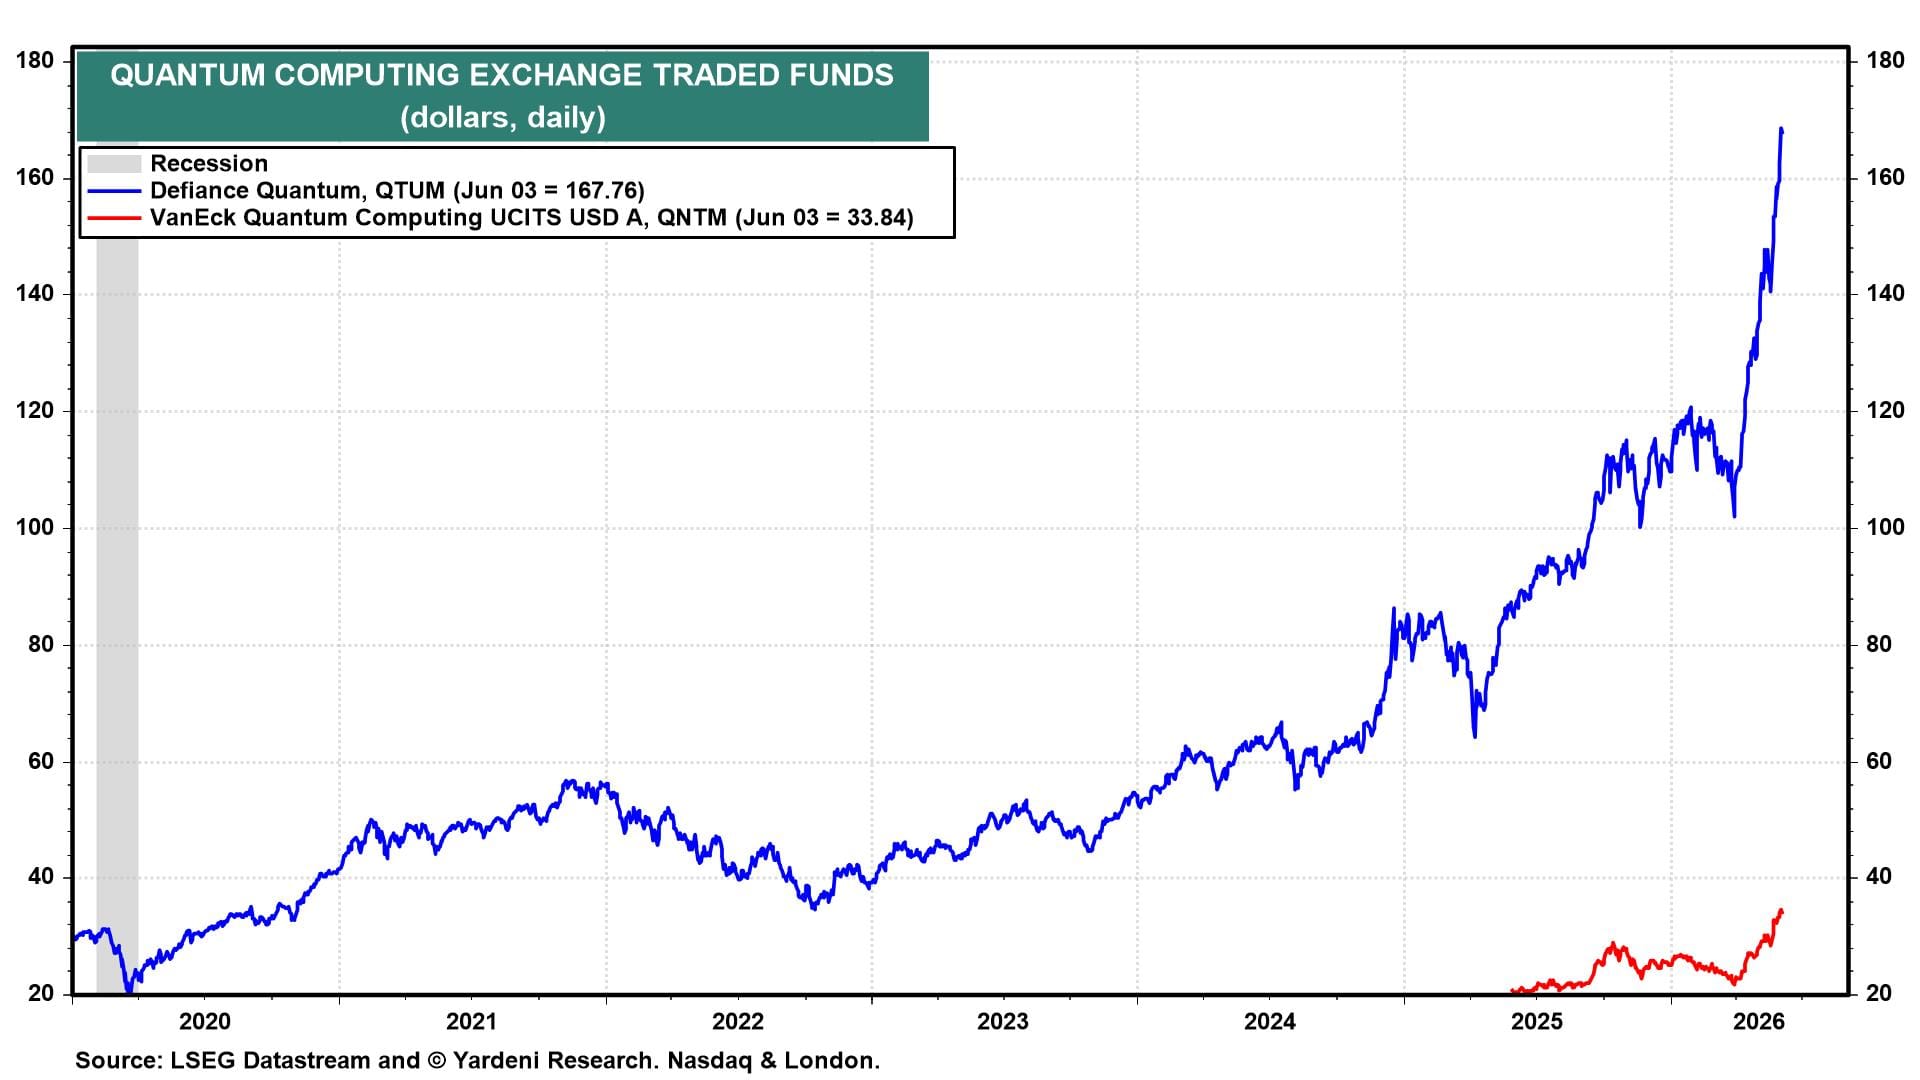
... quantum computing stock prices (chart) ....
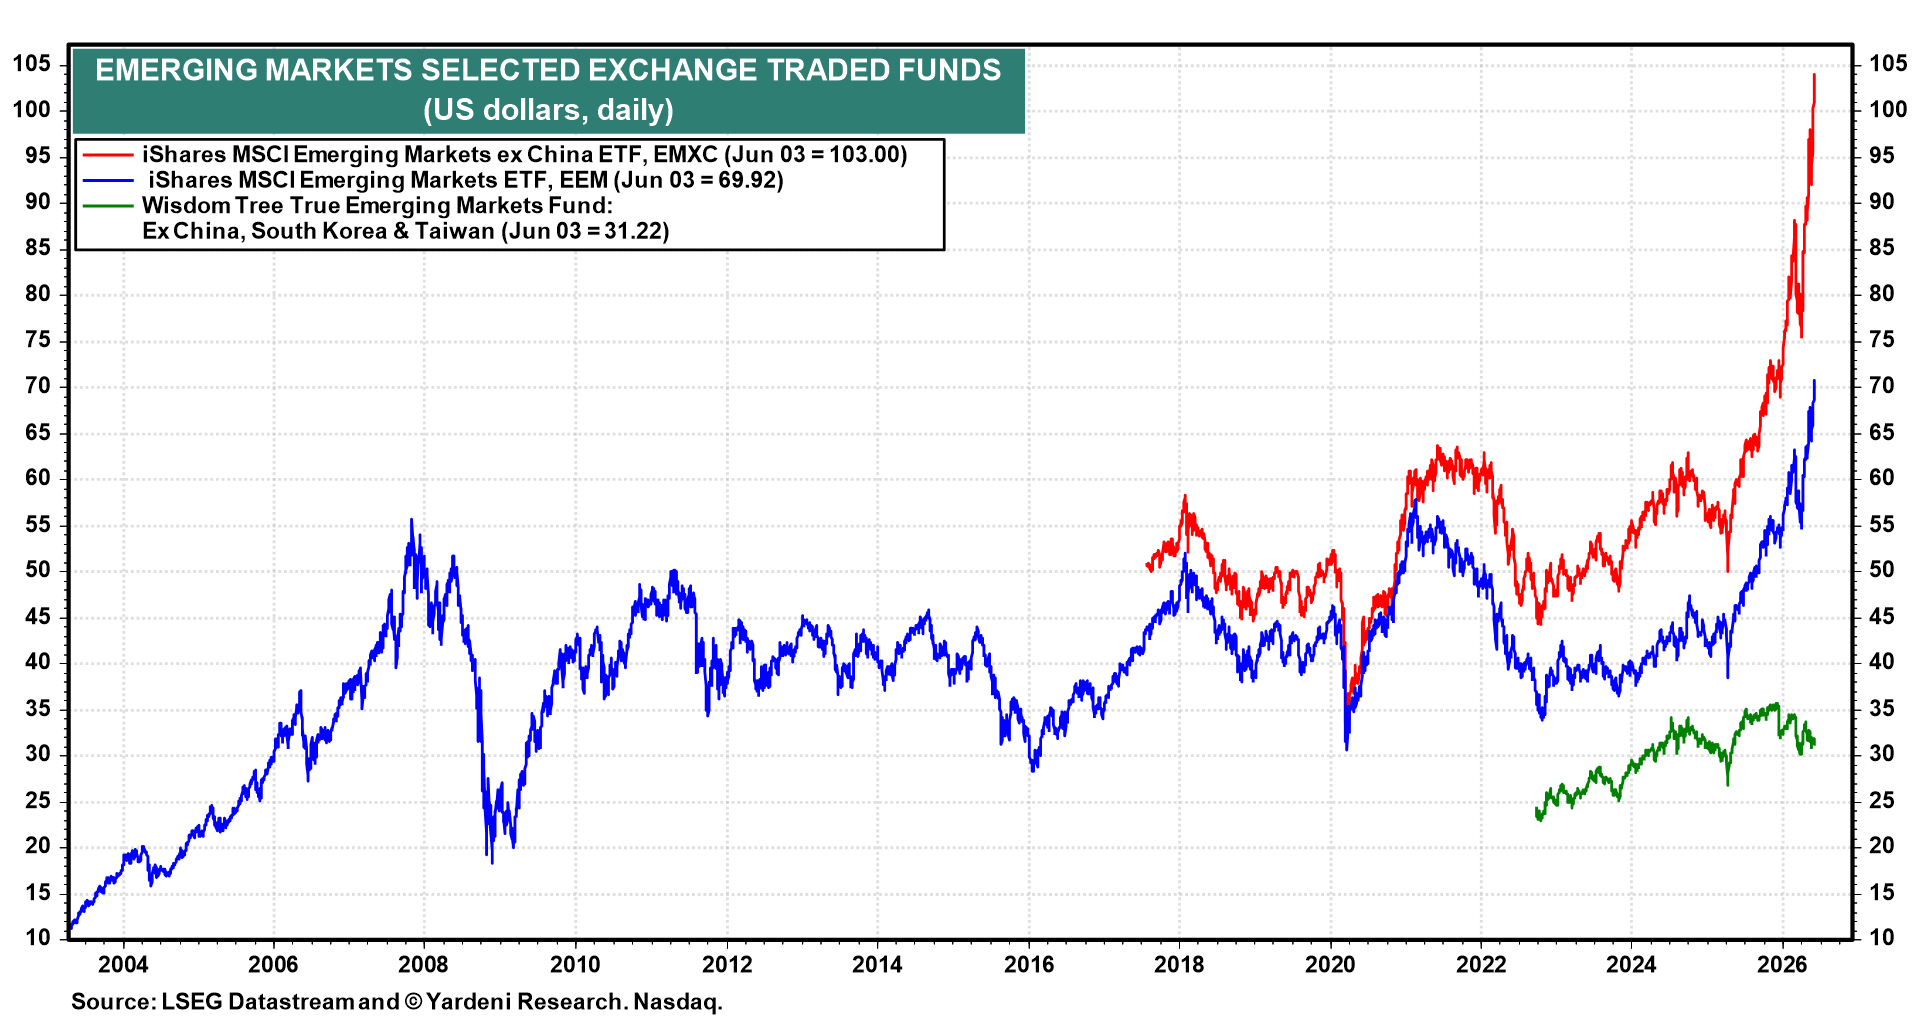
... emerging market ETFs bolstered by AI bets on Taiwan and South Korea (chart).
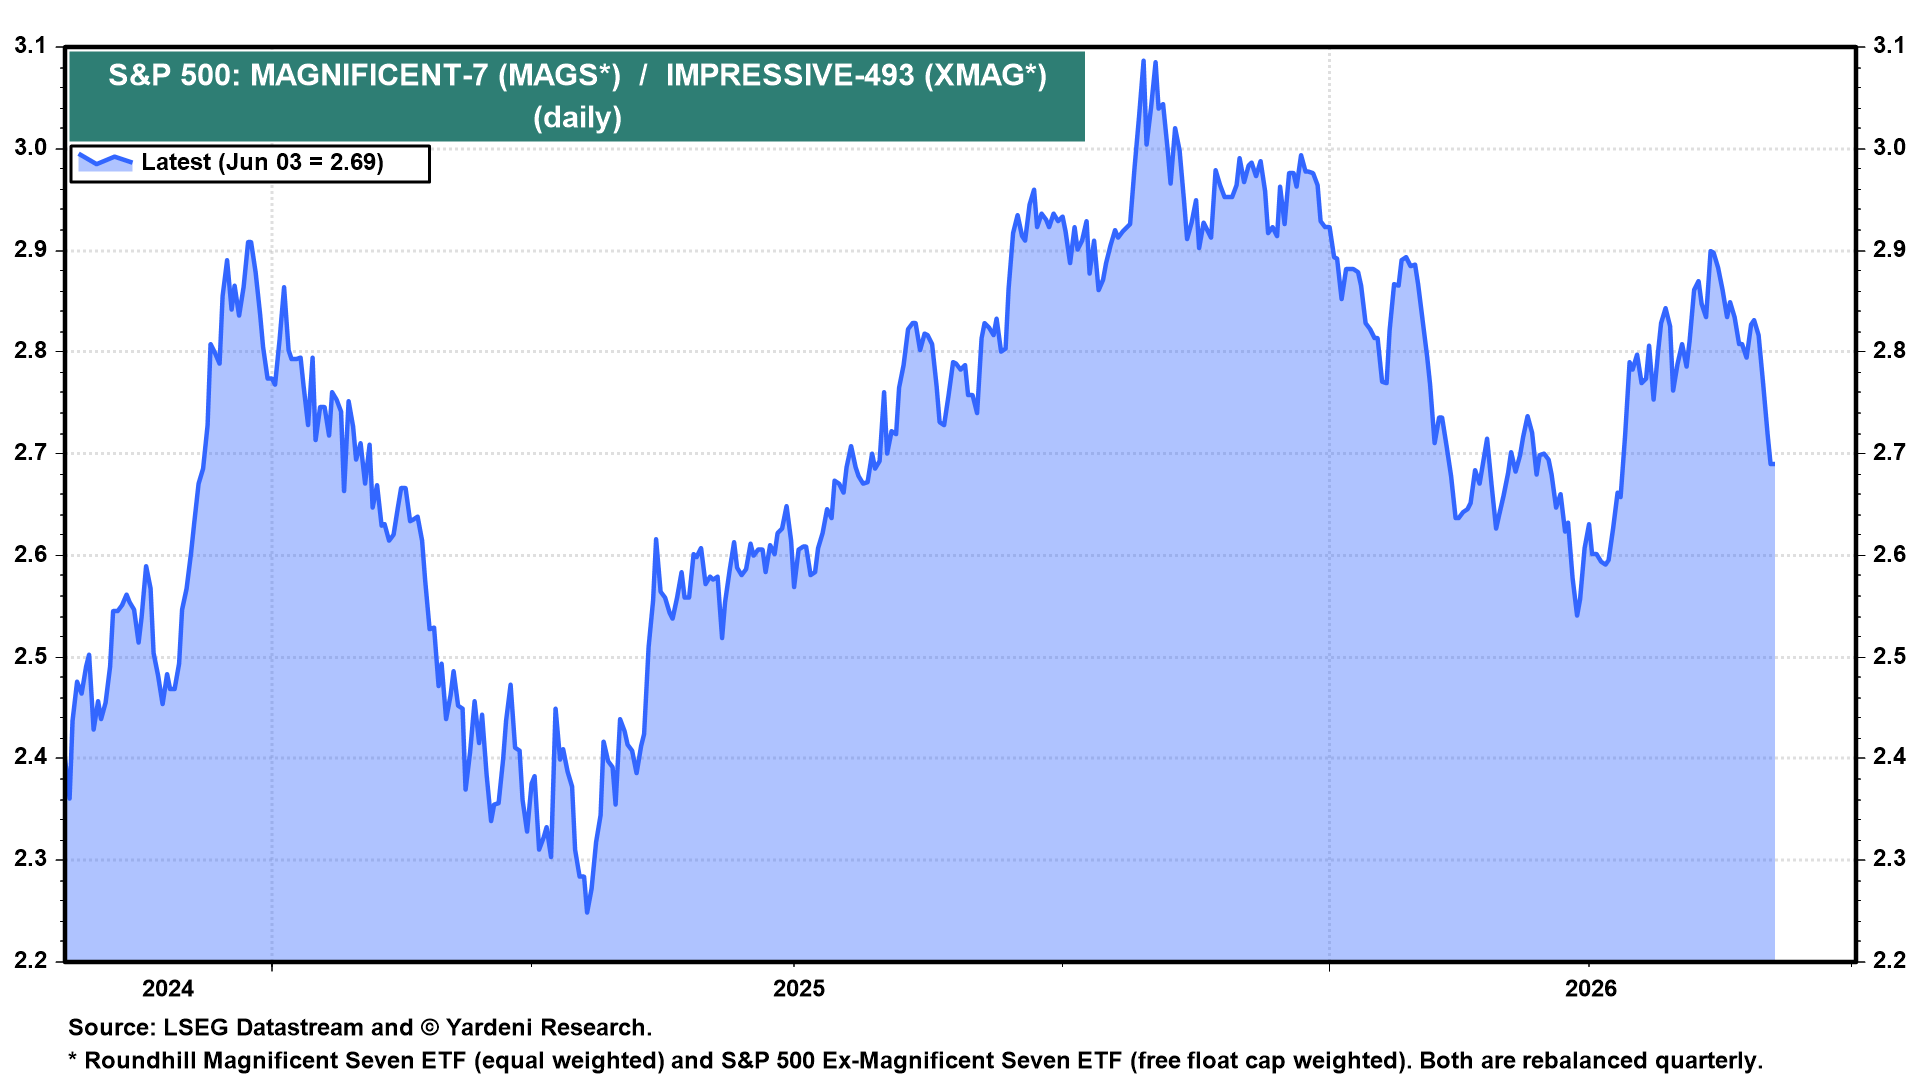
Then again, some of the froth seems to be coming out of the Magnificent-7 (chart).
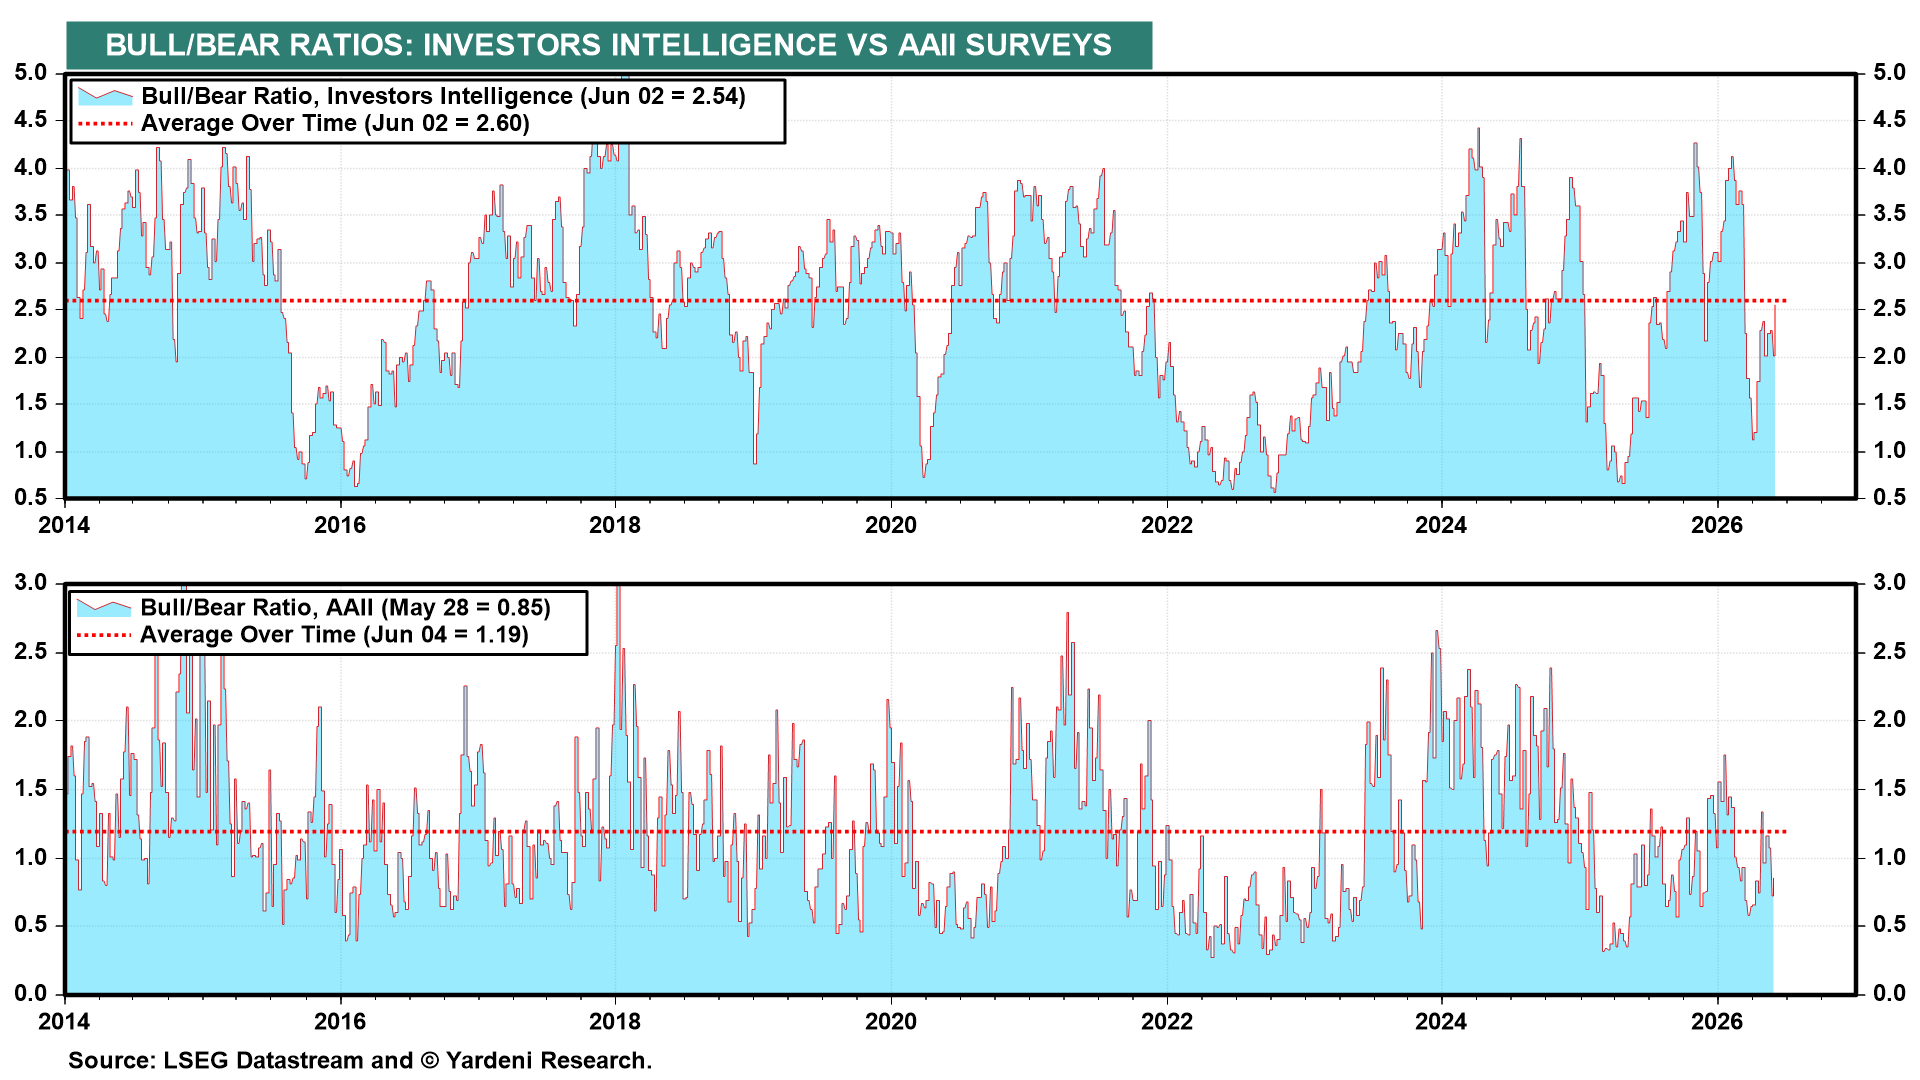
Last but not least, our two favorite bull/bear ratios remain relatively subdued, suggesting that any pullback should be modest (chart).