The major stock market indexes rocketed to new record highs on Friday. We are raising the odds of a meltup from 25% to 30%, reducing the odds of our bullish base-case scenario from 55% to 50%, while leaving the bearish alternative scenario at 20%. In our base-case scenario, the S&P 500 stock price index rises to 7000 by the end of this year and 7700 by the end of next year. Those targets would be exceeded sooner in a meltup, forcing us to raise our odds of a bearish outcome—i.e., a correction, a bear market, or a meltdown.
September's cooler-than-expected CPI report on Friday morning increased the odds of two more Fed rate cuts before the end of this year. Since then, we've been humming Frank Sinatra's rendition of the song "Fly Me To The Moon." The CME FedWatch Tool reflects a 90% probability of two 25bps cuts before year-end, bringing the federal funds rate (FFR) down to 3.50%. It's a sure bet.
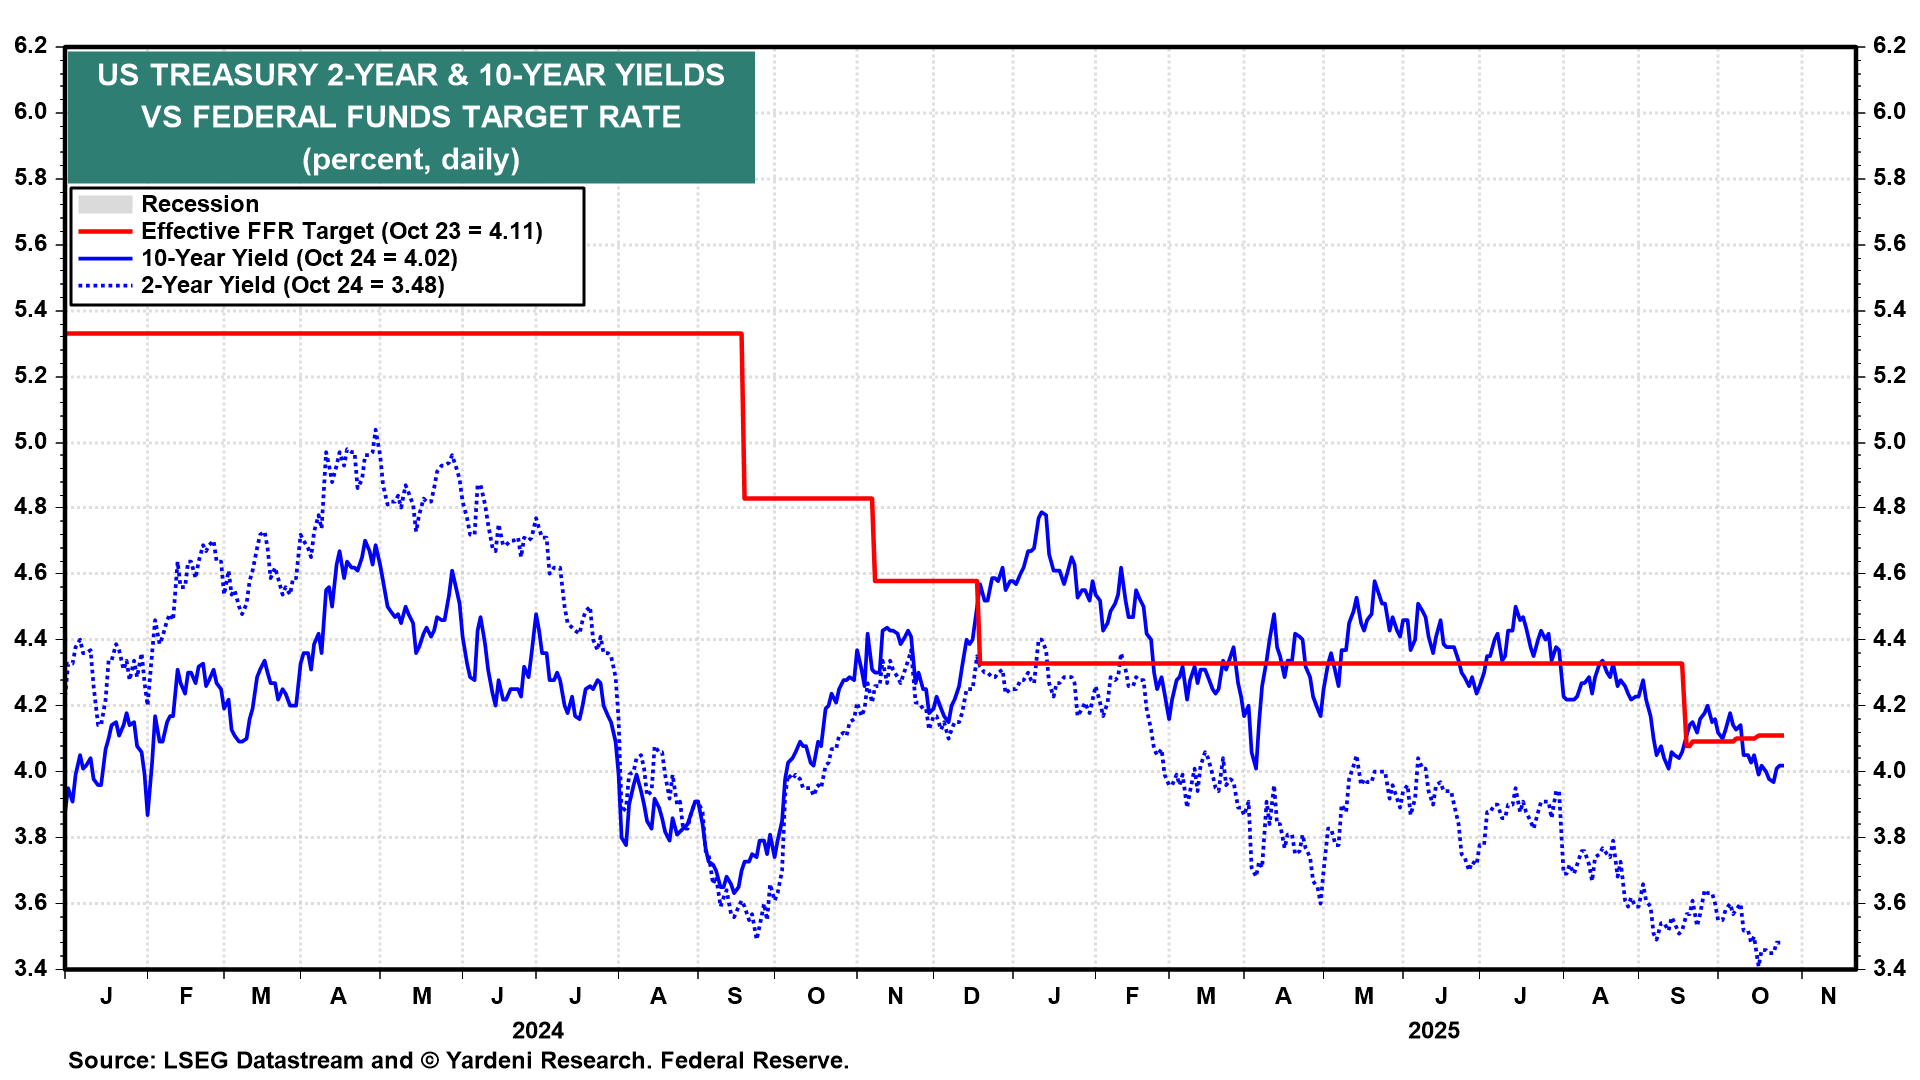
The 2-year US Treasury yield had already declined from 3.60% at the beginning of October to 3.48% on Friday. However, the 10-year yield remained stuck around 4.00% (chart). The Fed may be making the same mistake as it did last year, when a 100bps cut in the FFR prompted a 100bps rise in the 10-year yield (along with mortgage rates).
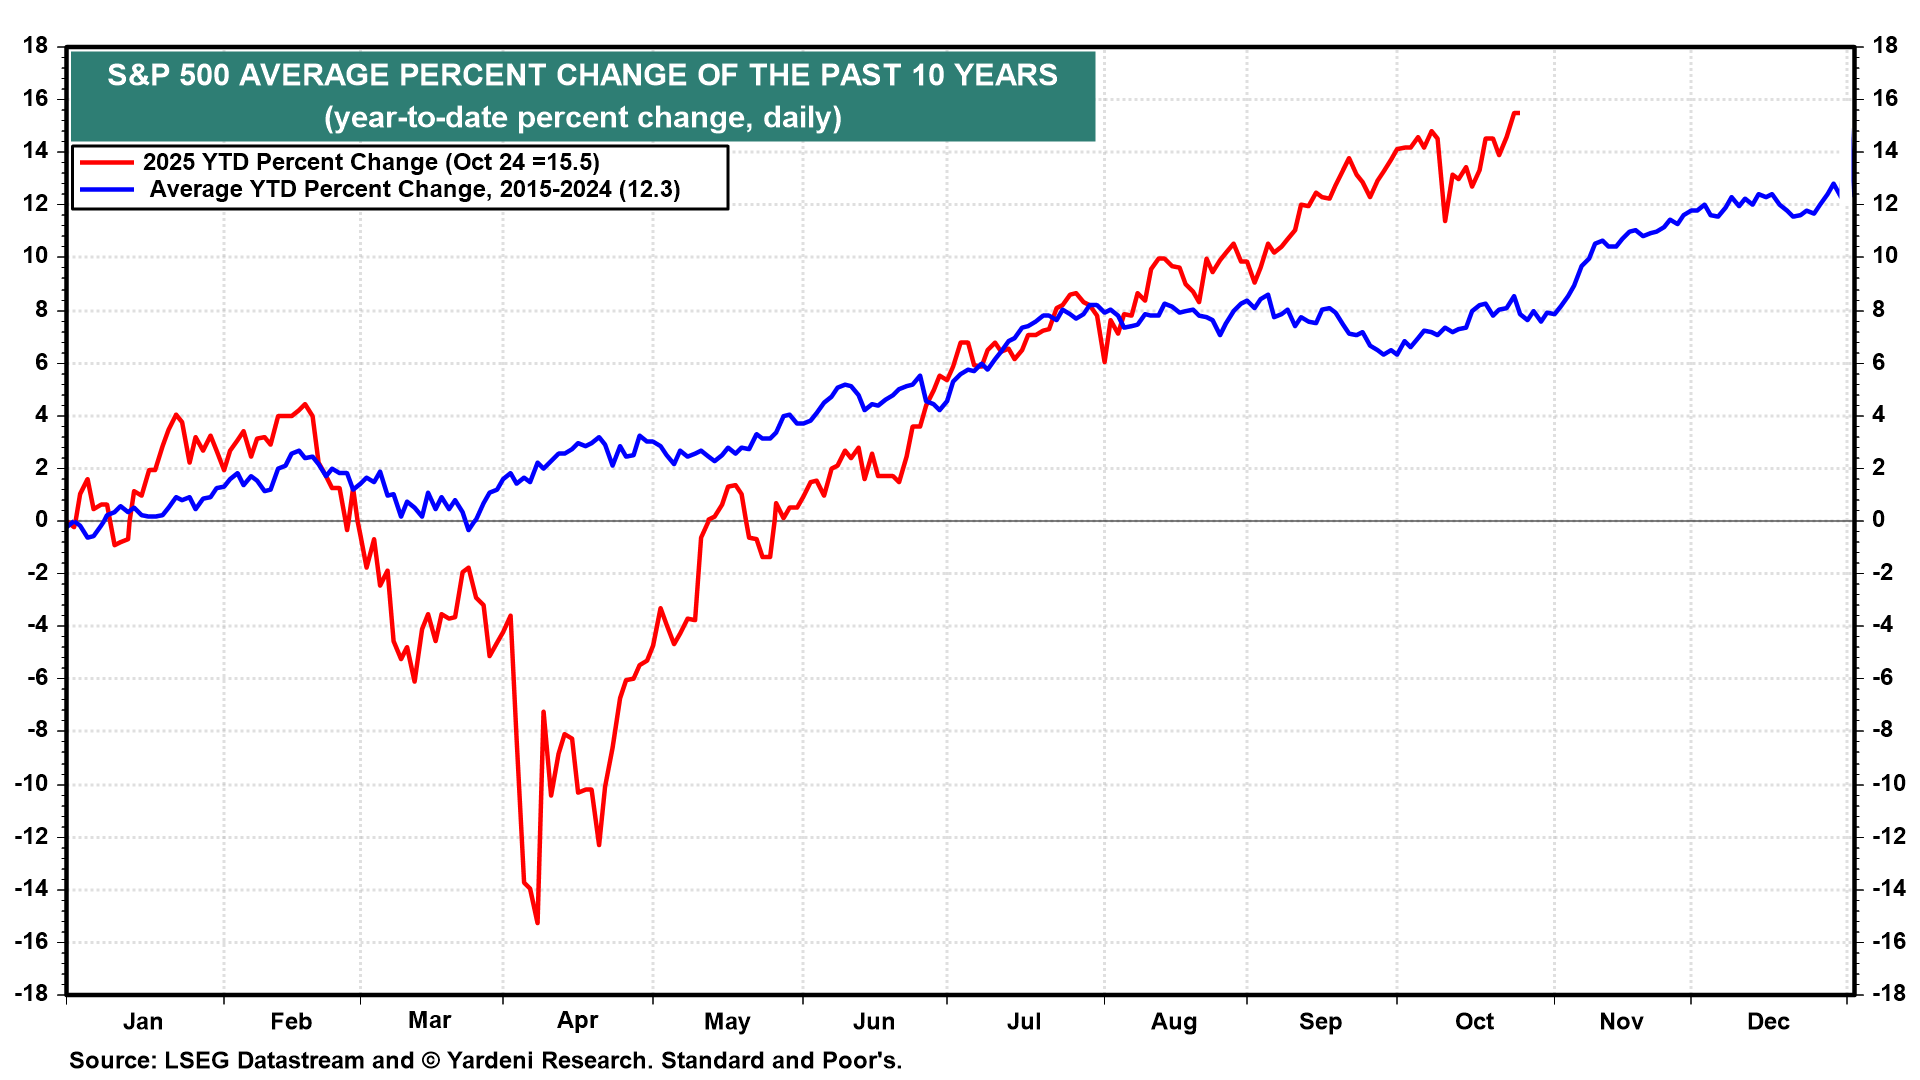
The S&P 500 is now up 15.5% ytd to 6791.69 (chart). On average over the past 10 years, the index has increased by a total of four percentage points in November and December combined. If it does so again this year, the index would rise to 7063 from Friday's close.
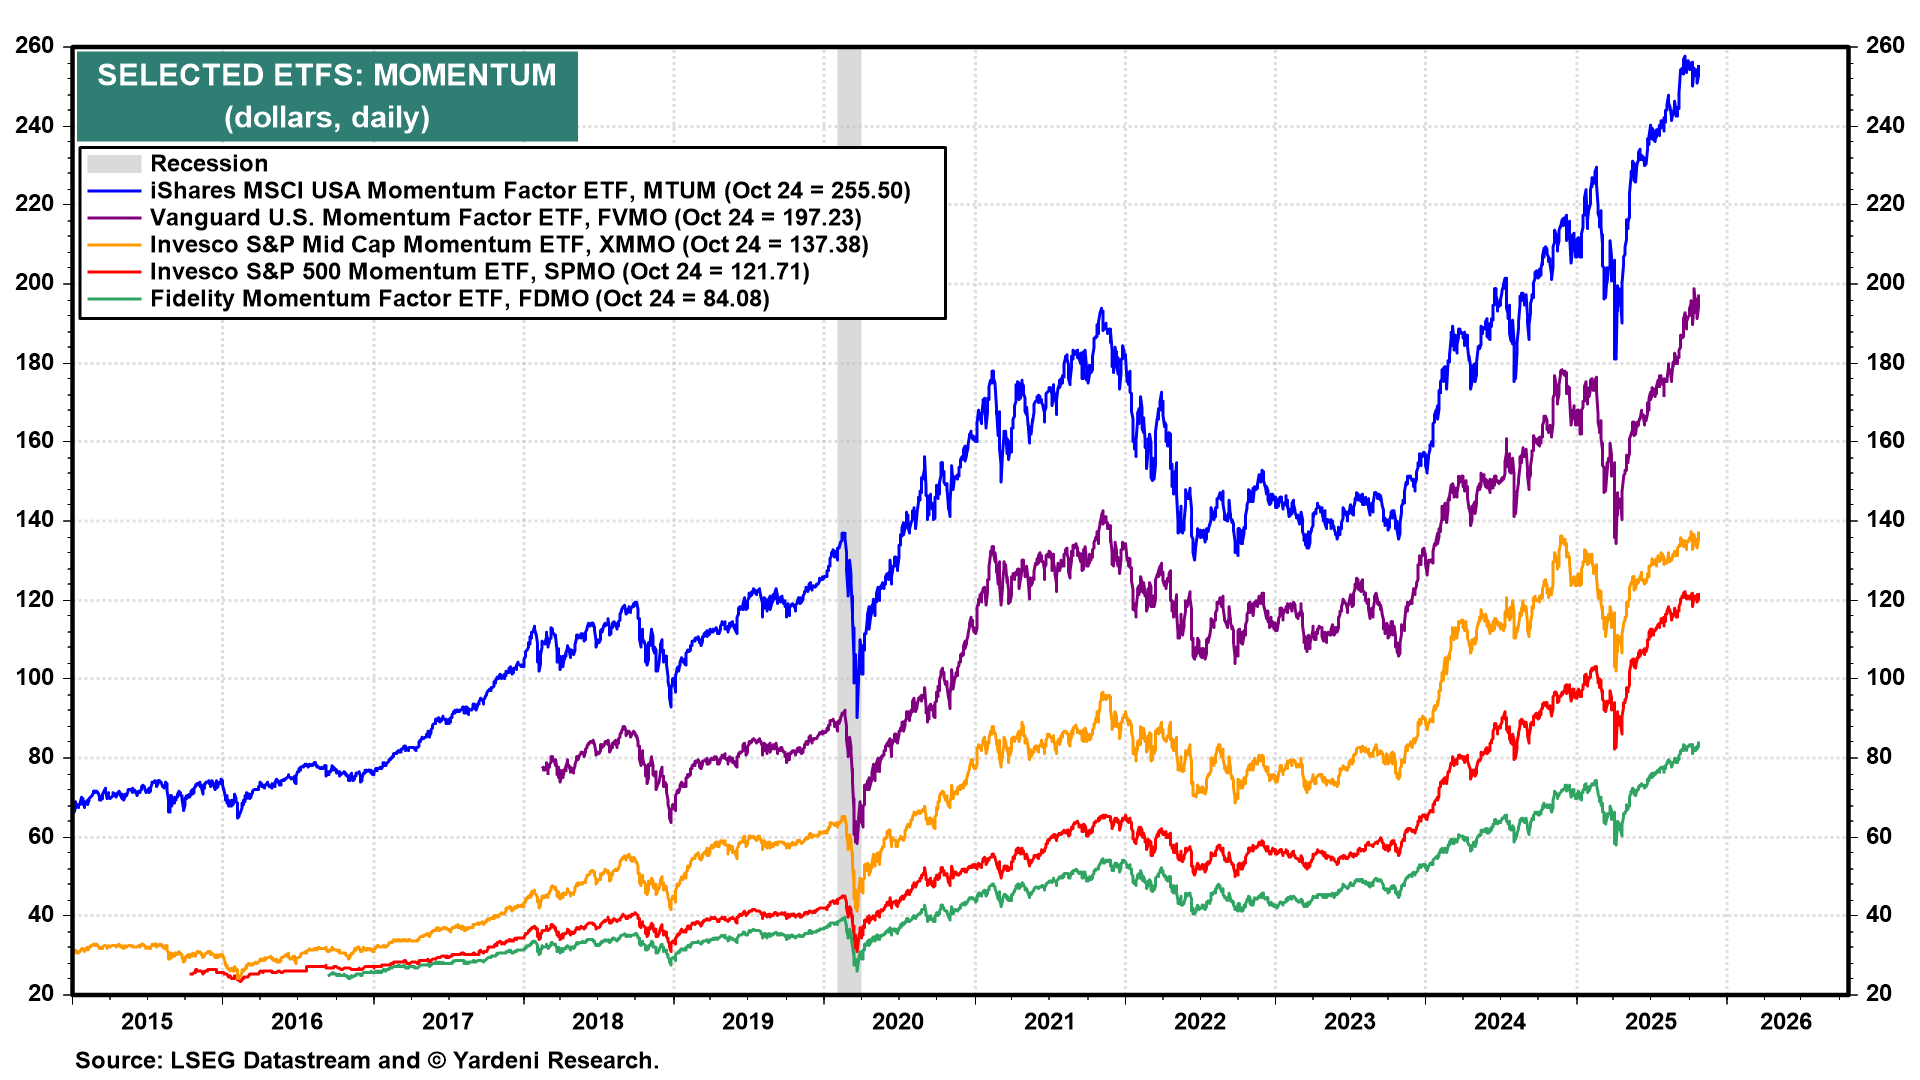
After a brief correction earlier this year, momentum stocks have continued to lead the bull market higher, as they have since late 2023 (chart).
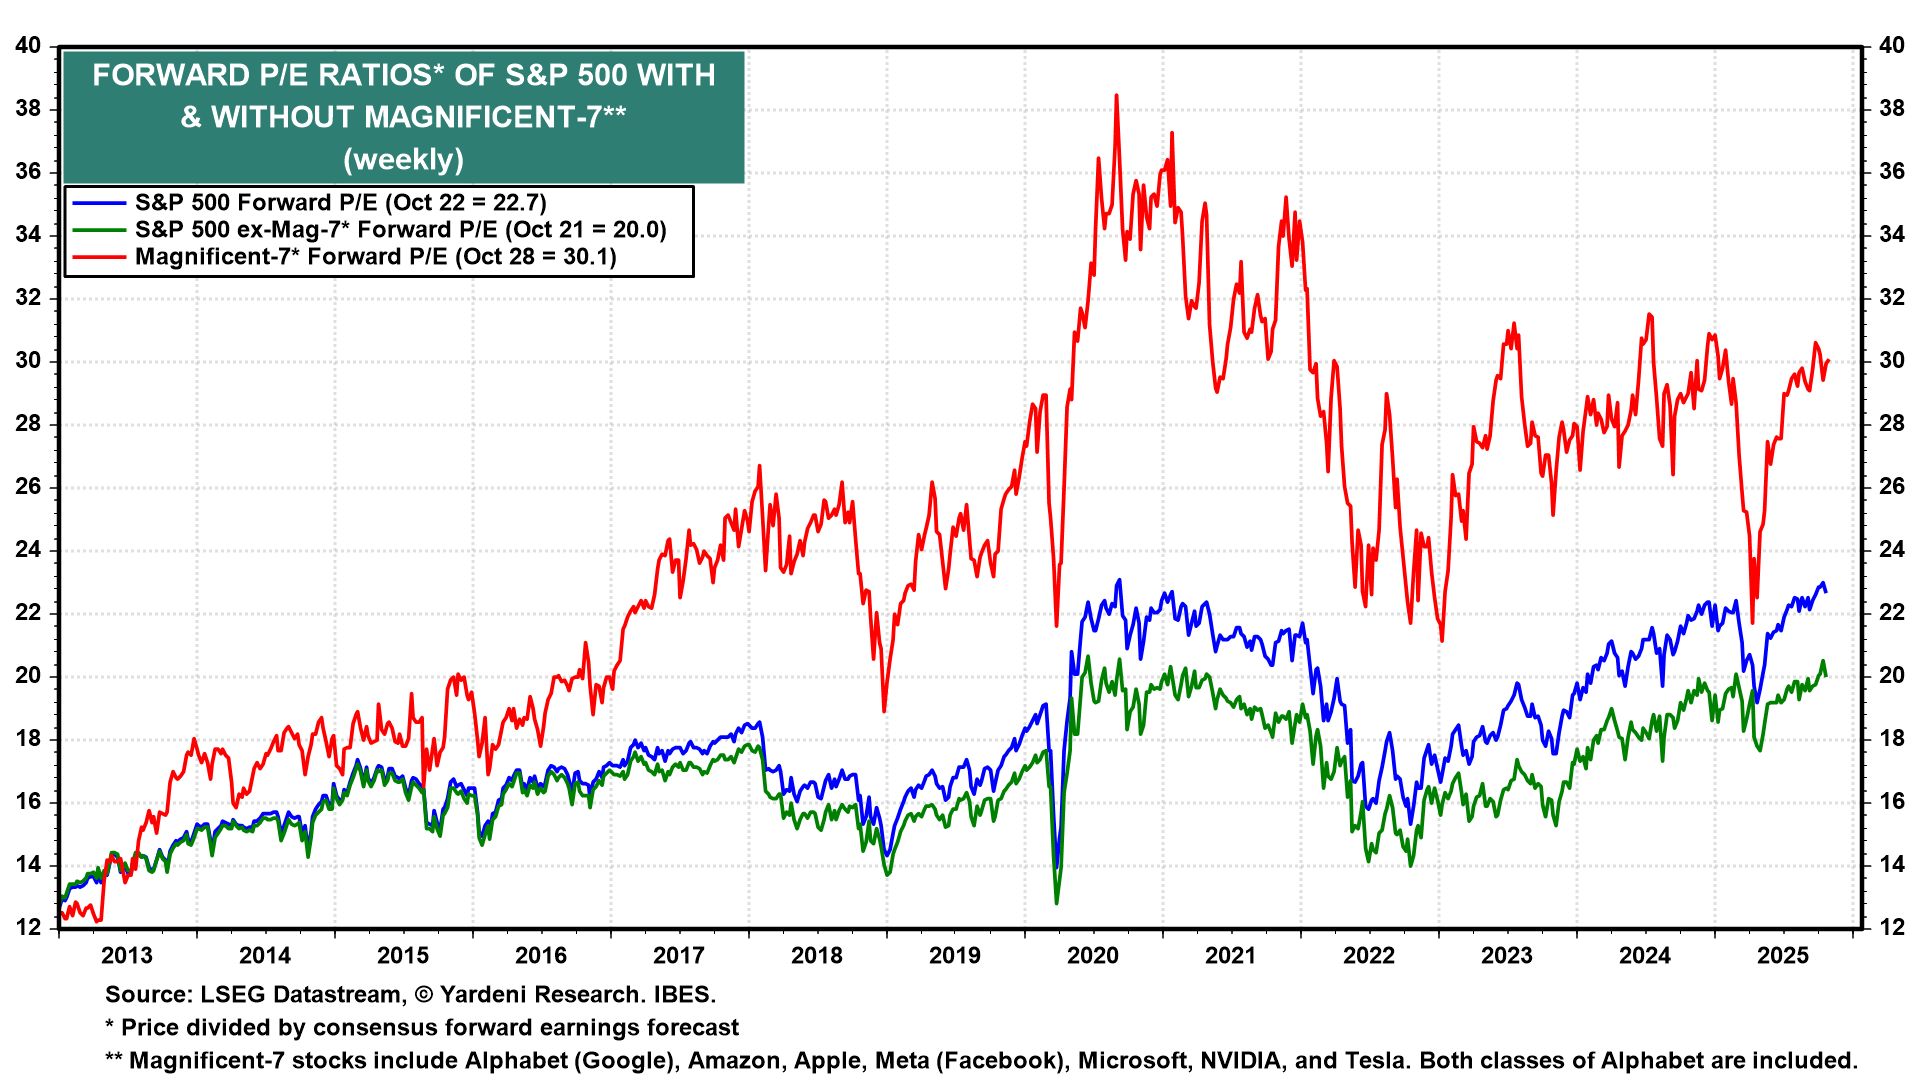
The widespread concern about the sustainability of the bull market is that S&P 500 valuation multiples are elevated (chart). We don't think this poses a problem unless we are wrong about the resilience of the economy and a recession scenario becomes more likely.
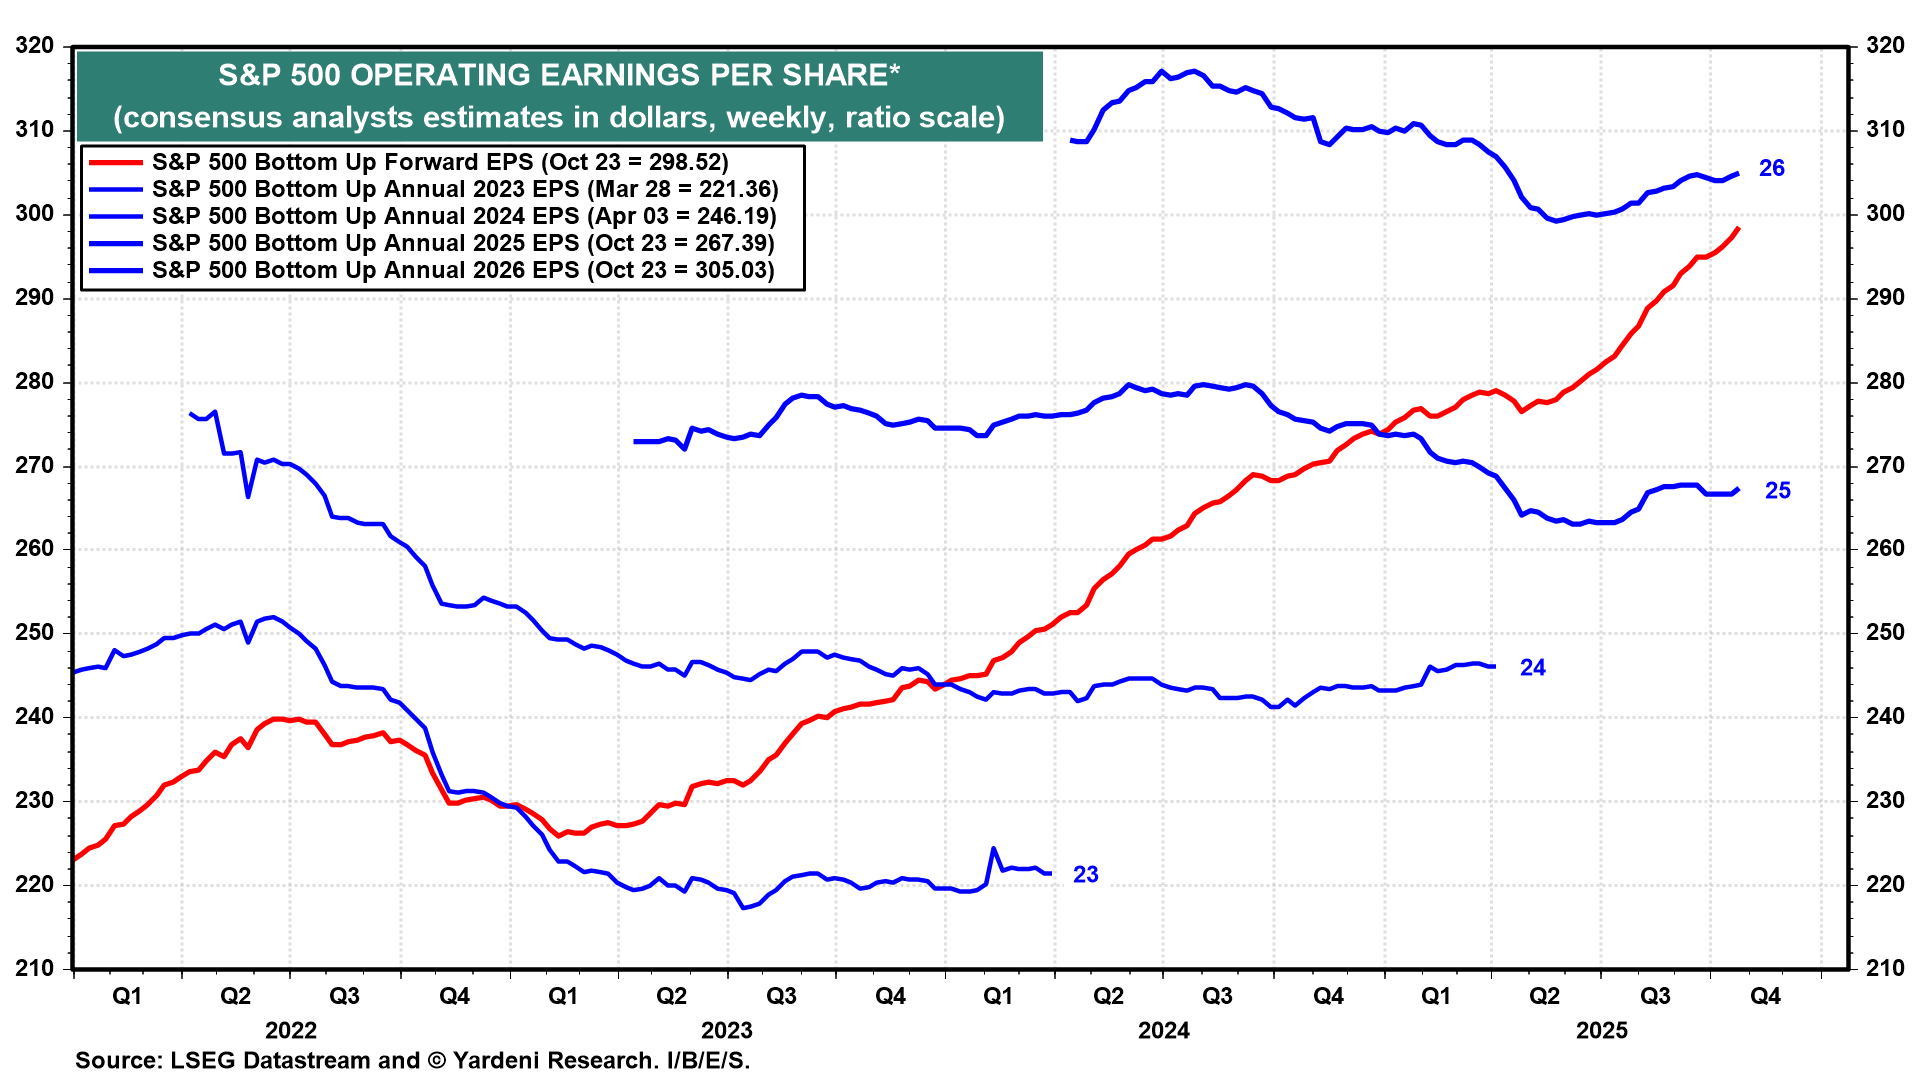
Meanwhile, our bullishness has significant tailwinds coming from earnings. S&P 500 forward earnings per share rose to another record high of $298.52 last week (chart). At Friday's close, the forward P/E was 22.8. Forward earnings is converging toward the analysts' 2026 consensus earnings estimate, which edged up last week to $305.03 per share.
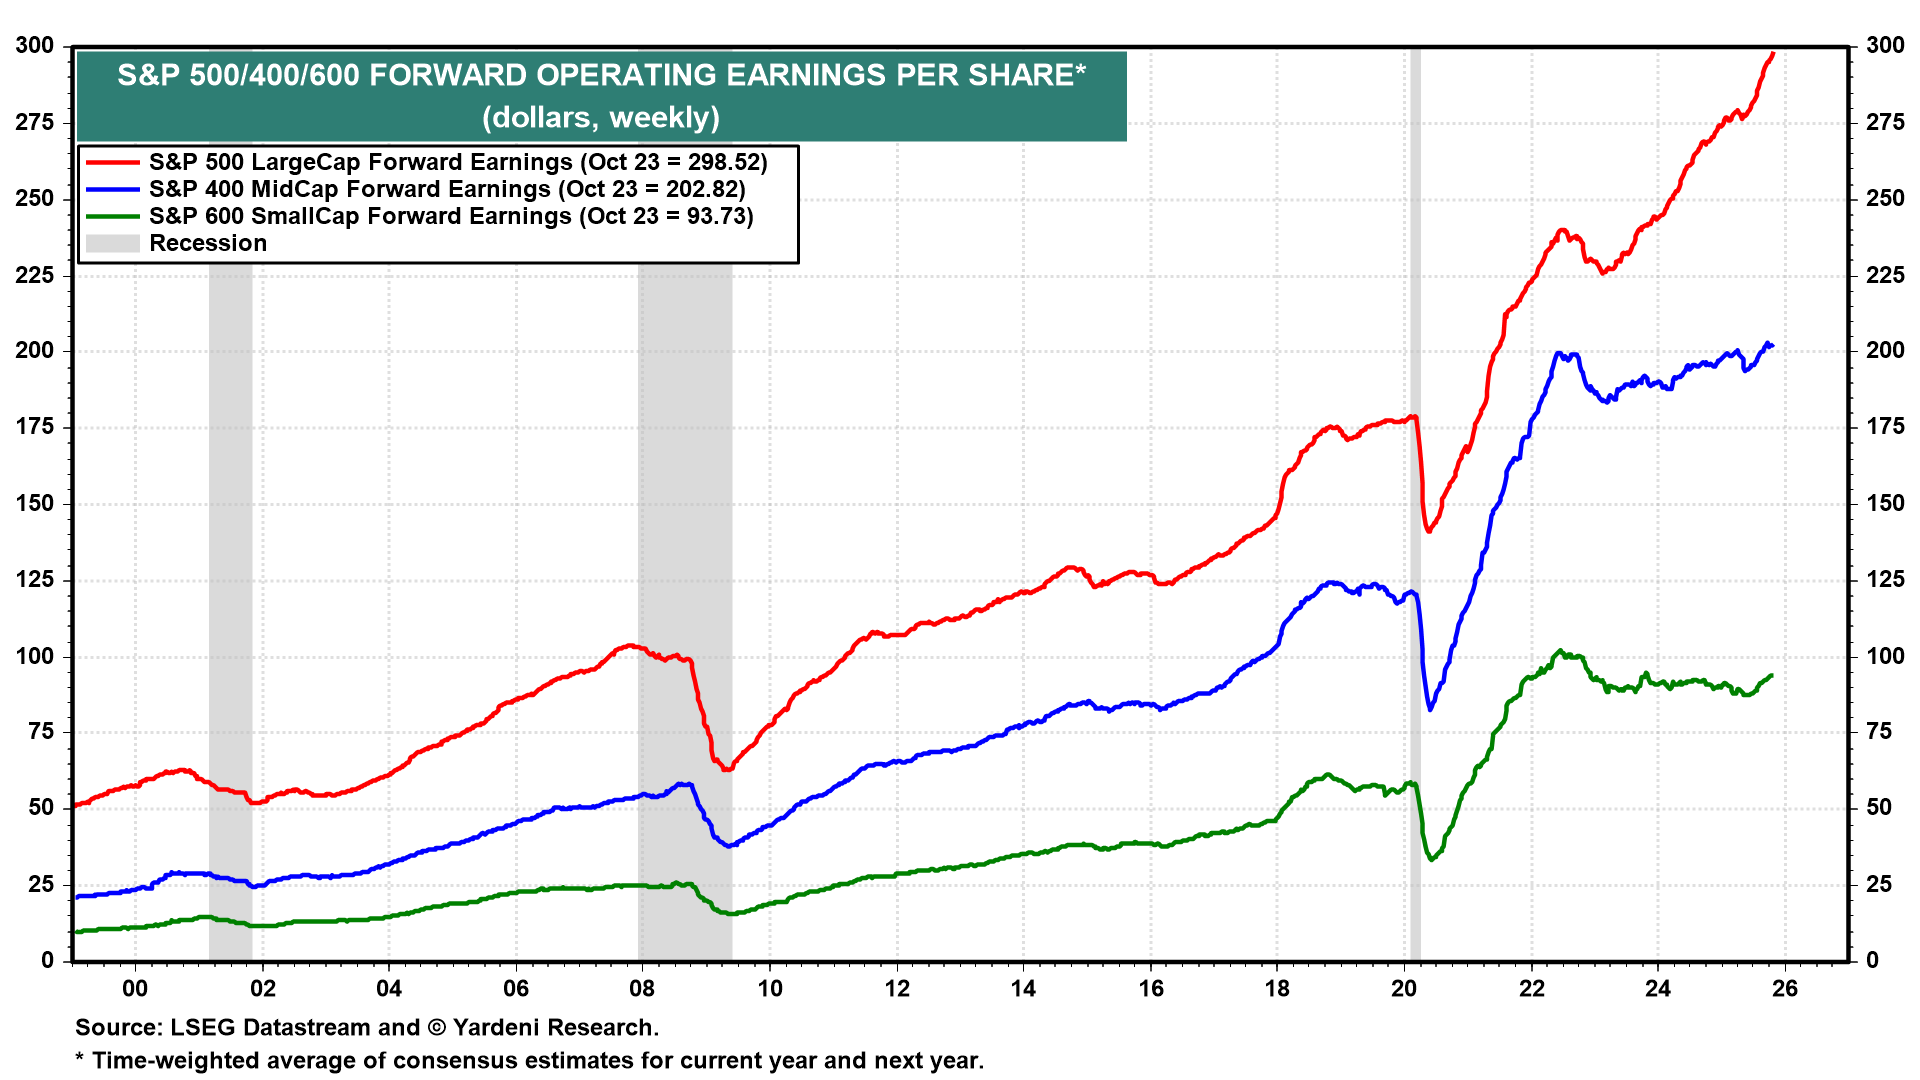
Both the S&P 400 MidCaps and the S&P 600 SmallCaps have yet to exceed their record highs hit at the end of last year. That's because their forward earnings have been stuck in the mud since mid-2022. Their recent recoveries have been lackluster (chart).
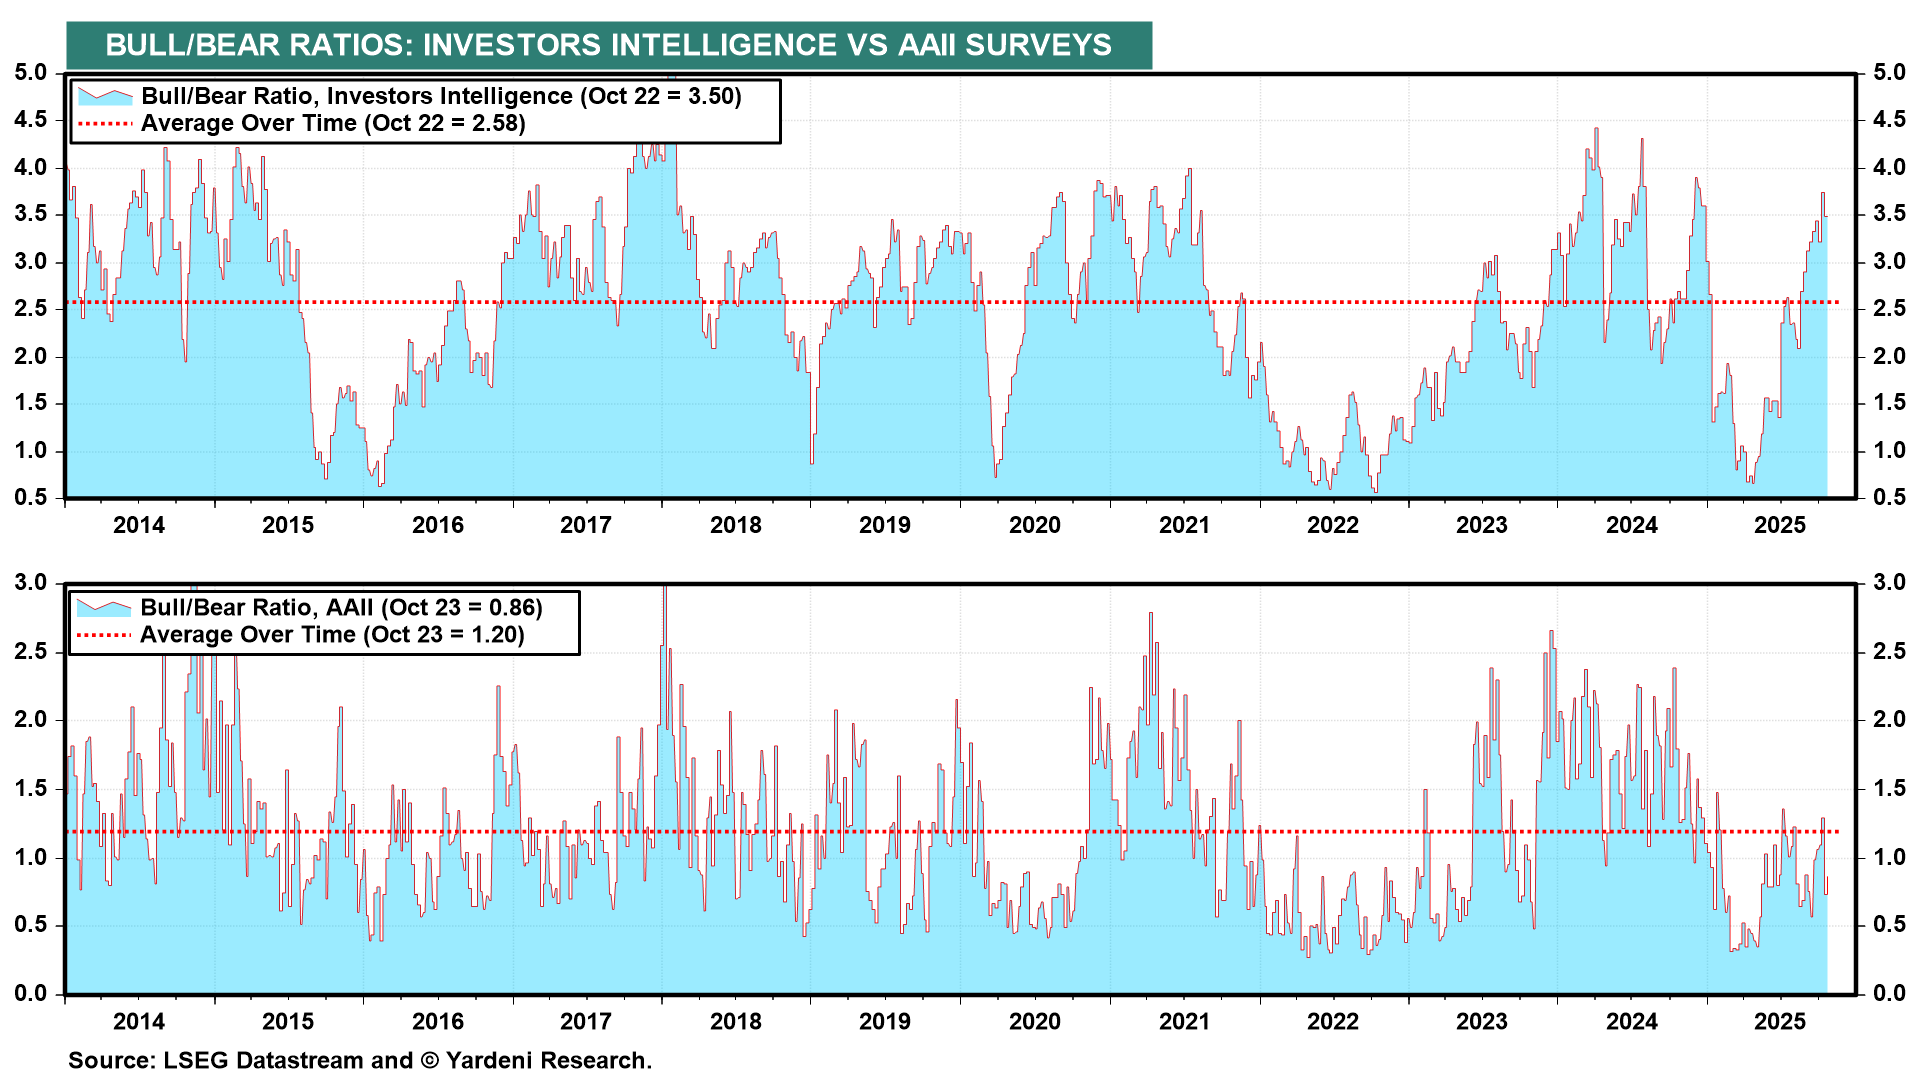
Investors Intelligence Bull/Bear Ratio (BBR) probably rose above 4.00 this week. The result will be reported on Wednesday. Readings above 3.00 can be contrary indicators, suggesting that there are too many bulls and that a pullback is imminent. In our experience, the BBR measure works better as a buy signal when below 1.00 than as a sell signal when above 3.00.
Flying to the moon is safer than flying closer to the sun, as the myth of Icarus—whose wax wings melted—reminds us. In our base-case scenario, the stock market is on Sinatra's moonshot course.