The S&P 500 broke out of its summer range this week to yet another record high. The index closed at 7,757.64 on Friday, clearing the 7,500 level it had circled since May 14. The index is 3.5% above its 50-day moving average and 9.8% above its 200-day moving average. Those are not extreme readings.
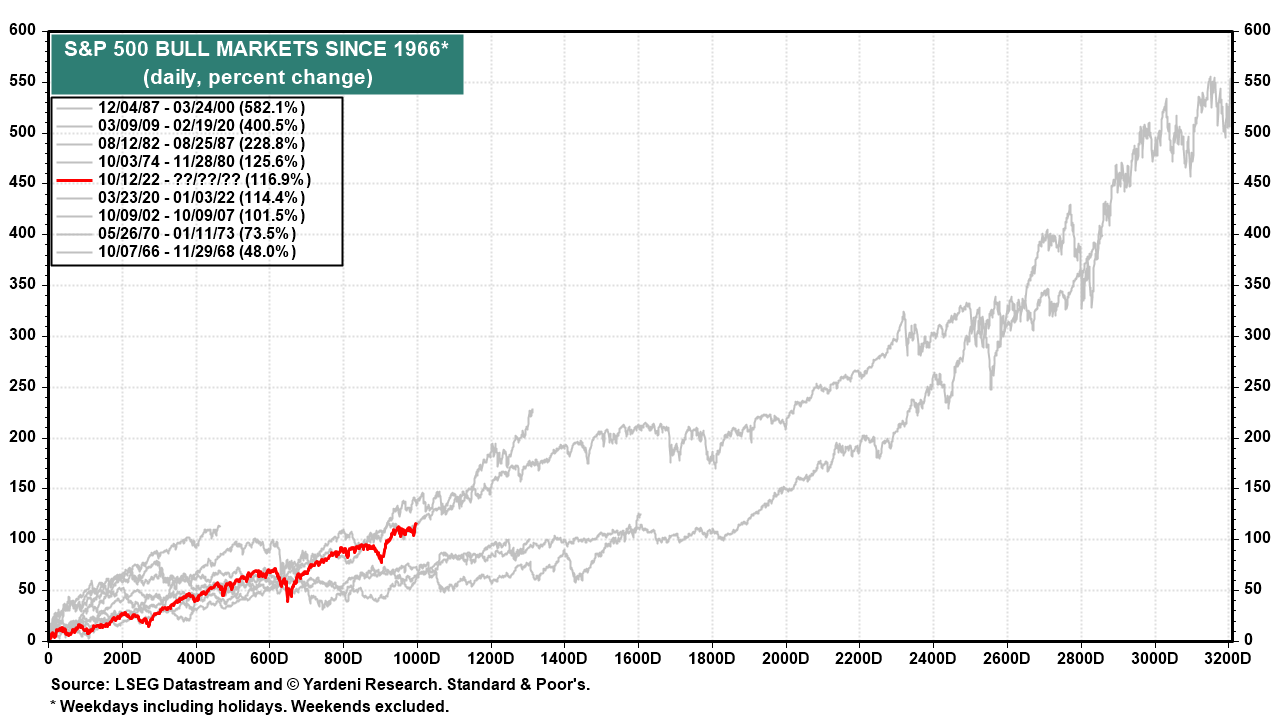
The breakout is a good moment to ask where this bull market fits in the historical record. The answer is that it's in the middle. That is a more bullish finding than it sounds. Bull markets do not die of old age or of accumulated gains. They usually die when earnings roll over.
The current bull market has been compared to the dot-com era's meltup/meltdown scenario. If the late 1990s ended with a stock-market meltup, will the late 2020s do the same? Back then, it was a FOMO-driven meltup; everyone feared being left out. This time, FEMO, or fabulous earnings momentum, is the driving force.
Here's more:
(1) History. In the current bull market, the S&P 500 is up 116.9% since it began on October 12, 2022 (chart). That ranks fifth of the eight bull markets since 1966. Investors who believe this market has run too far should look at what running too far can actually look like.
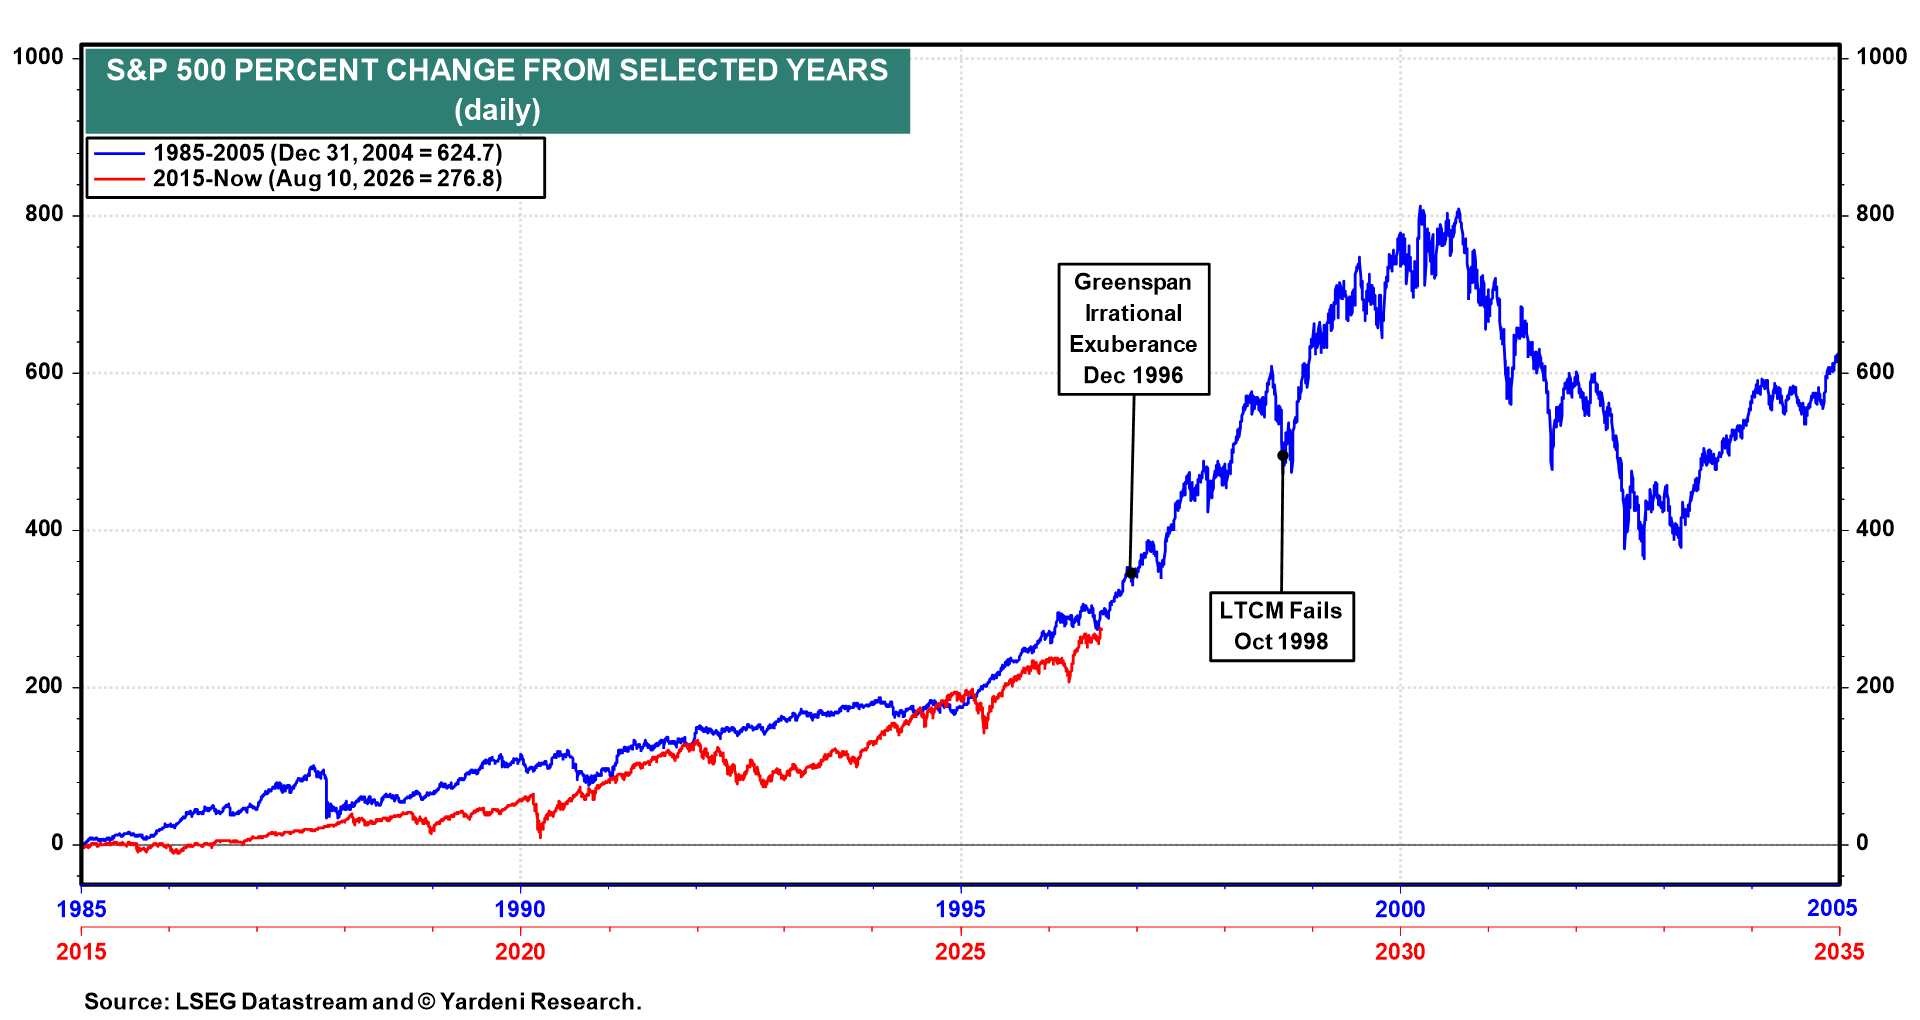
Overlay the current period starting in 2015 on 1985-2005, and the two paths track each other closely, with the current run at 276.8% since 2015 (chart). If the analog continues to hold, the market keeps climbing, and the interesting years are ahead rather than behind.
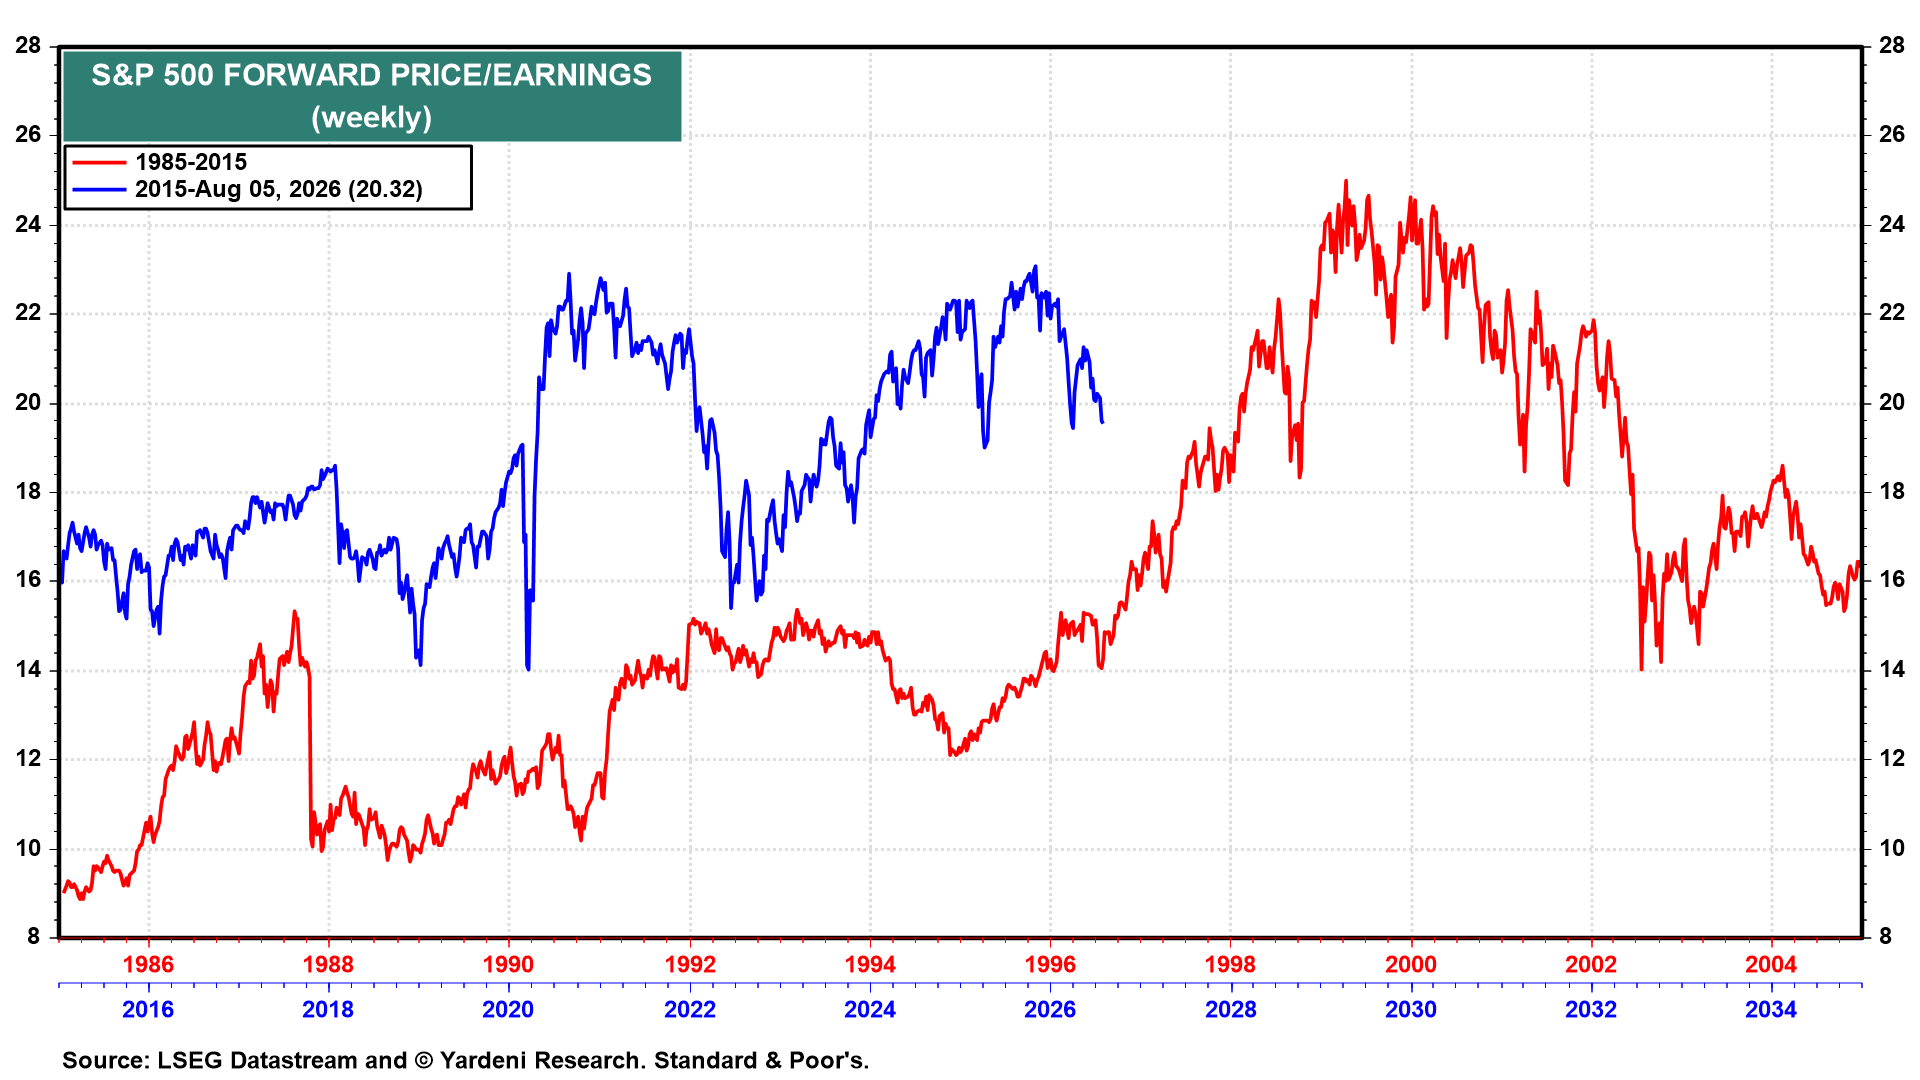
That brings us to the meltup question. Valuation multiples are higher today than they were heading into the Tech Wreck of the late 1990s (chart). So a meltup from here would more likely be an earnings-led meltup than a valuation-led meltup. It would be a FEMO one rather than a FOMO one.
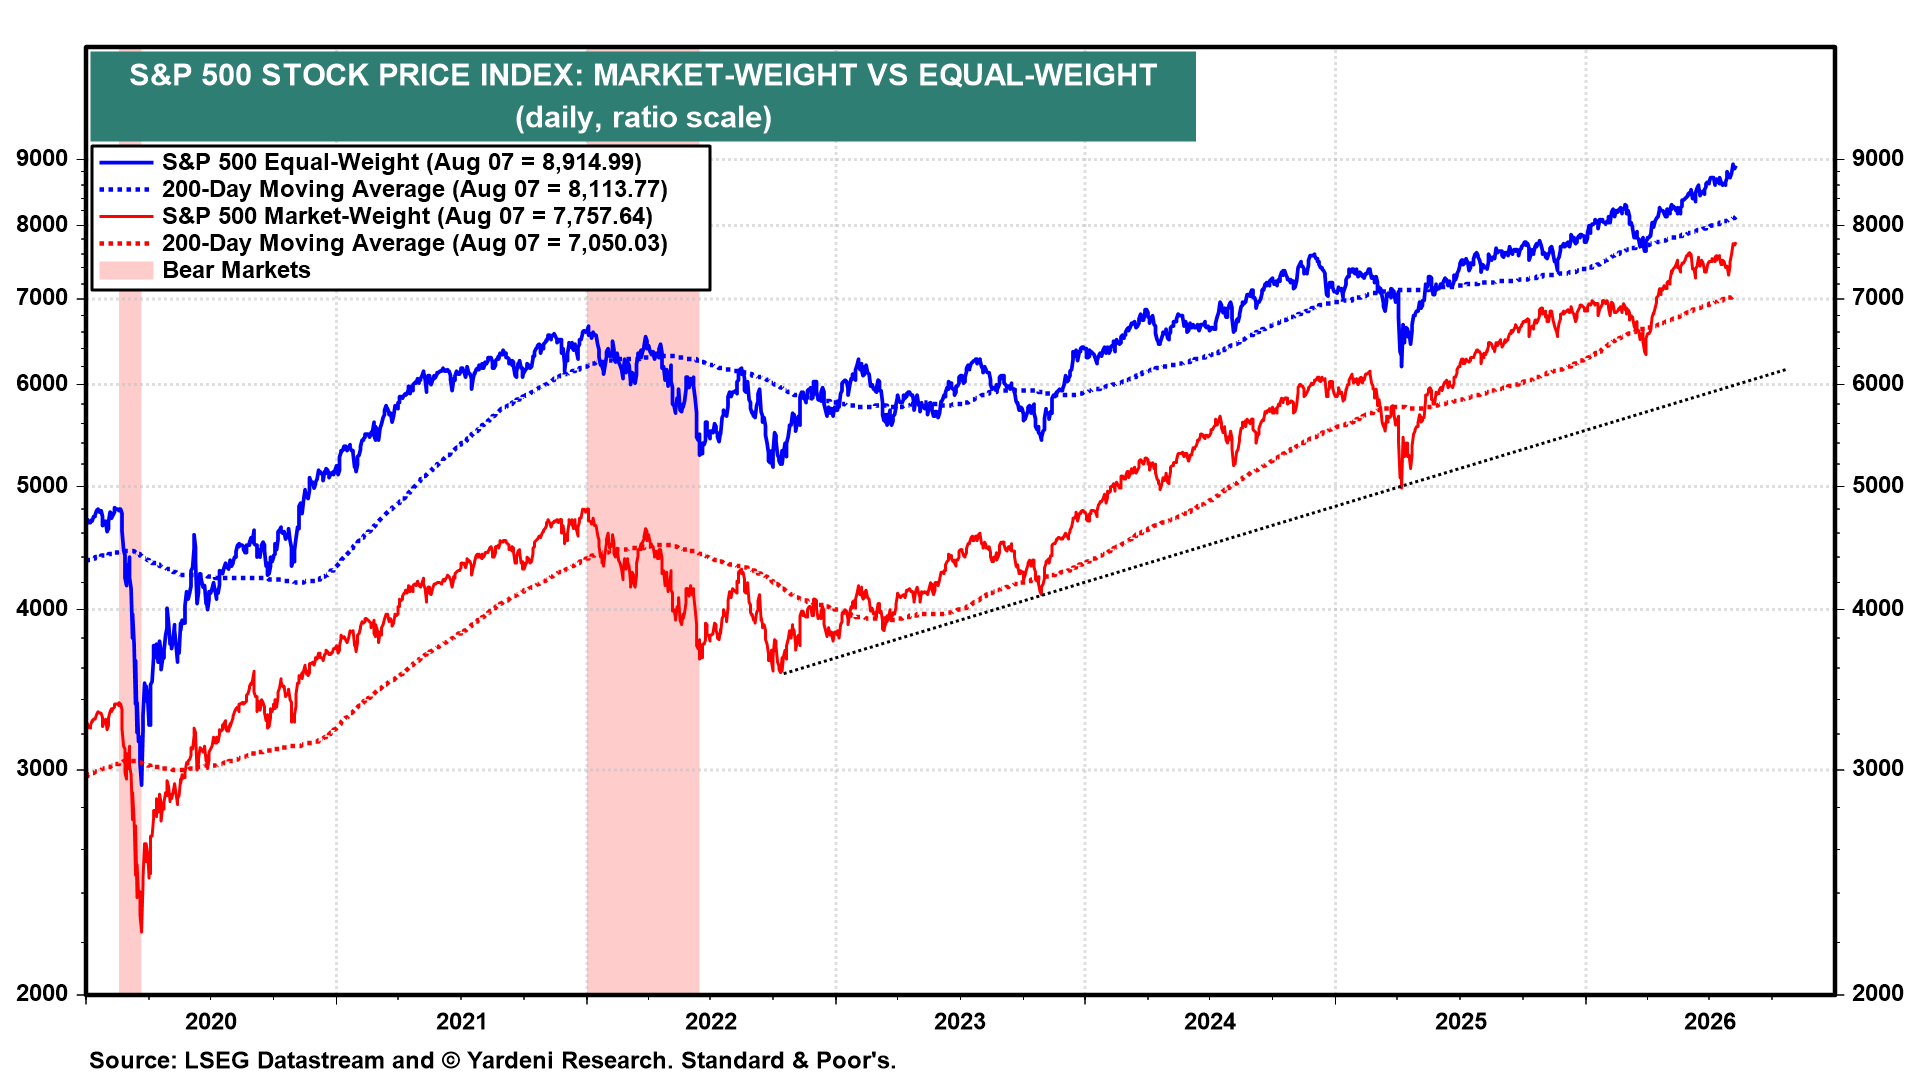
(2) Performance. The S&P 500 equal-weight and market-weight indexes both rose to record highs last week (chart).
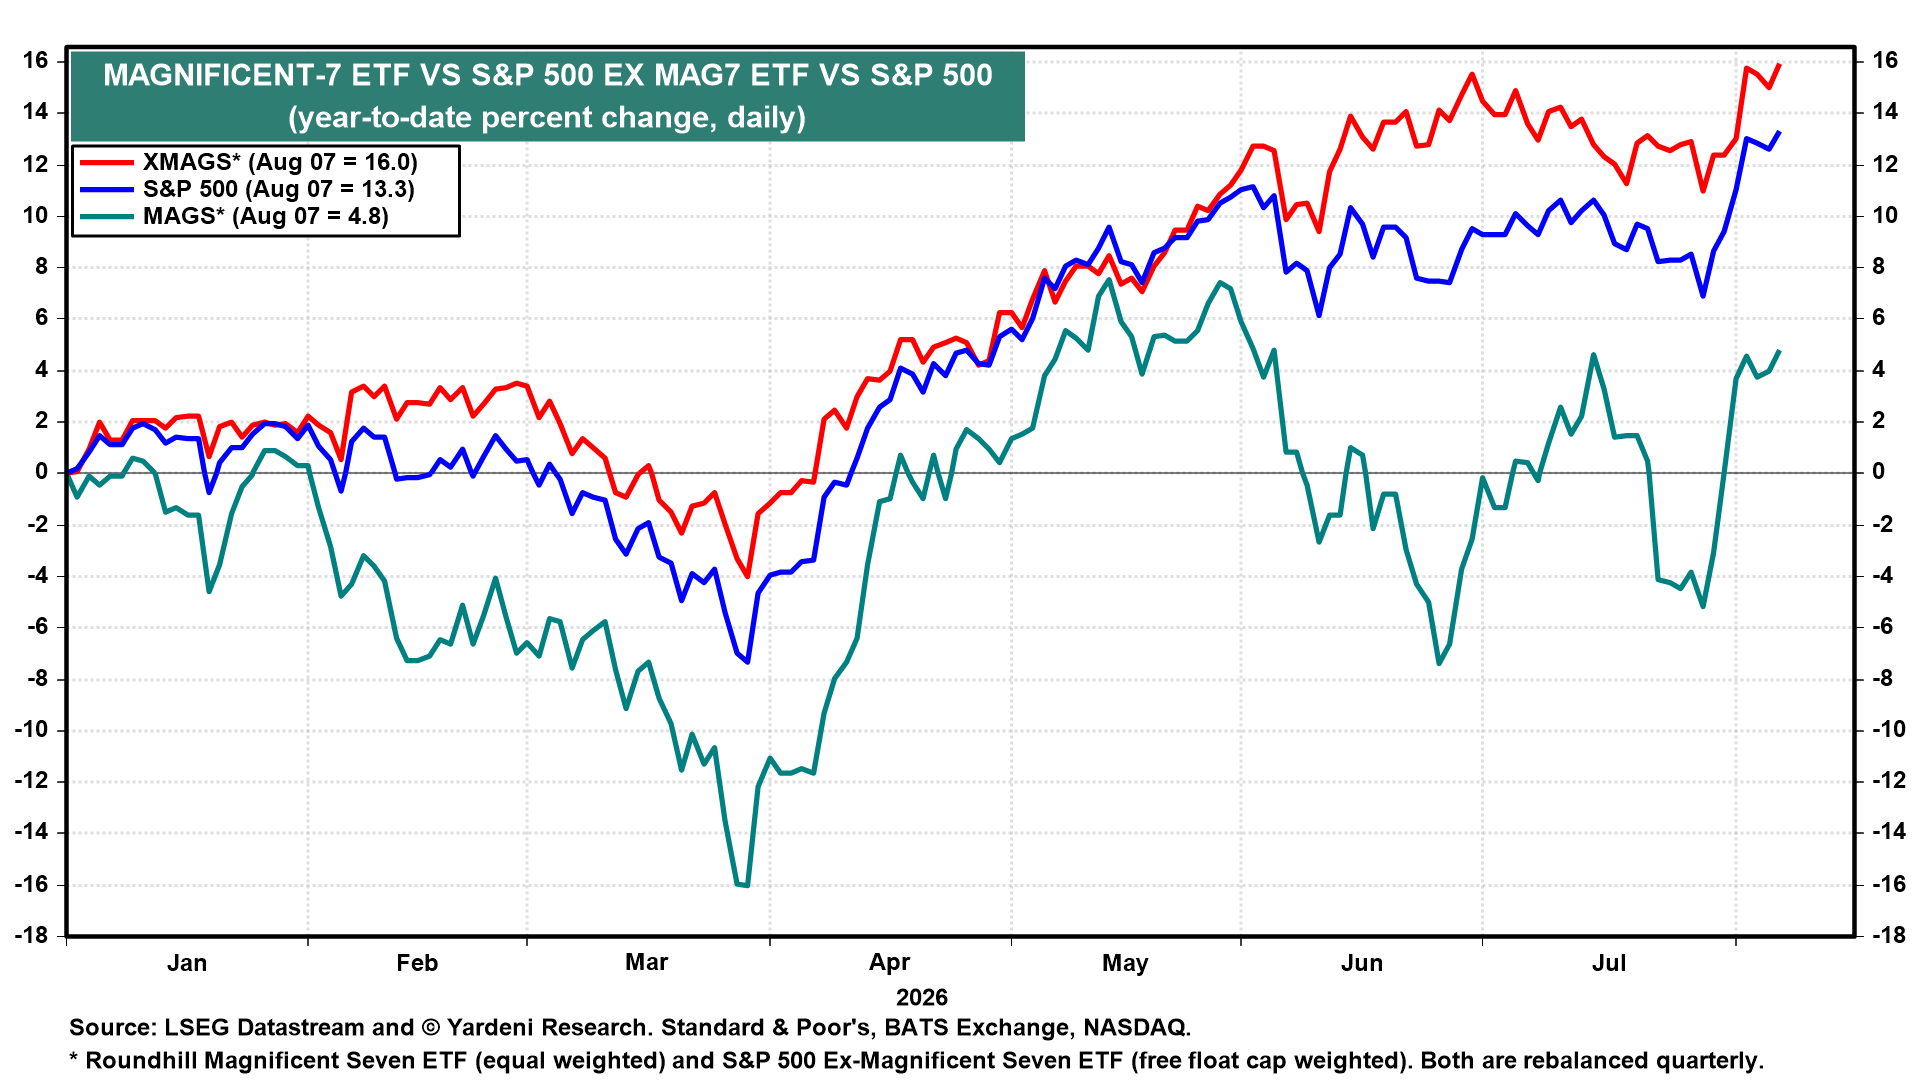
The Impressive 493 is up 16.0% ytd, compared with 13.3% for the S&P 500 and 4.8% for the Mag-7 (chart). The Mag-7 has recovered ground since the hyperscalers reported, closing part of a performance gap that was much wider in June.
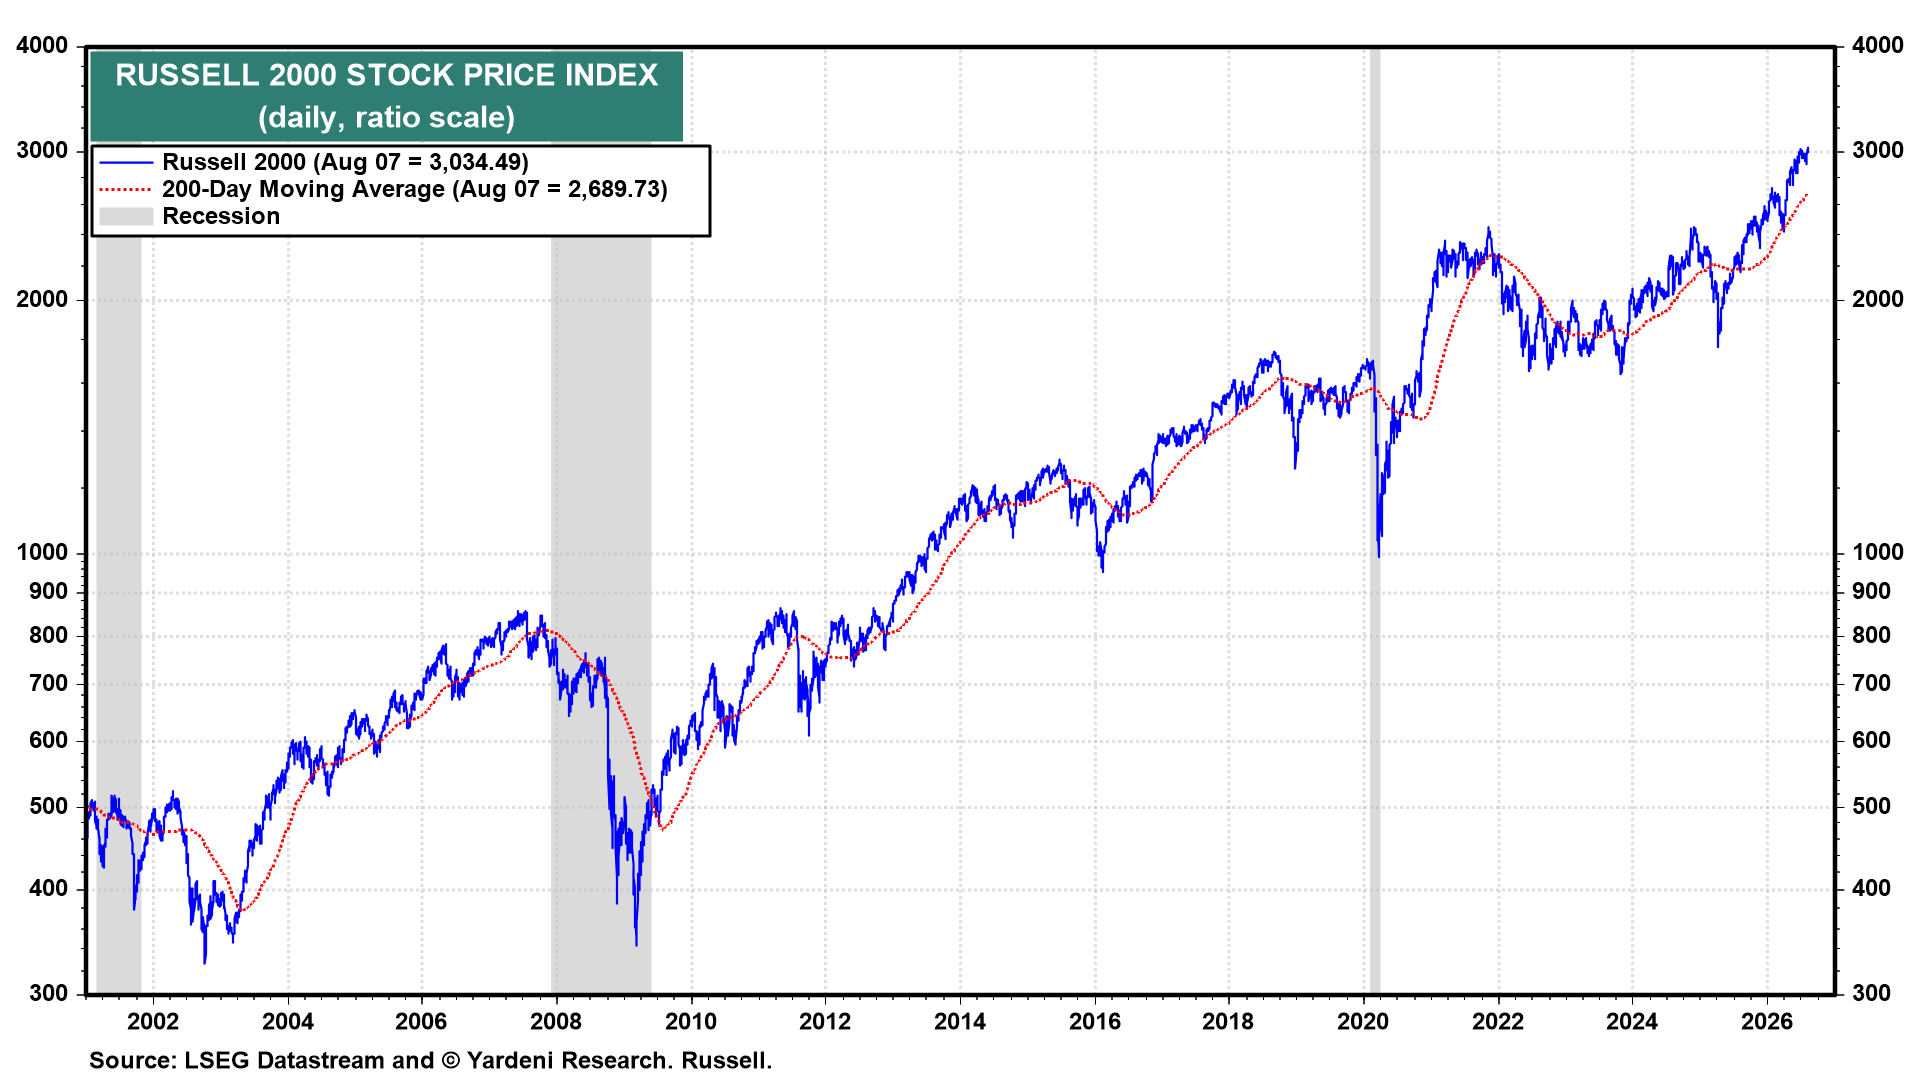
The Russell 2000 also rose to a record high last week (chart). SmallCaps do not lead when investors are positioning for a recession.
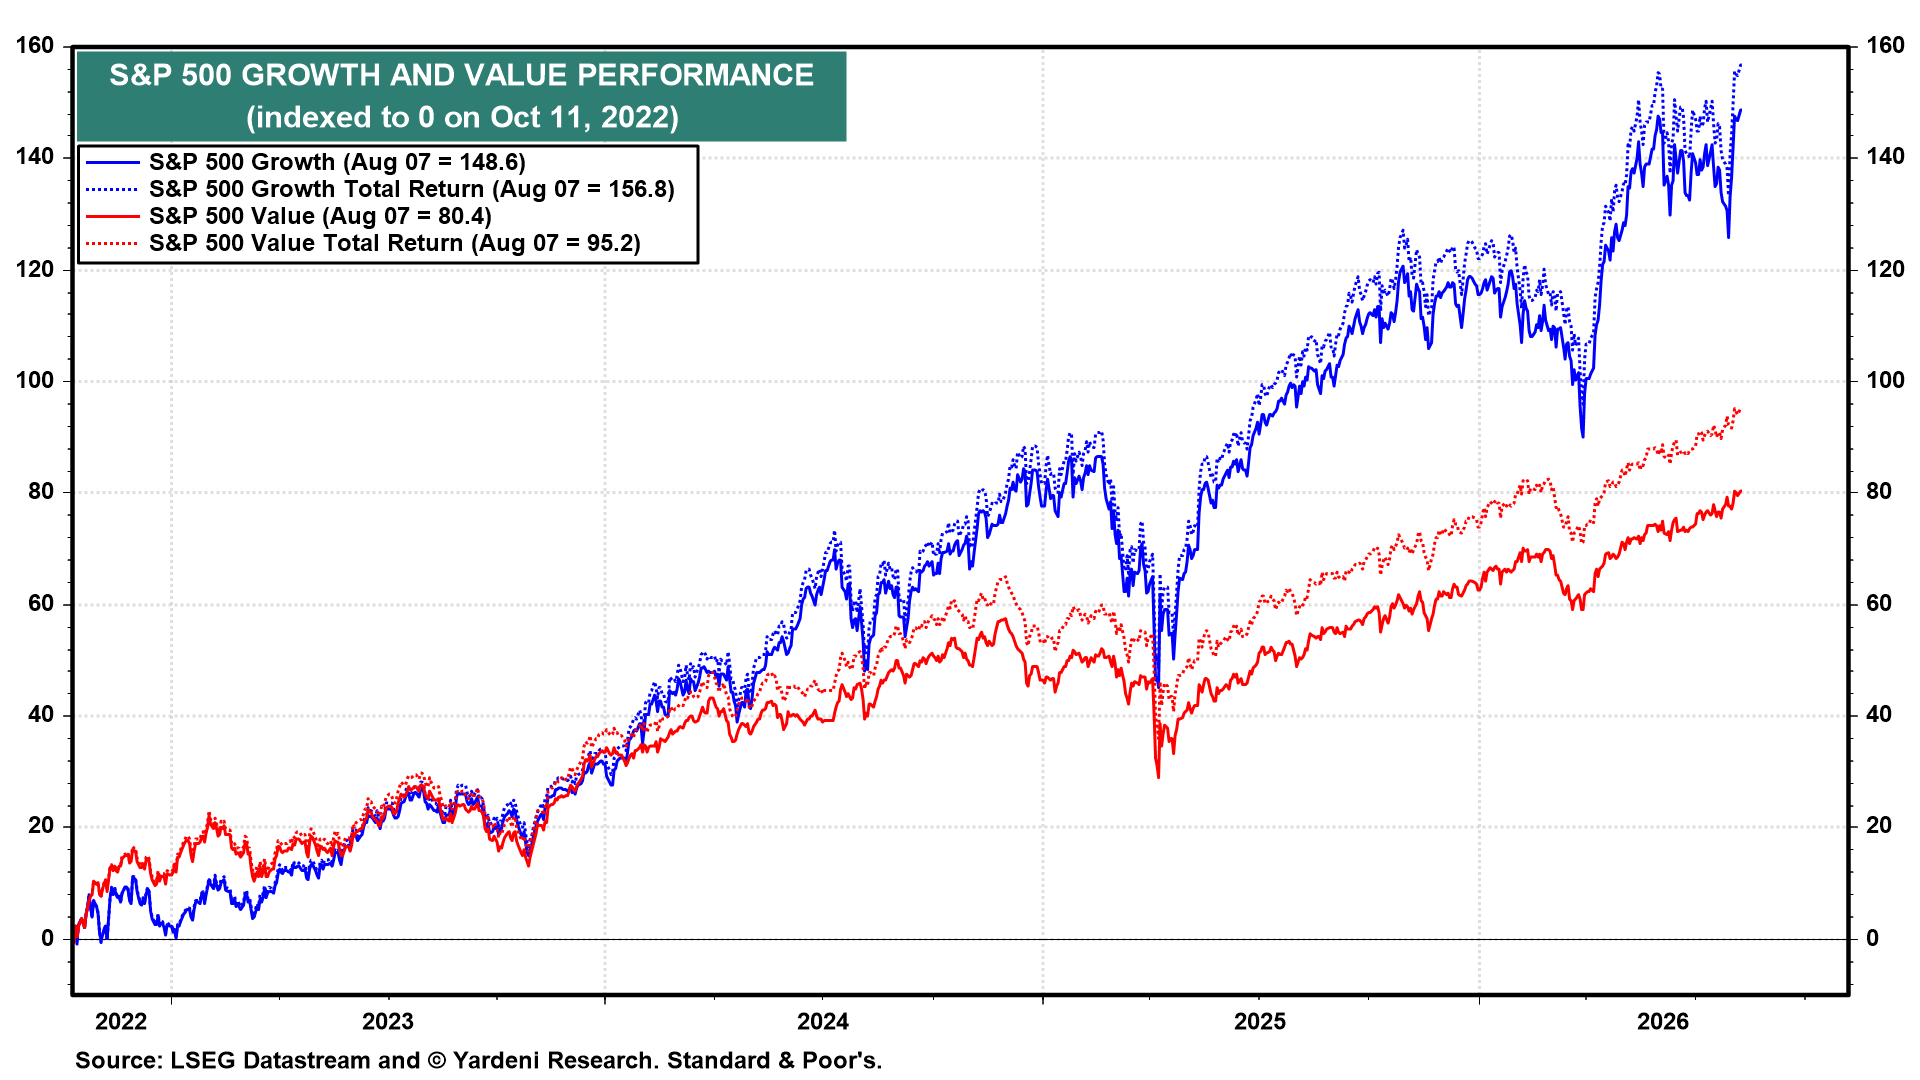
(3) Growth vs Value. The S&P 500 Growth and S&P 500 Value indexes both rose to new record highs last week (chart).
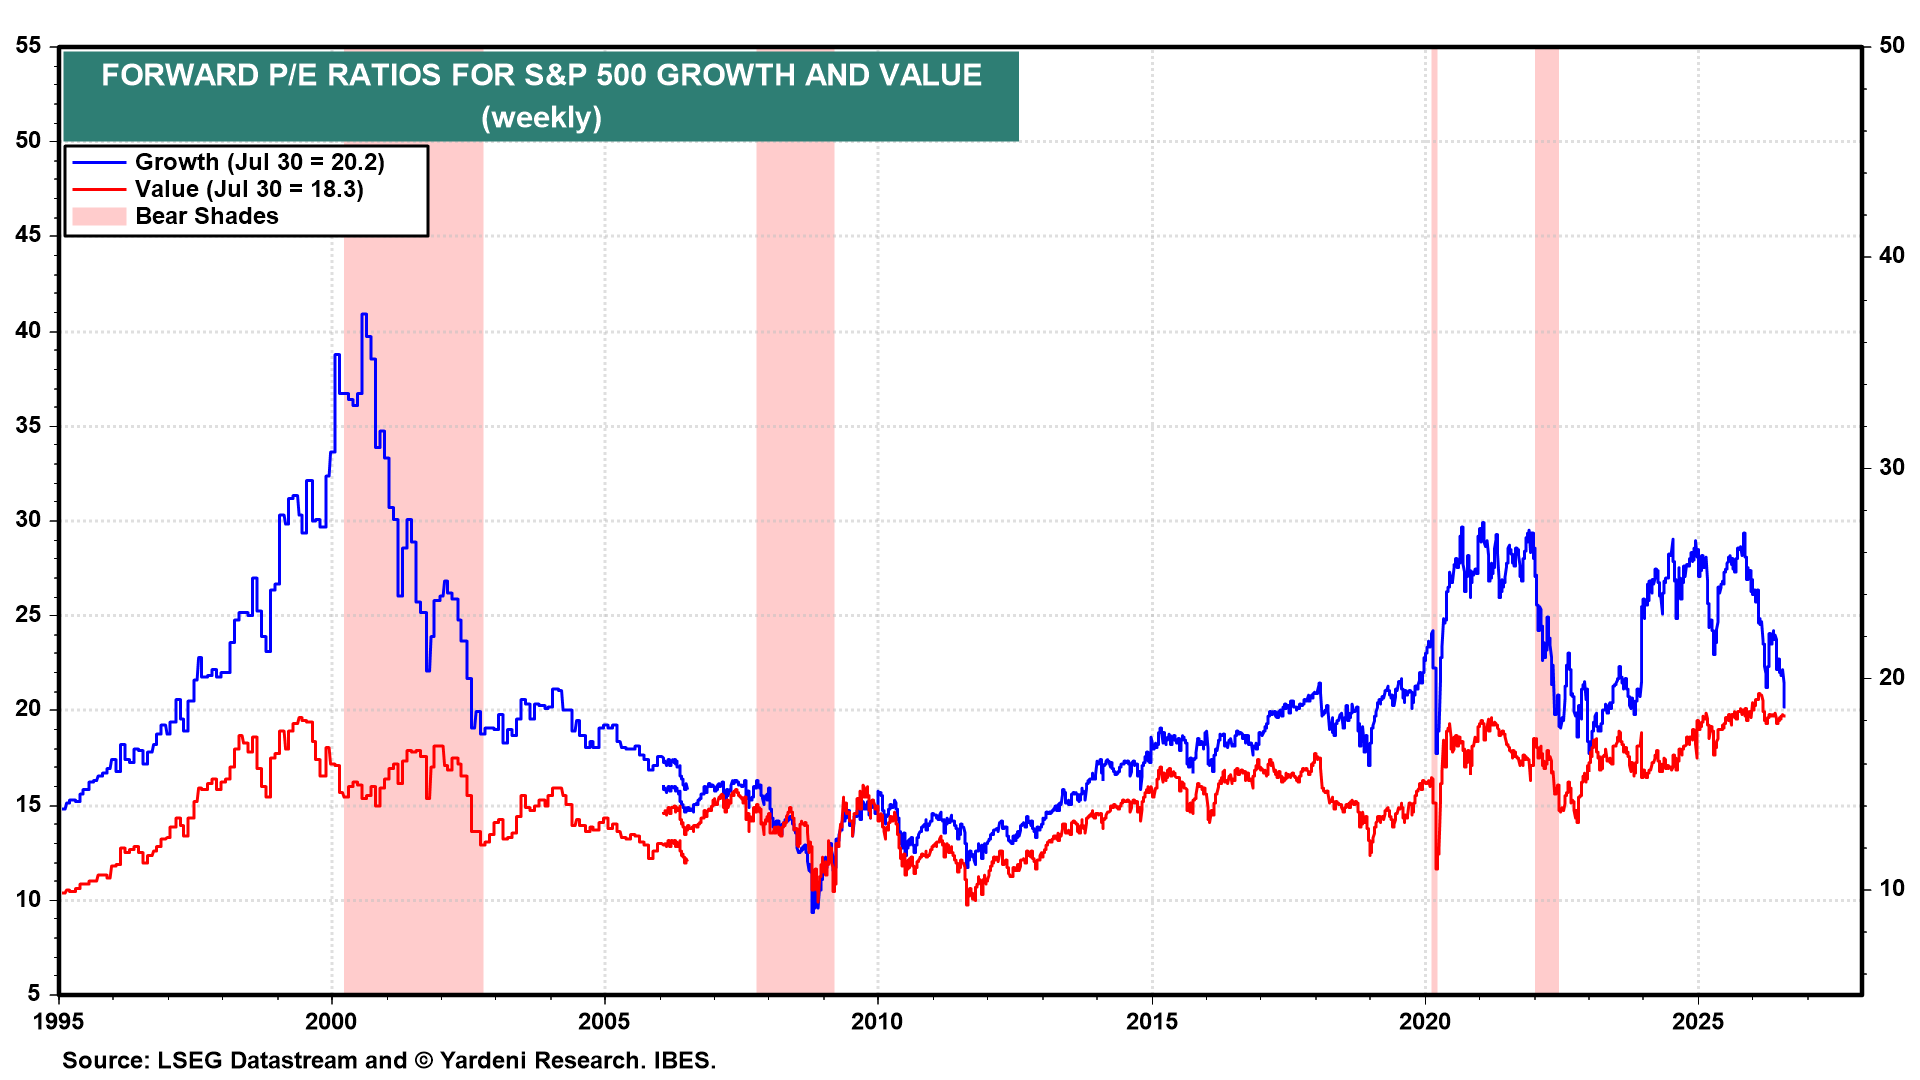
The forward P/E of S&P 500 Growth has fallen to 20.2, against 18.3 for Value (chart). Investors who worry about a replay of the dot-com episode should note that Growth traded above 40.0 in 2000. The valuation case for that comparison has diminished considerably. Note that Growth's forward earnings recently has been boosted by mark-to-market (MTM) capital gains, thus lowering the forward P/E.
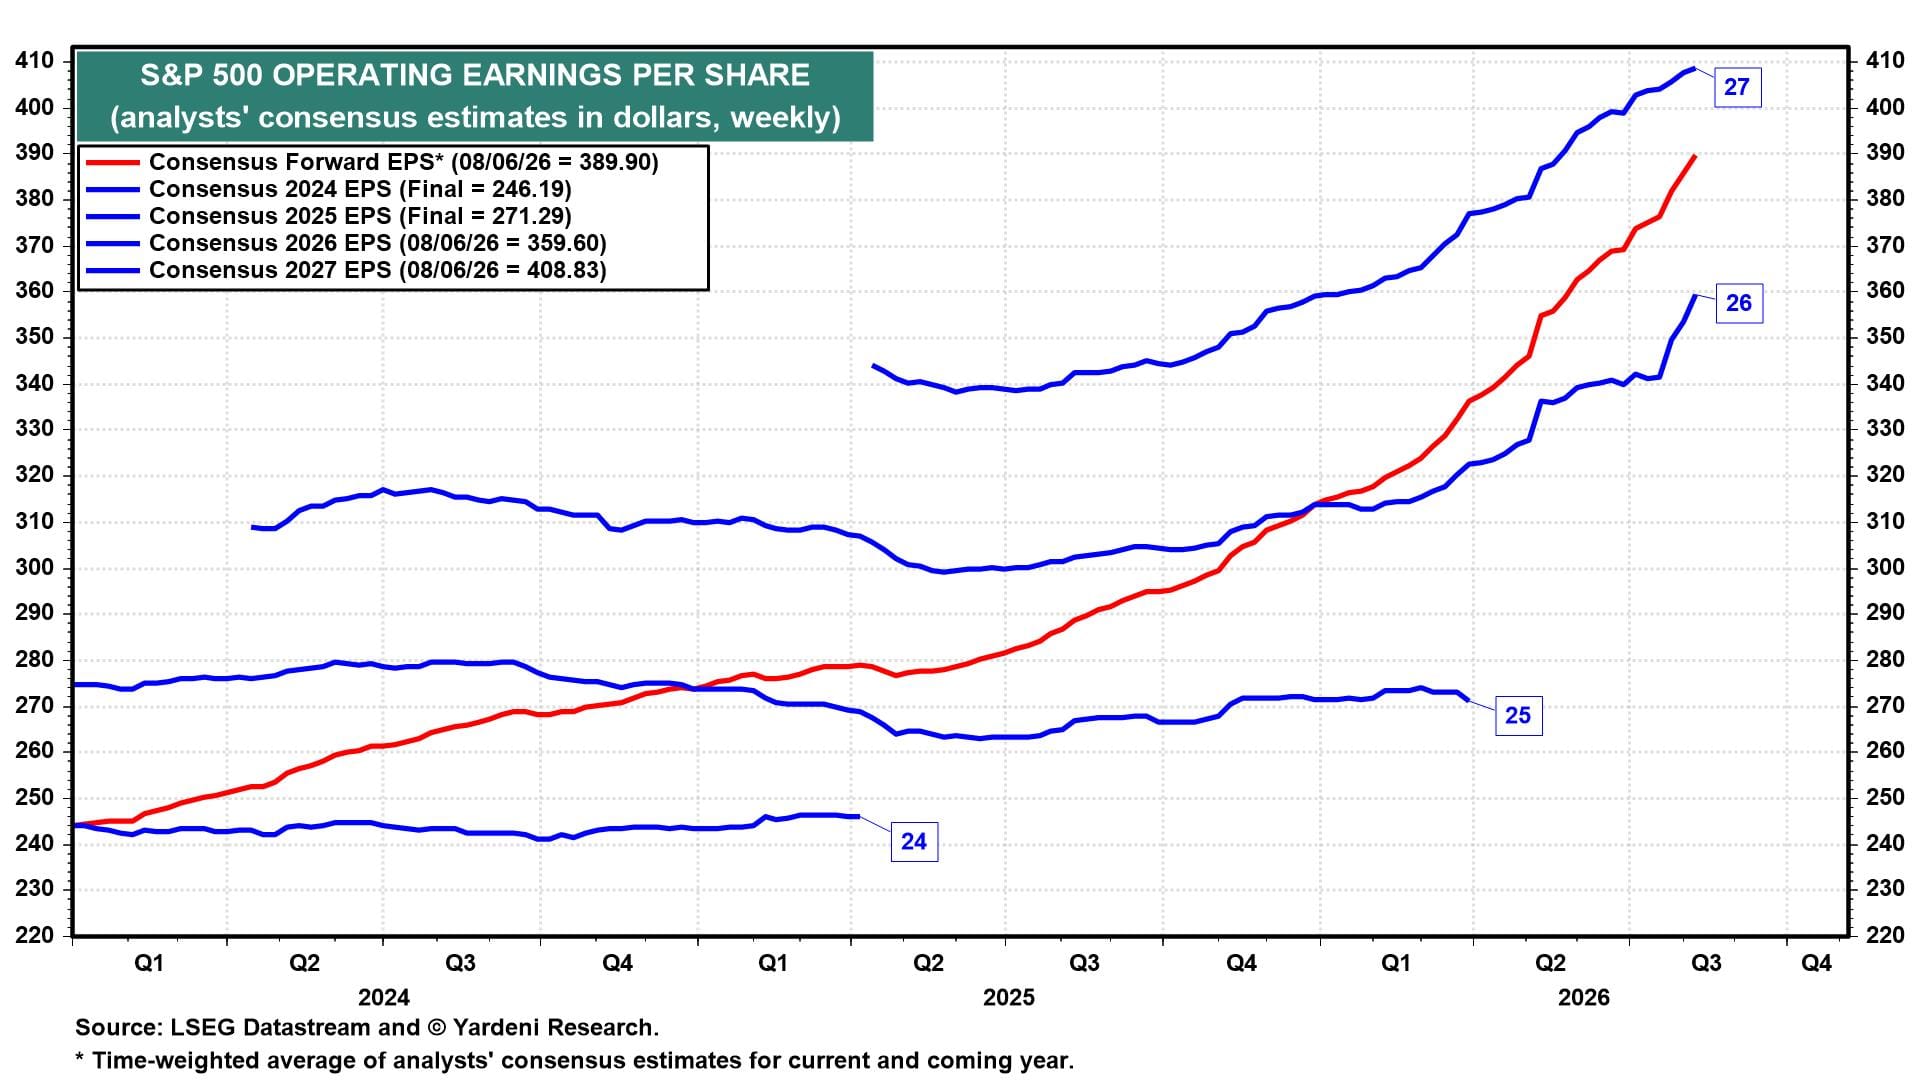
(4) Earnings. FEMO continues to drive the bull market. Forward earnings, currently at $389.90 per share, is converging toward the analysts' 2027 EPS consensus (currently at $408.83) as this year progresses (they’ll match by the end of the year) (chart). The latter has been continuing to rise, and so has the 2026 consensus EPS estimate, which has been boosted over the past few weeks by MTM gains.
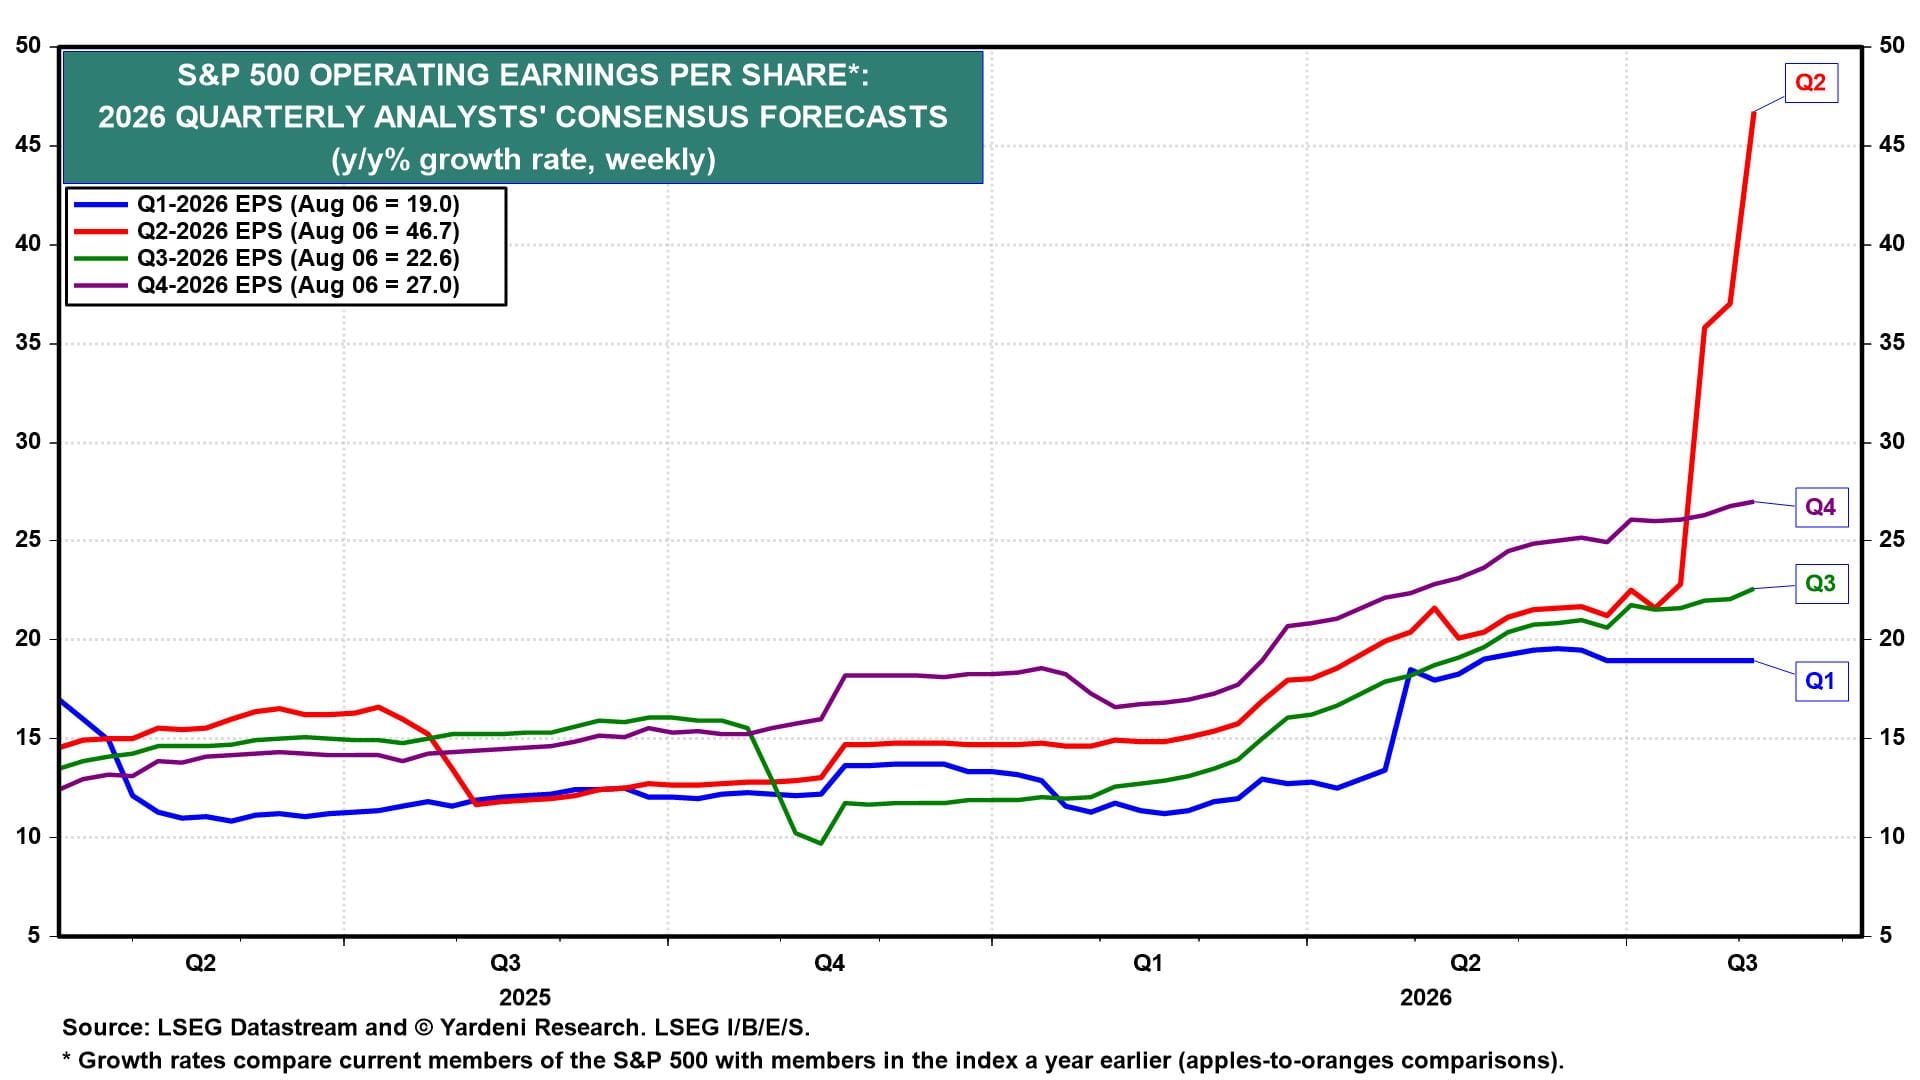
The 2026 quarterly picture is strong across the board starting with Q1's 19.0% y/y (chart). The actual/estimated blended growth rate for Q2-2026 is a whopping 46.7%, up sharply in recent weeks. The current estimates for Q3 and Q4 are 22.6% and 27.0%. The Q2 spike reflects the MTM gains we have flagged for two weeks running. Q3 and Q4 carry no such distortion and continue to rise.
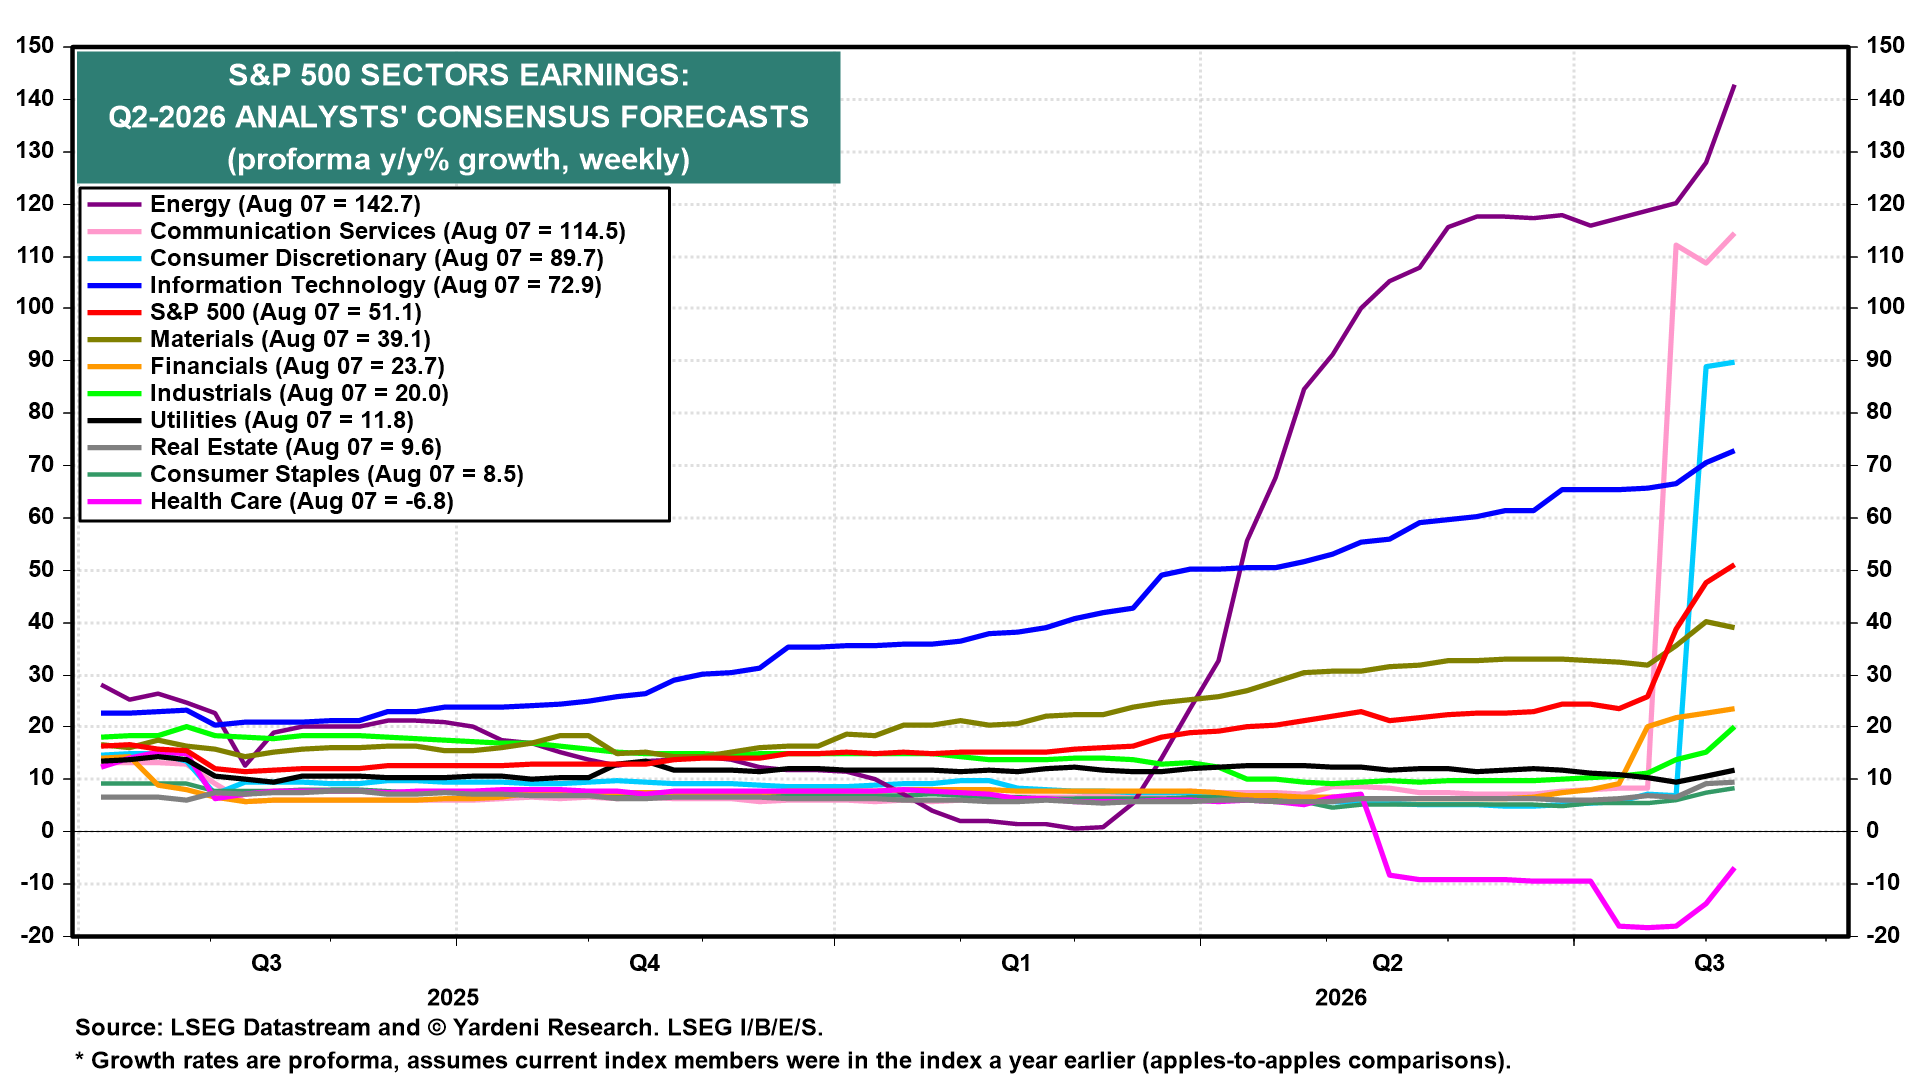
The sectors tell the same story, with the same caveat. On a pro forma basis, Q2 growth for the S&P 500 is 51.1%, with Communication Services and Consumer Discretionary both making big upside moves (chart). Alphabet's MTM gains drive the former, and Amazon's MTM gains drive the latter. Information Technology continues to climb firmly at 72.9% without the benefit of MTM gains. Energy and Health Care are the outliers at 142.7% and -6.8%.
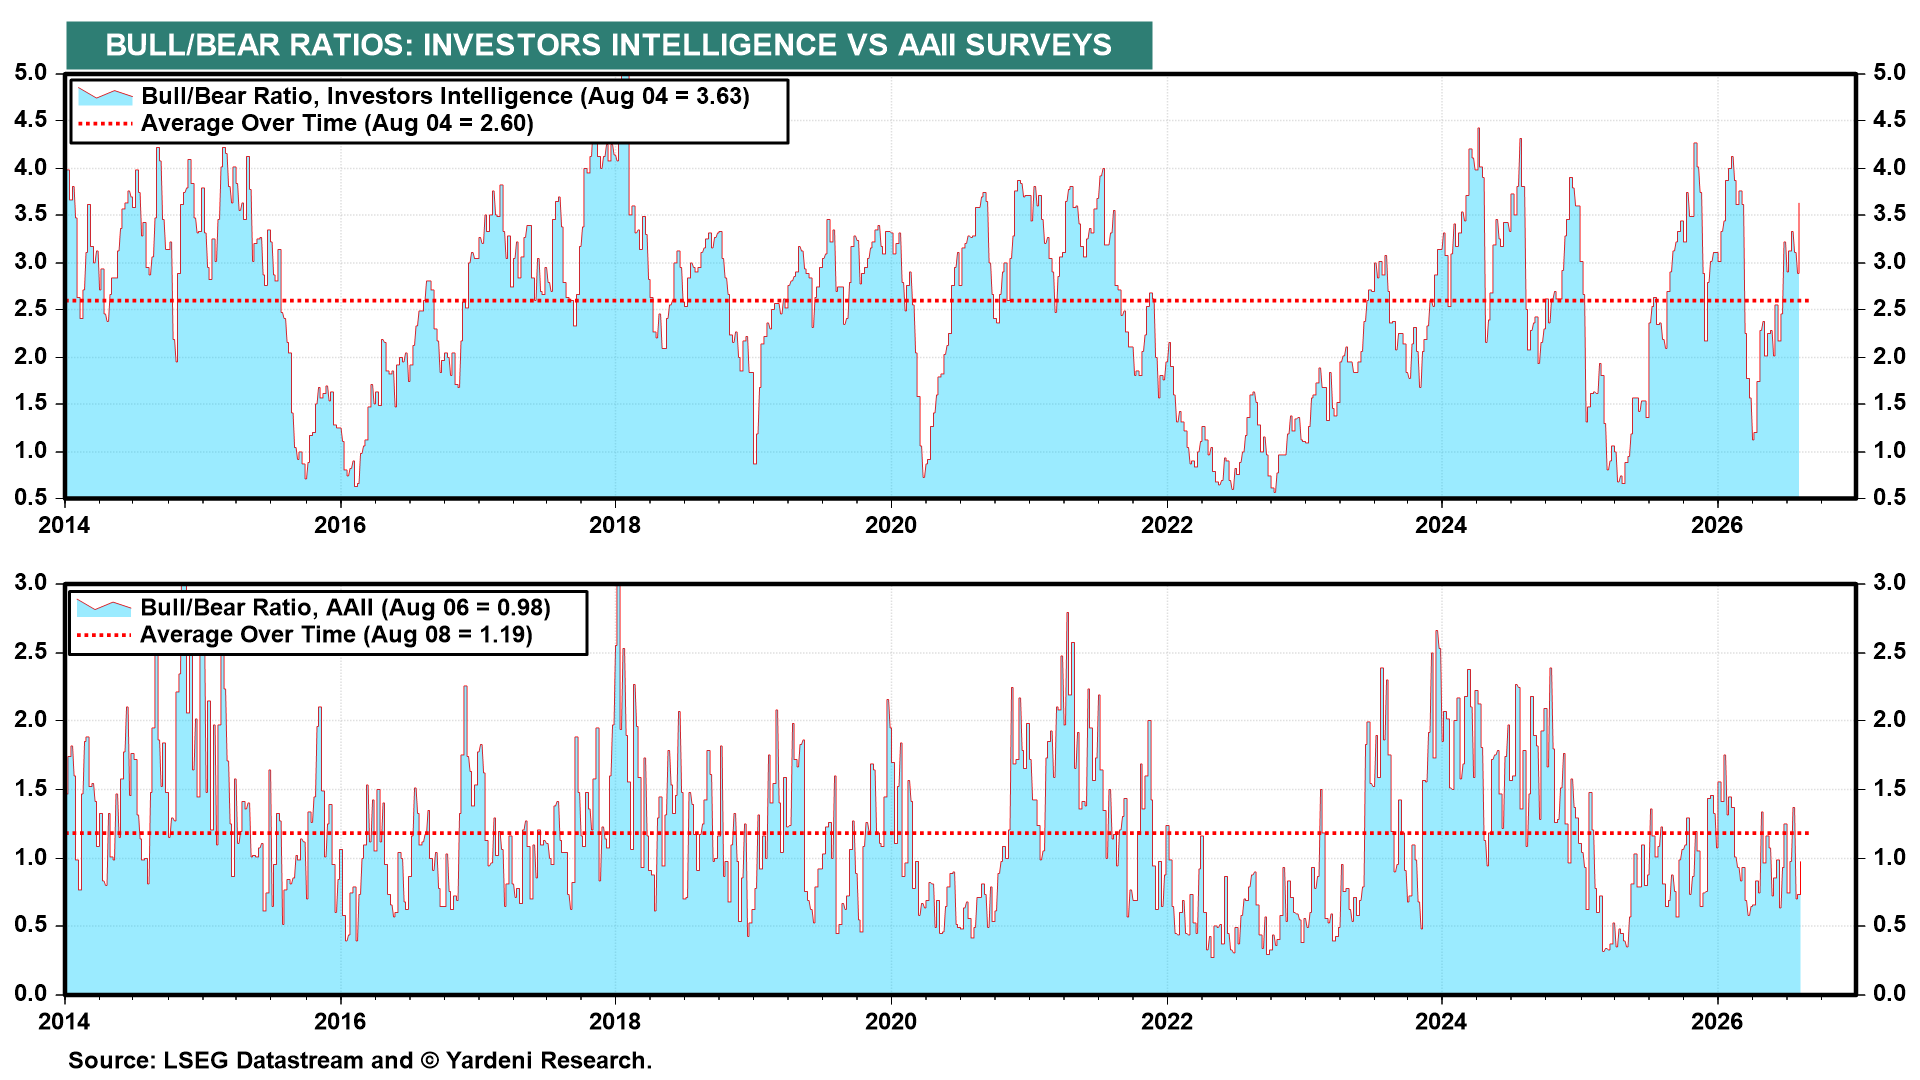
(5) Sentiment. The Investors Intelligence bull-bear ratio spiked this week to 3.63, well above its 2.60 average (chart). The AAII bull-bear ratio has not followed, at 0.98 against its own average of 1.19. Institutional investors are bullish; retail investors not so much.