


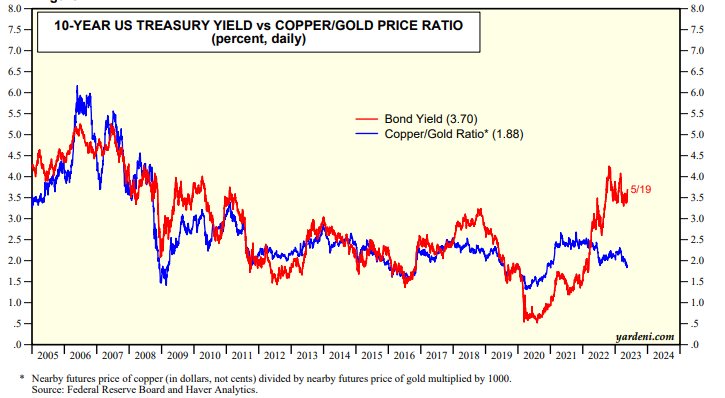
Two of our favorite technical indicators for the 10-year Treasury bond yield are currently bullish. The yield tends to be highly correlated with the ratio of the nearby futures prices of copper to gold (chart). The ratio suggests that the yield, which is currently 3.70%, should be much closer to 2.00%. We view the ratio as a risk-on versus a risk-off indicator.
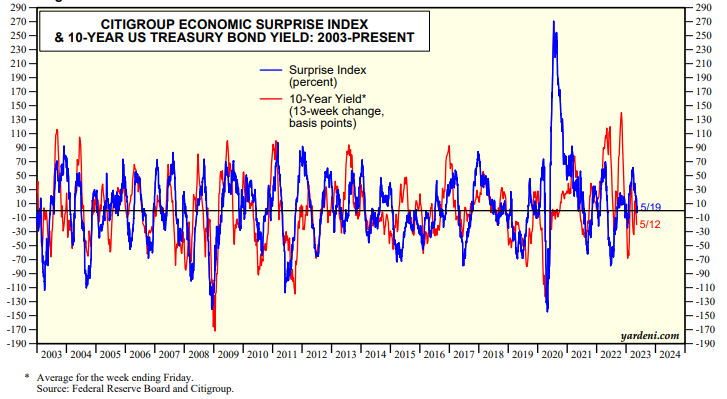
The Citigroup Economic Surprise Index (CESI) is highly correlated with the 13-week change in the 10-year yield (chart). The CESI fell from a recent peak of 61.3 on March 28 to 5.5 on May 19.
Notwithstanding these bond yield relationships, the yield has risen from a recent low of 3.31% on April 6 to 3.71% on Monday. Over this same period, the 2-year Treasury yield has risen from 3.83% to 4.33%. That’s mostly attributable to better-than-expected March and April employment reports. In addition, a few Fed officials have opined that the Fed should continue to raise the federal funds rate or follow any pause in the rate-hiking with further hikes if necessary.