Most of last week's economic indicator reports were strong: Initial jobless claims fell to near a 57-year low, ADP private payrolls rose 90,000 in September, and the ISM M-PMI was in expansion for a ninth straight month. Friday's employment report was the exception. Nonfarm payrolls rose just 29,000 in September, well below expectations, while July and August were revised down by a combined 60,000. The unemployment rate edged up to 4.2%.
Odds of a 25bps hike in the federal funds rate (FFR) at the October 27-28 FOMC meeting fell to 22%, with odds of one at the December meeting at 67%. Odds of two hikes by December is at just 3%. In other words, the market still expects a rate hike this year, though it has all but ruled out two. However, we still think the Fed ought to hike at least enough to reverse last year's three 25bps "insurance" cuts. September's hike reversed one, which leaves two more to go.
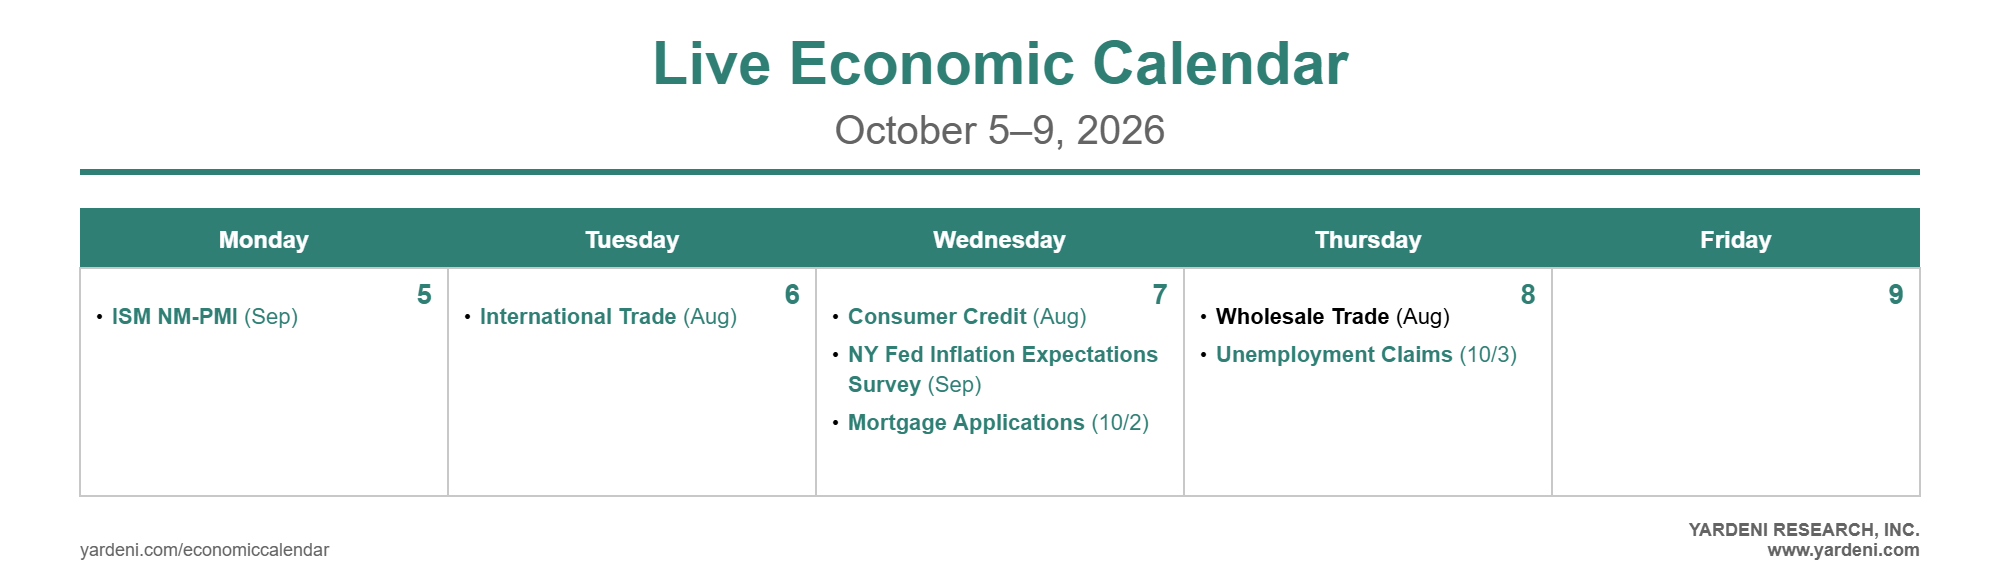
This week's data calendar is light, with Wednesday's FOMC minutes the main event. Here's more:
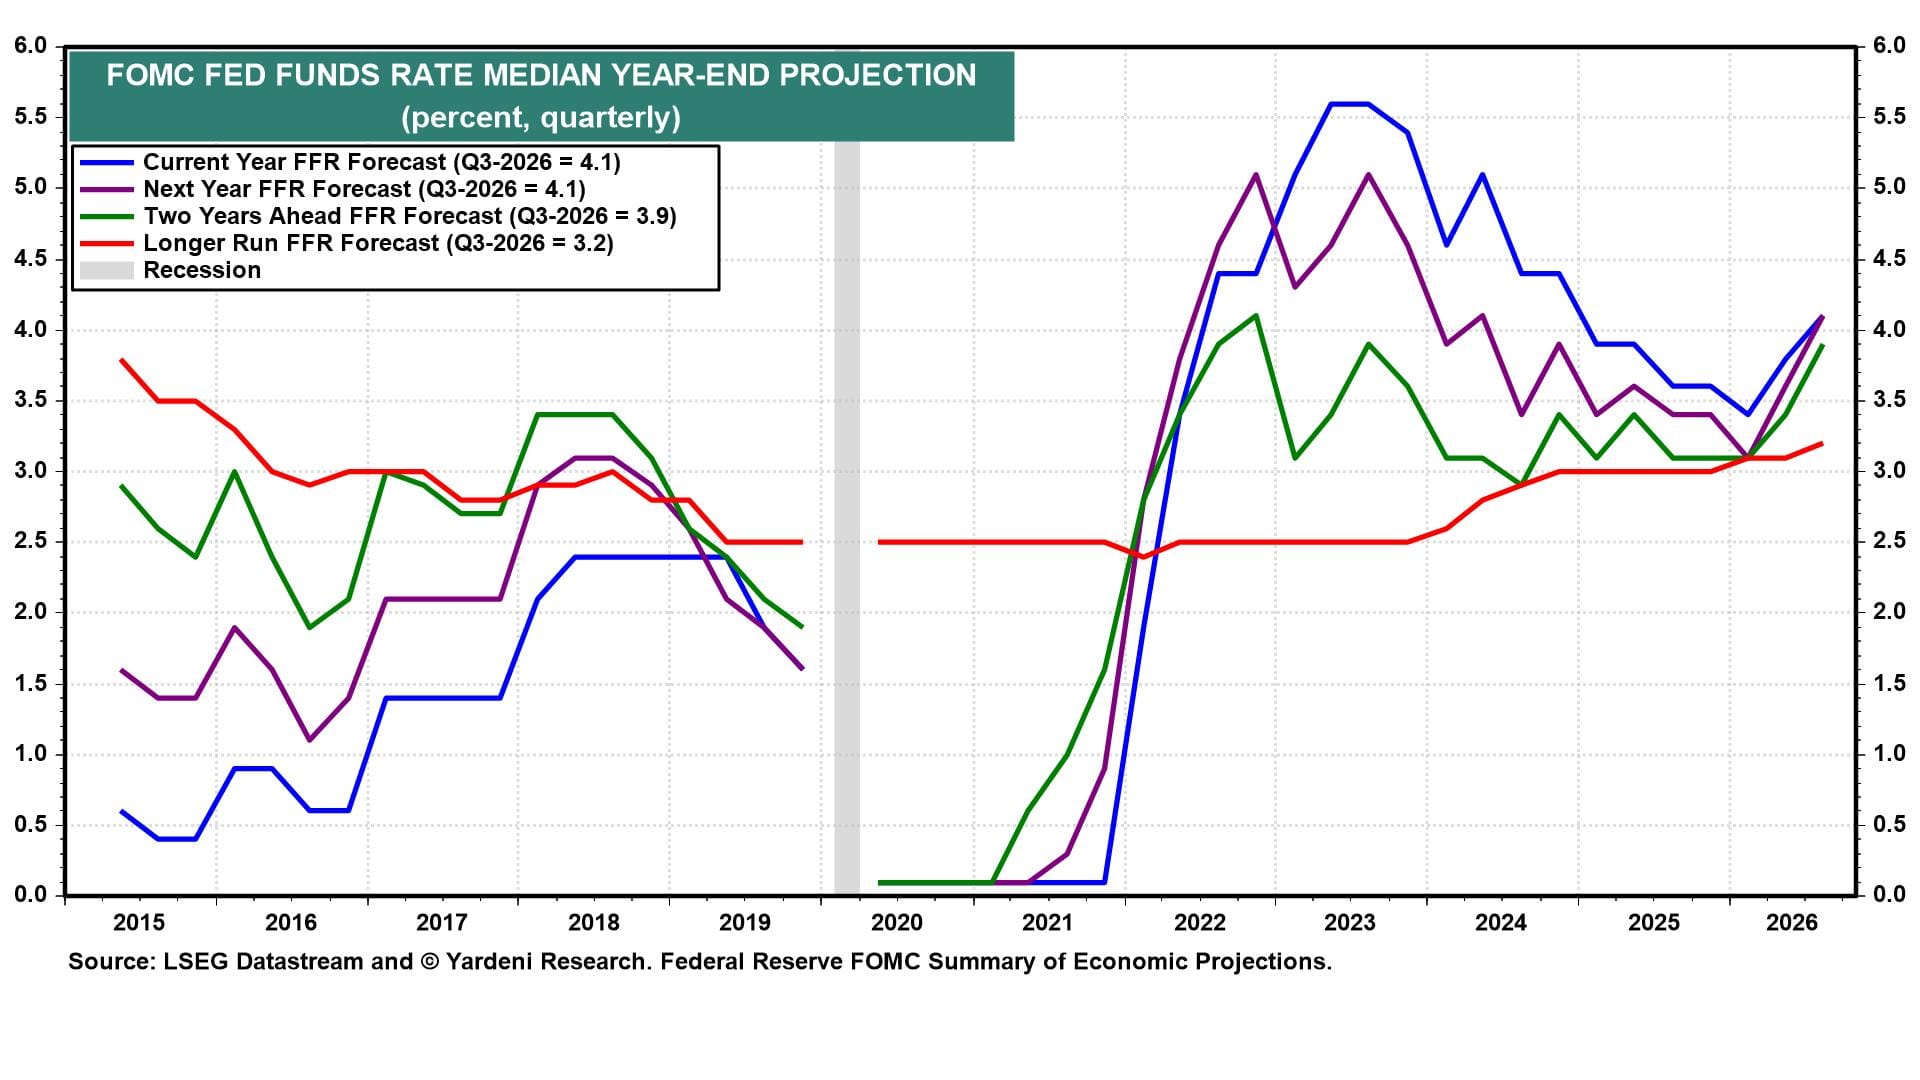
(1) FOMC minutes. September's FOMC meeting minutes (Wed) should reveal how much support the Committee has for tightening beyond what the dot plot in the September meeting’s Summary of Economic Projections implies.
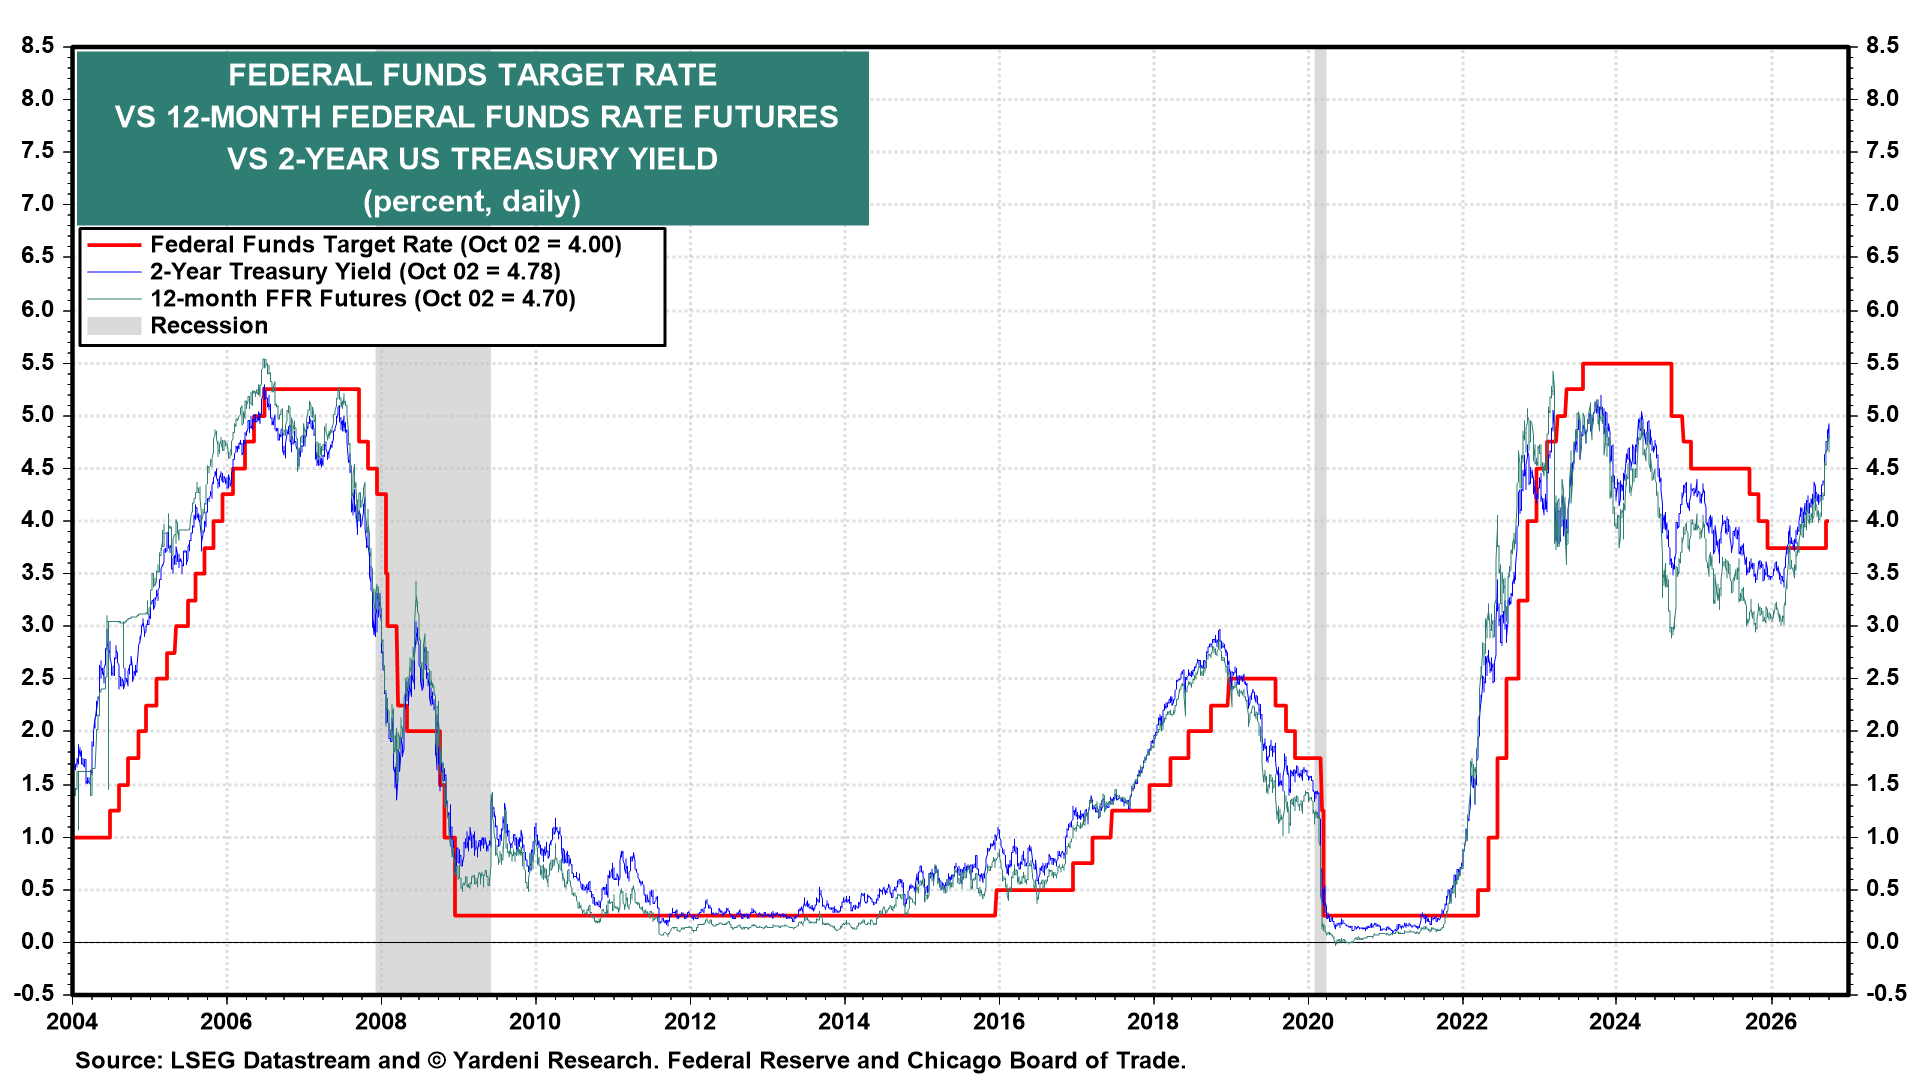
The median projection of meeting participants showed the FFR at 4.1% at the end of this year and next, i.e., one more 25bps hike in 2026 followed by a hold lasting throughout 2027 (chart). Fed Chair Kevin Warsh said the September hike "removed a dose of accommodation," implying that the FFR remains below the neutral rate. The median longer-run neutral rate estimate in September’s dot plot rose to 3.25%, a post-pandemic high.
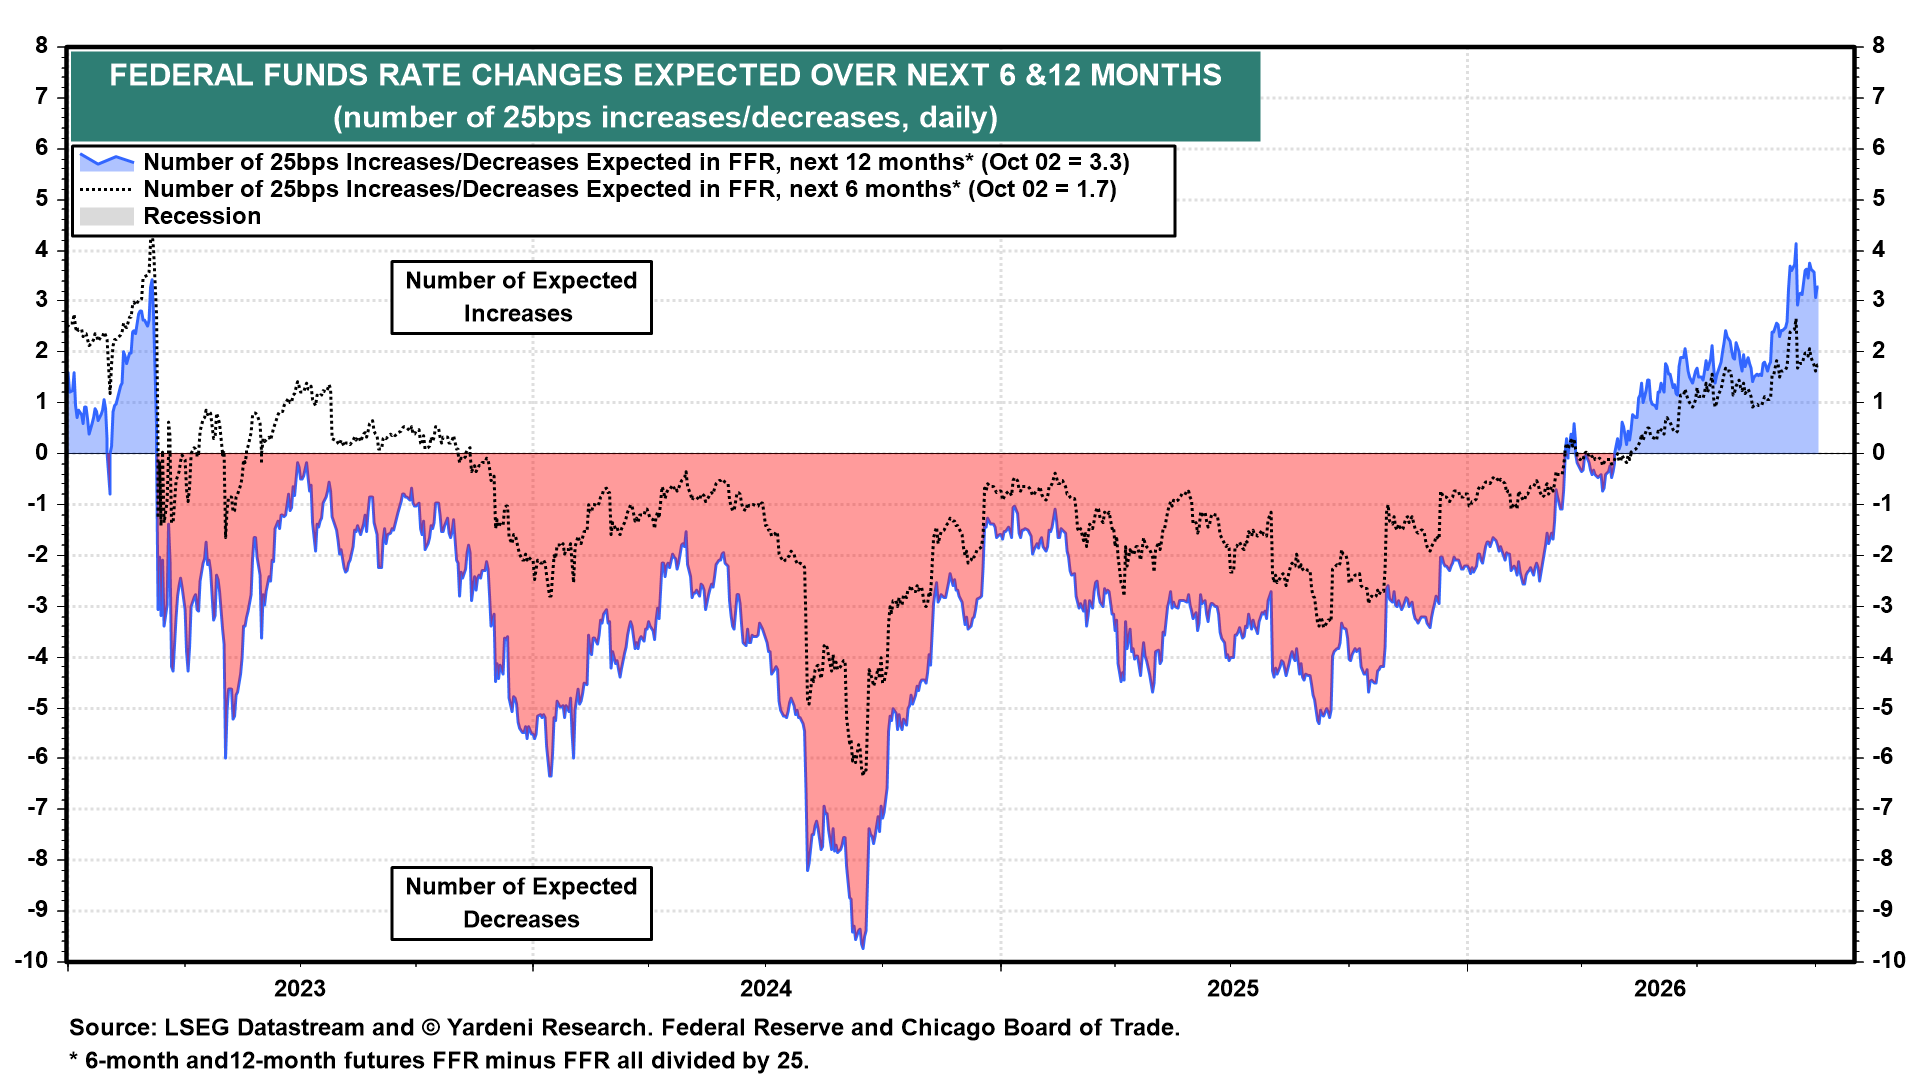
The FFR futures market’s prediction is more hawkish than the Fed officials’ median. FFR futures imply 3.3 rate hikes over the next 12 months and 1.7 over the next six months (chart).
The 2-year Treasury yield is at 4.78%, well above the 4.00% top of the FFR target range, with 12-month futures at 4.70% (chart).
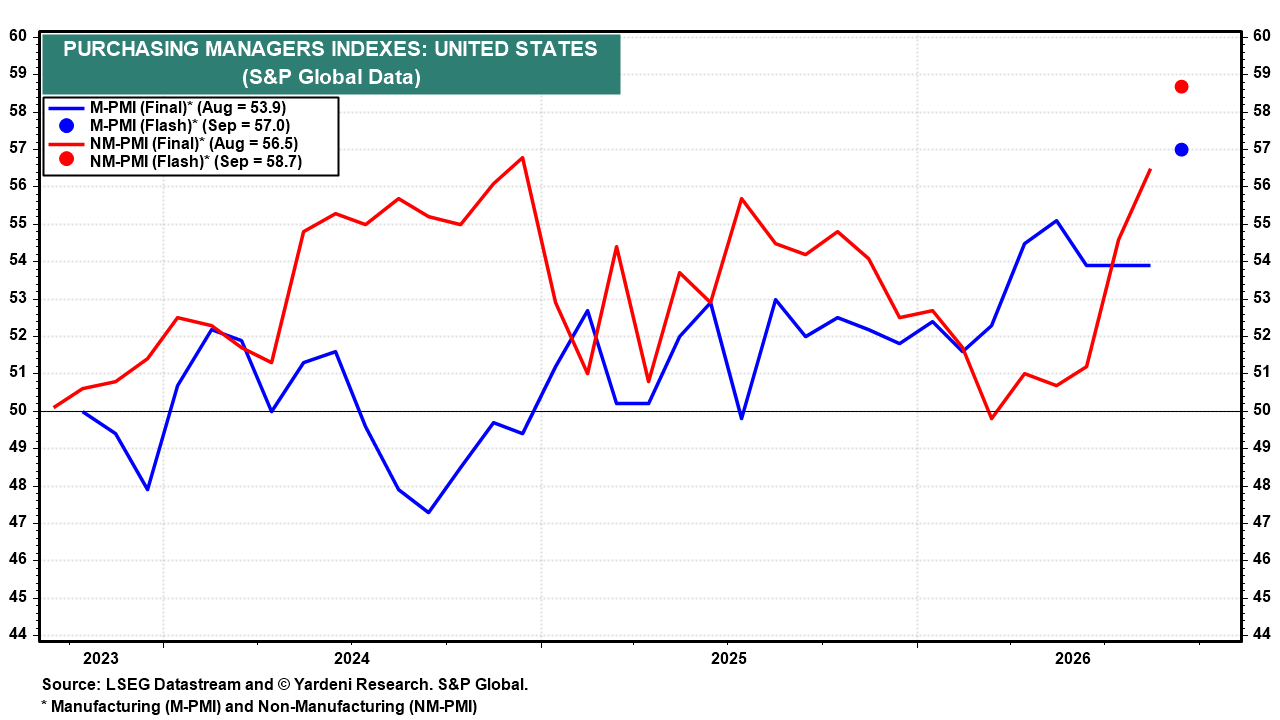
(2) PMIs. S&P Global's flash NM-PMI jumped to 58.7 in September from 56.5 in August, suggesting that ISM's NM-PMI (Mon), which was 55.4 in August, remained strong last month (chart). Services prices-paid components deserve close attention, as the supercore PCED inflation rate has been rising since October 2025.
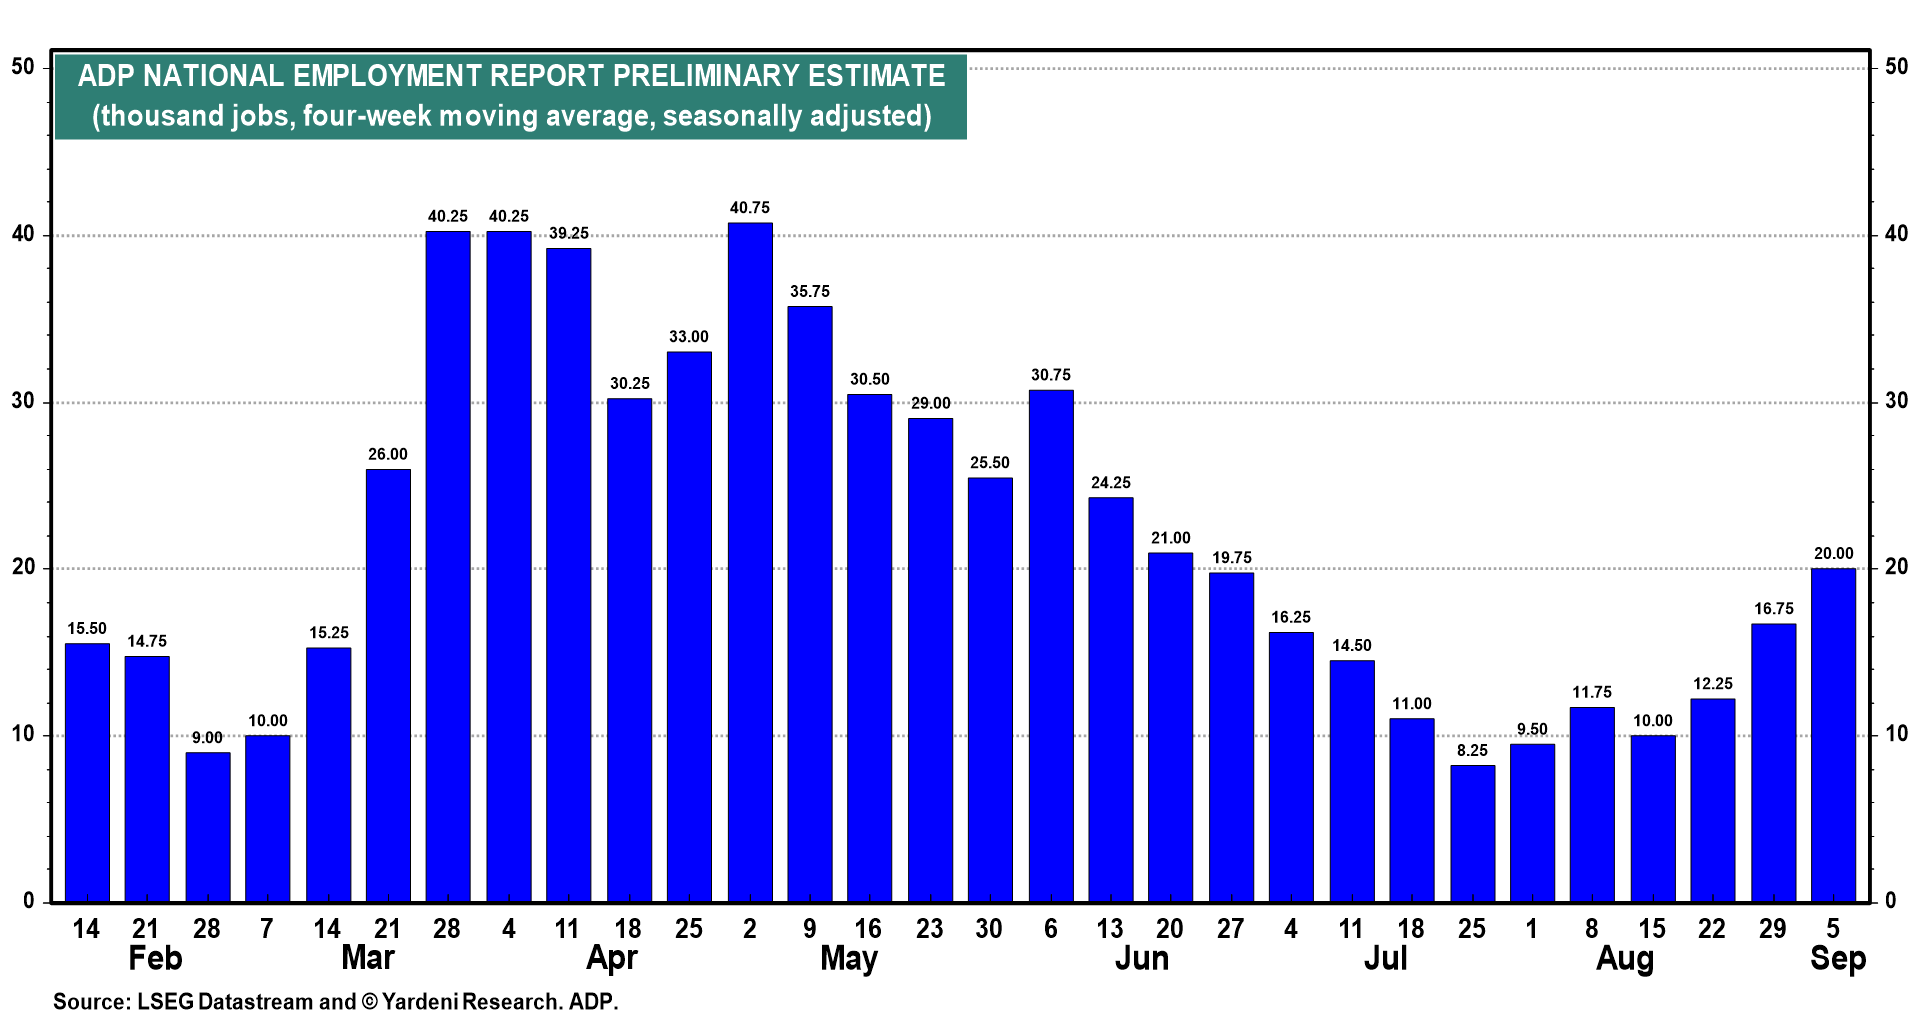
(3) ADP employment & jobless claims. ADP's weekly employment reading (Tue), covering the weeks ended September 12 and 19, follows a rise in the four-week average to 20,000 for the week ended September 5, up from a late-July bottom of 8,250 (chart). That pace closely matched September's ADP private payrolls gain of 90,000.
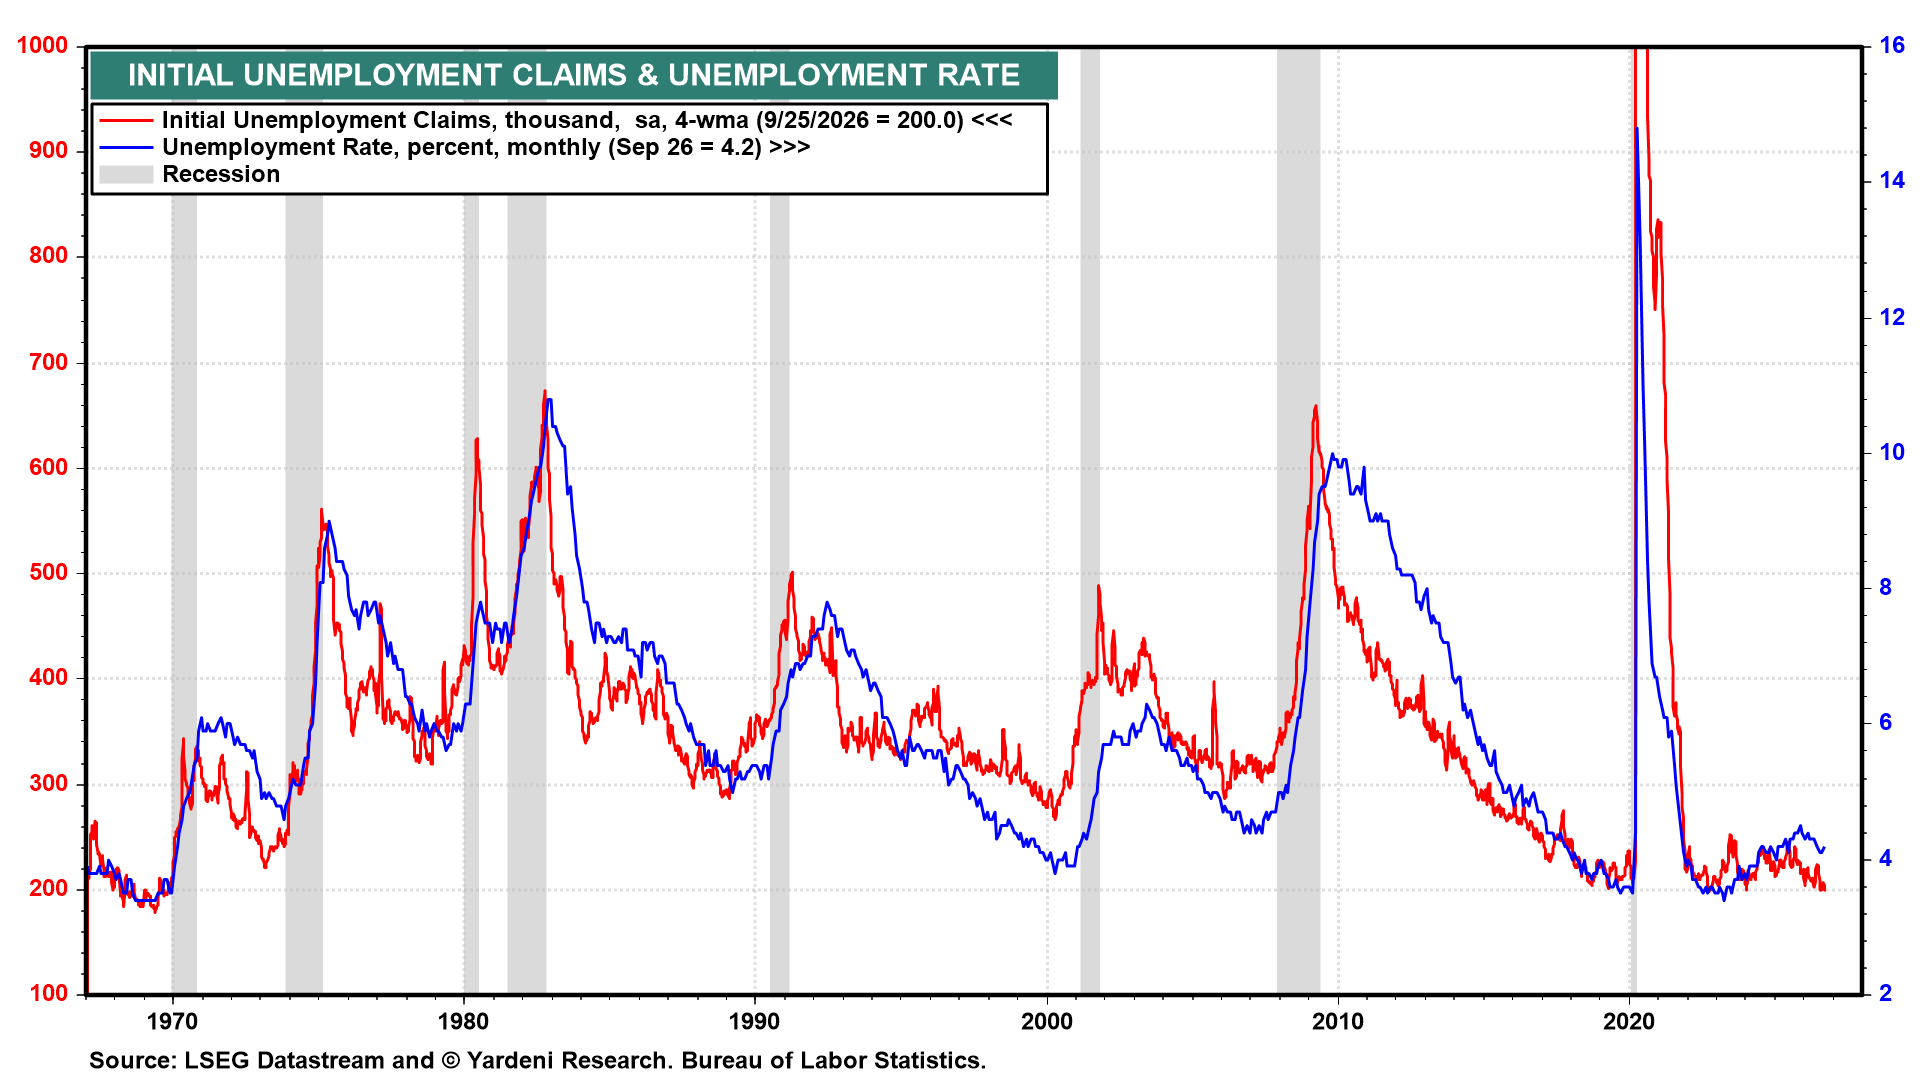
Initial jobless claims (Thu) follow last week's 197,000, the lowest since July 18. The four-week average fell to 200,000. Continuing claims dropped to 1,701,000 for the week ended September 18, the lowest since March 2023, with the four-week average at 1,739,000. The low level of initial claims confirmed September's low unemployment rate of 4.2% (chart).
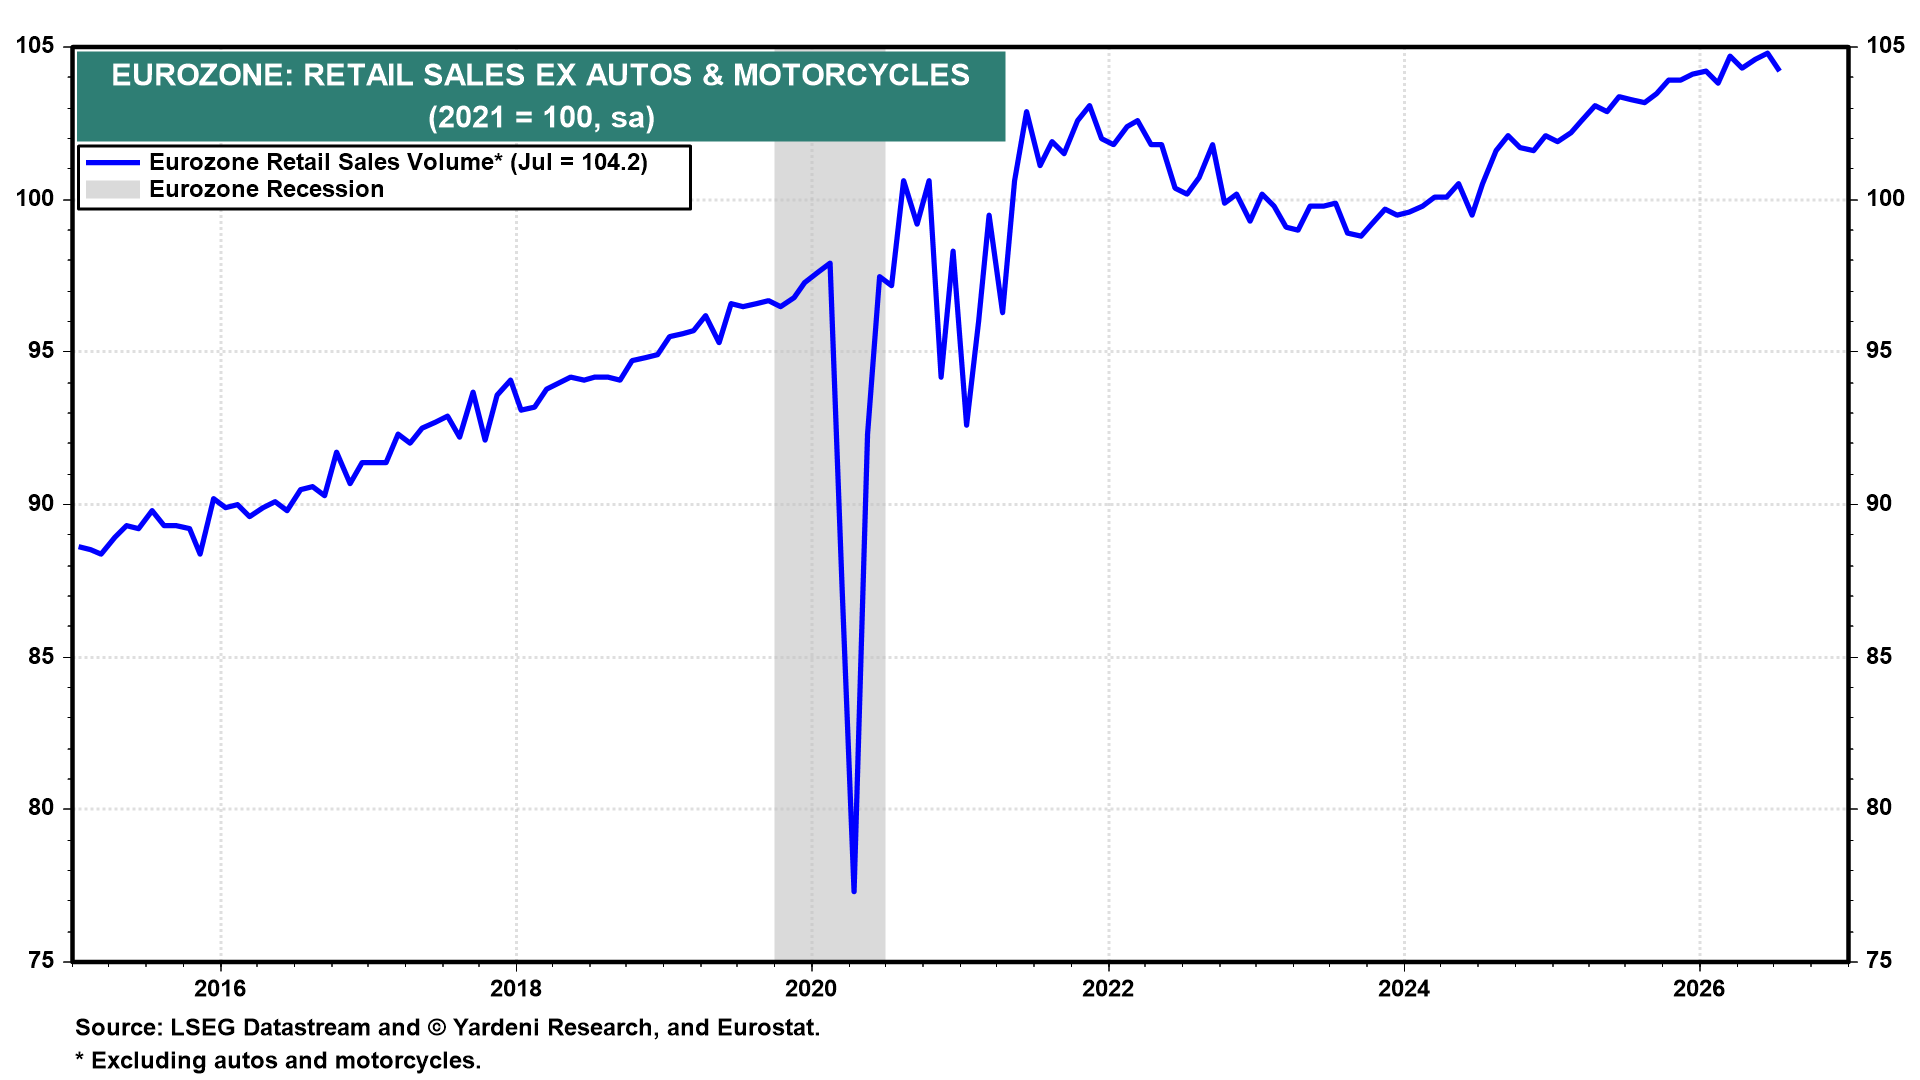
(4) Global. Eurozone retail sales ex autos fell 0.6% m/m in July, following June's record high (chart). August's data (Tue) should show whether that was just a blip.
Bank of England Governor Andrew Bailey may signal whether rising energy prices warrant a hike when he speaks at the Central Bank of Turkey's conference (Thu), after three Monetary Policy Committee members voted for one in September. The markets put the odds of a November hike at 88%, with roughly 66bps of additional tightening priced in for 2027.
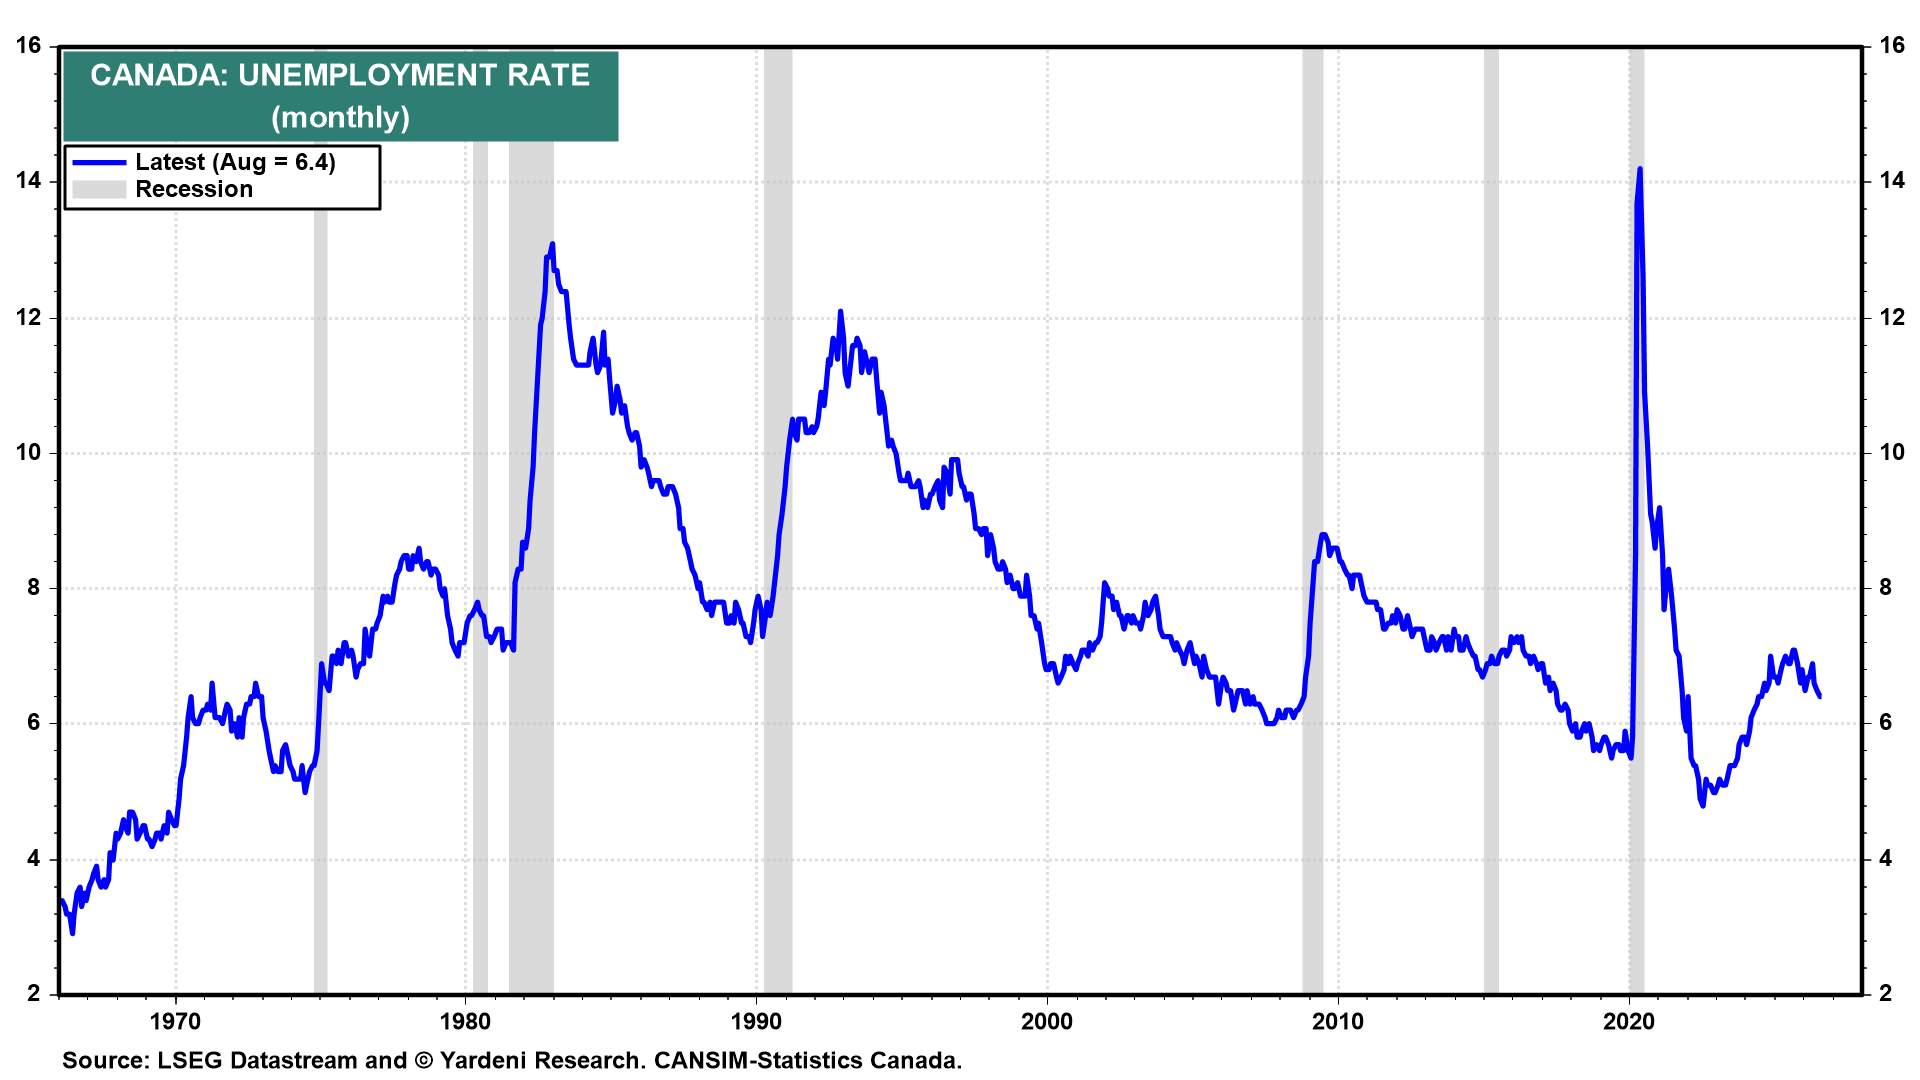
Canada's employment report for September (Fri) follows August's 41,700 job loss, with the unemployment rate holding at 6.4% (chart).