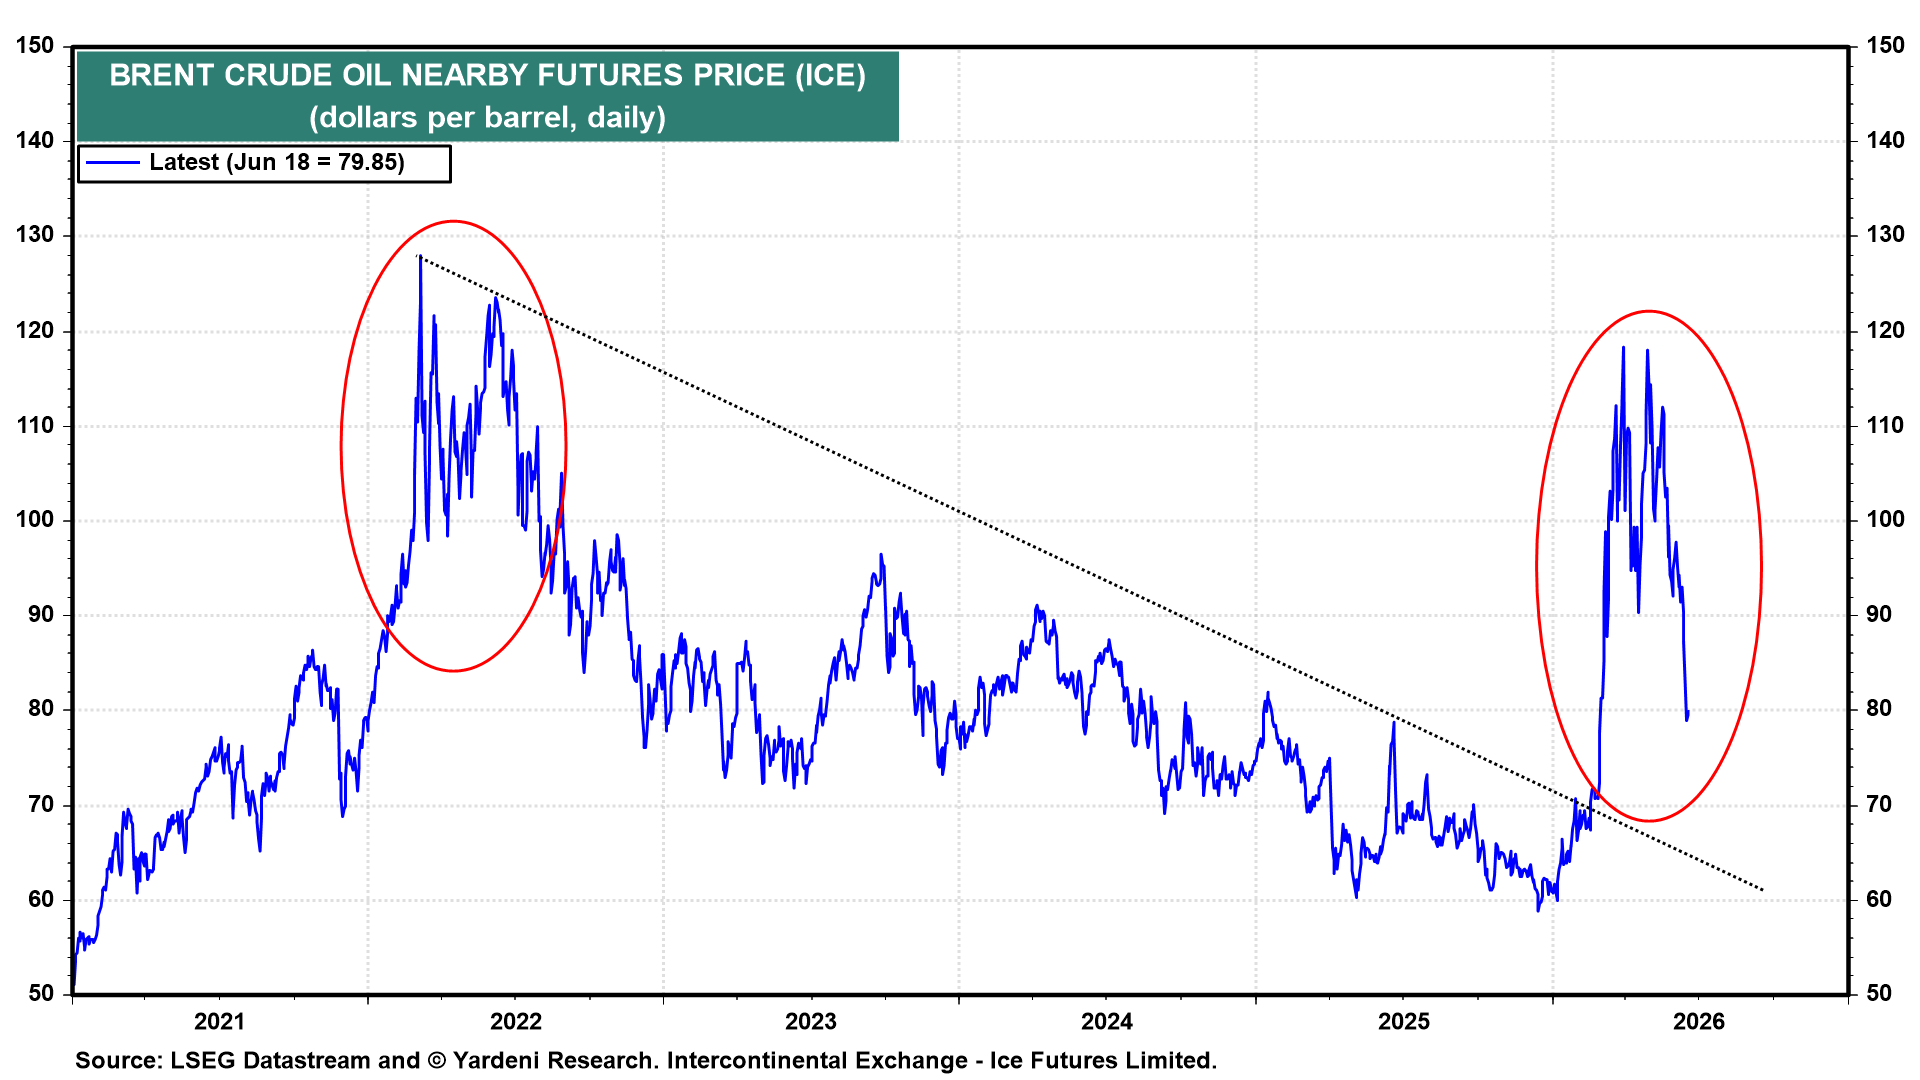
The US-Iran interim peace deal is shaky; but if it holds, it will end the US blockade of Iranian ports and reopen the Strait of Hormuz to commercial shipping. Now comes a 60-day negotiating period to hammer out a permanent agreement, centered on restricting Iran's nuclear program. The price of Brent crude oil extended its sharp decline following the peace deal announcement, with markets pricing in the return of Iranian barrels and the normalization of Persian Gulf shipping lanes (chart).
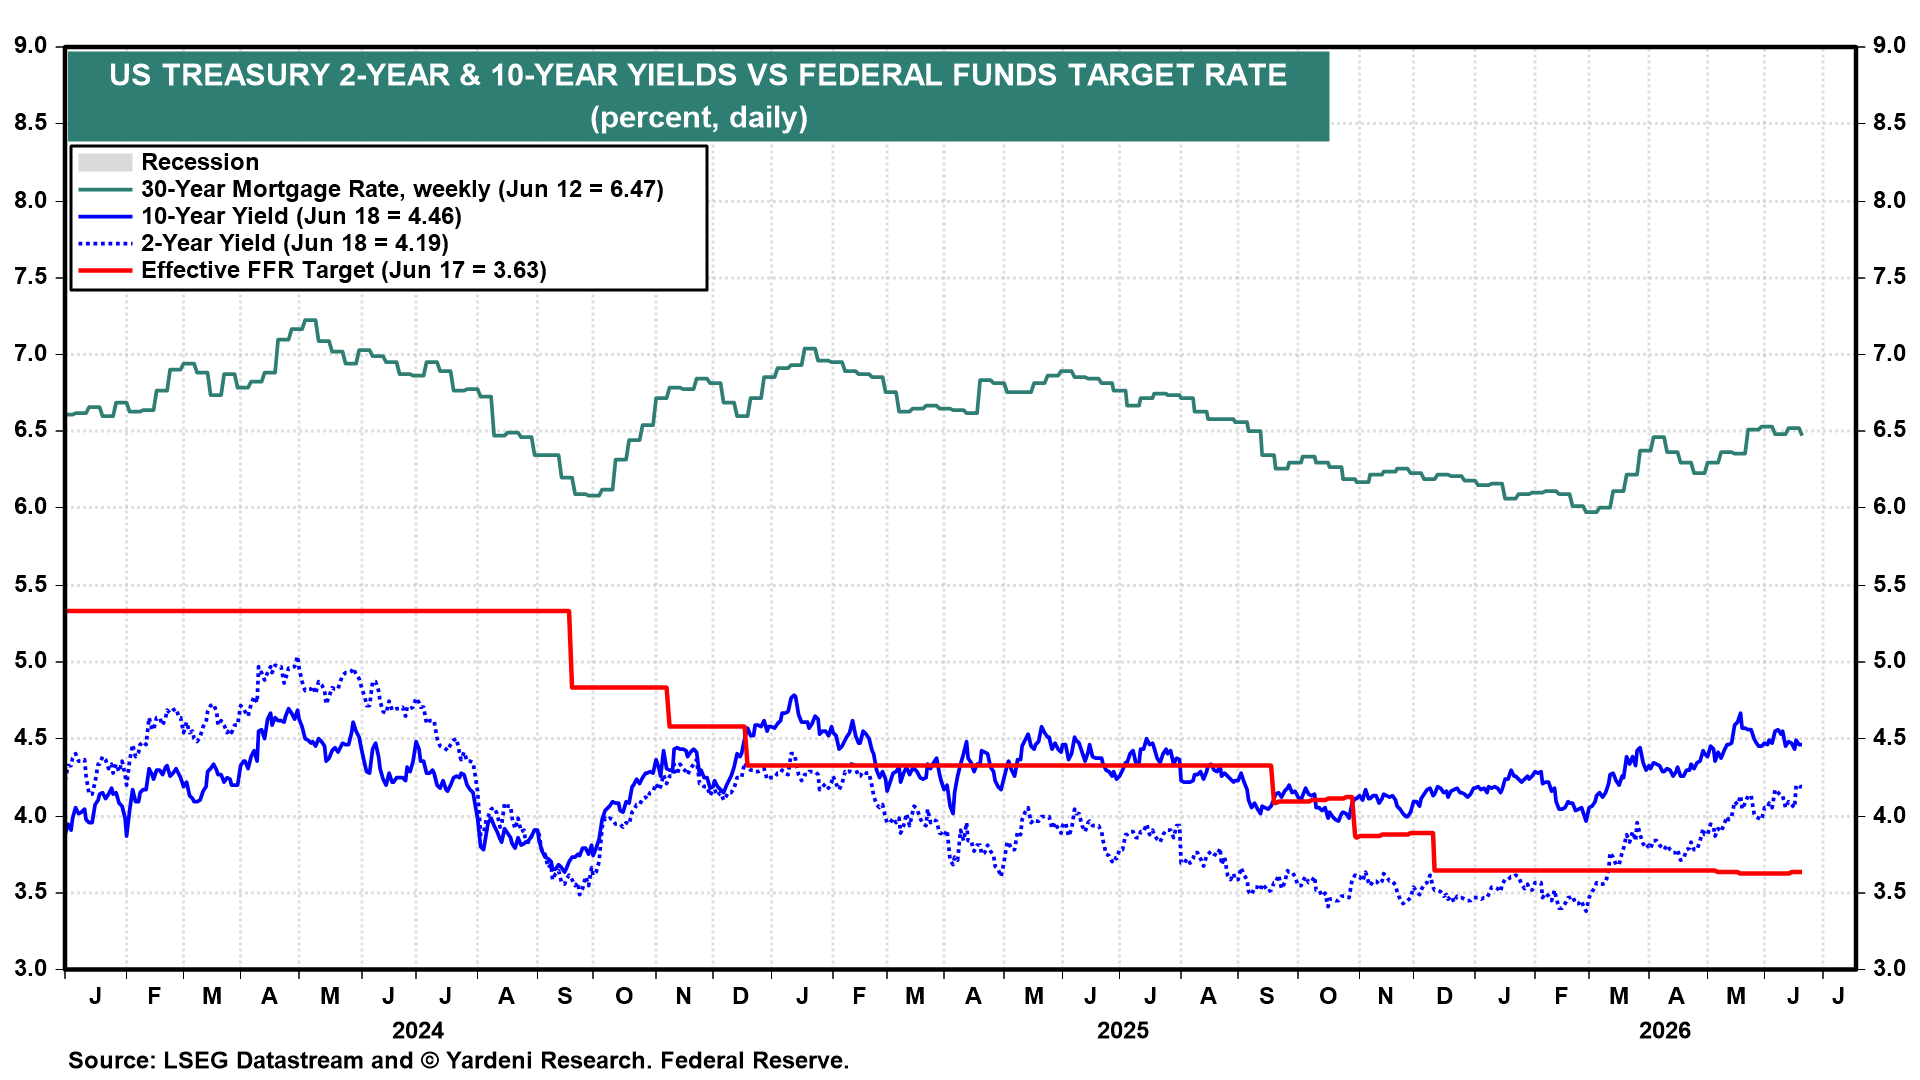
Meanwhile, the 10-year US Treasury yield fell from 4.67% on May 19 to 4.46% on Thursday, a sign that the market believes inflation will be contained over the longer term (chart). The 2-year Treasury yield steadied at around 4.19% on Thursday after climbing to this highest level in more than a year on Wednesday following Fed Chair Kevin Warsh's surprisingly hawkish comments at the June FOMC meeting.
With the geopolitical pressure valve beginning to release, the latest economic data tell an encouraging story about how well the US economy has held up under the strain of higher energy prices and elevated geopolitical uncertainty. Consider the following:
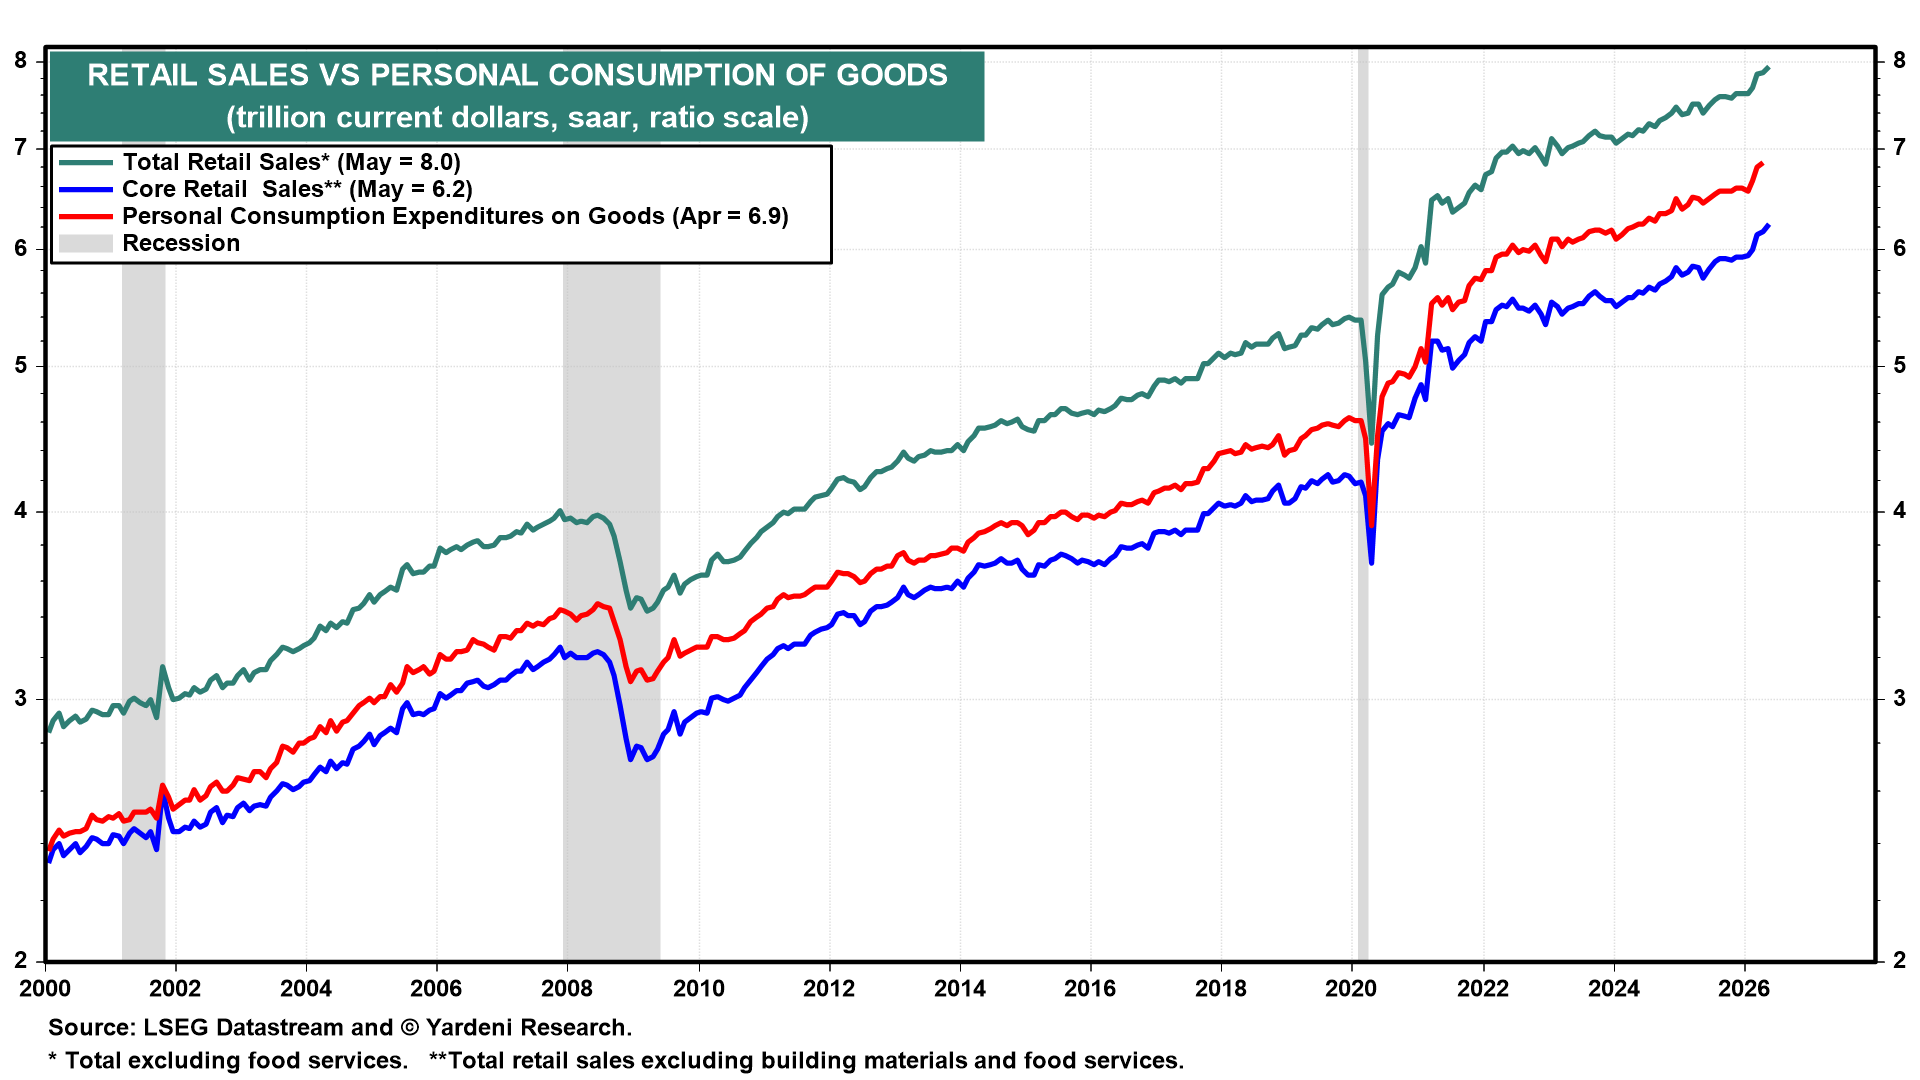
(1) Retail sales. May retail sales rose 0.9% m/m, marking the fourth straight month of expansion (chart). Much of the headline increase was driven by a 3.4% m/m surge in sales at gasoline stations, as prices at the pump averaged $4.50 per gallon in May. However, even after excluding autos and gasoline, retail sales still rose at a solid 0.5% m/m pace. Eleven of the 13 major categories posted gains, suggesting broad-based resilience in consumer spending.
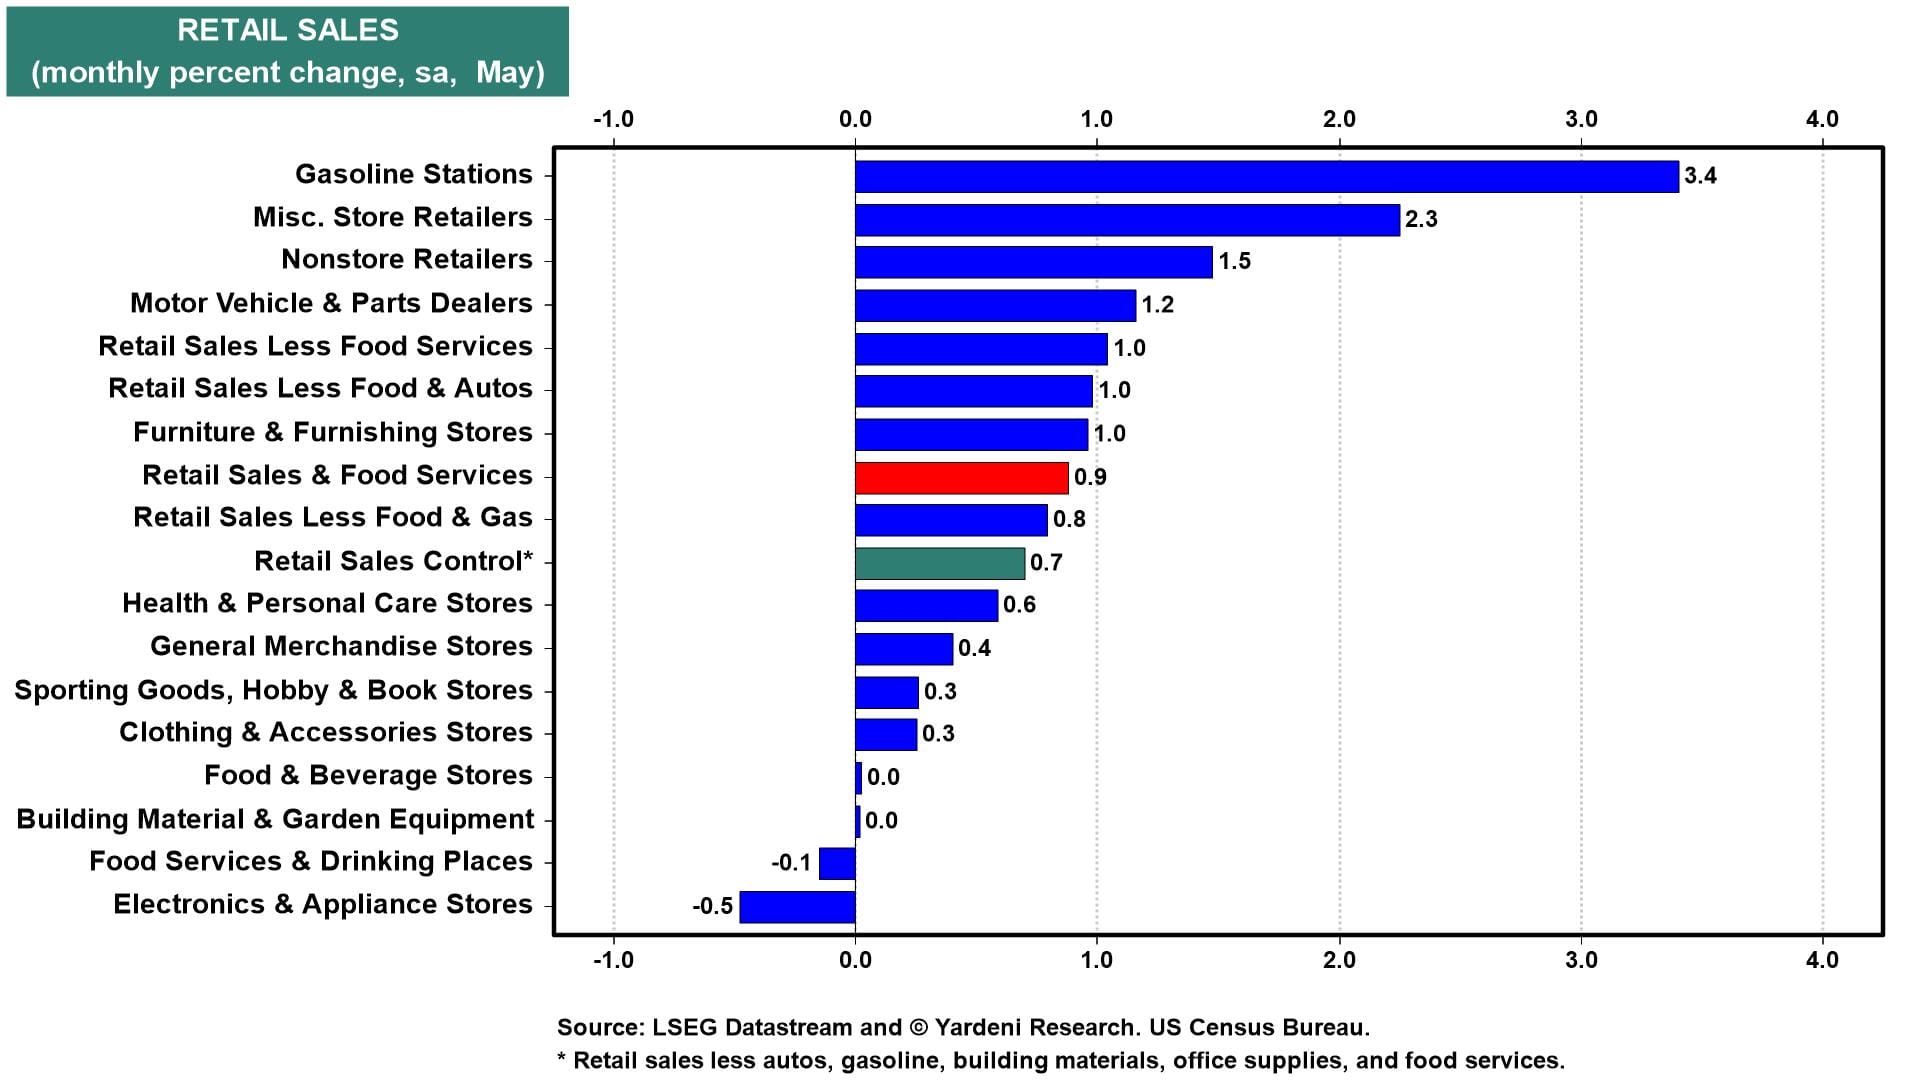
Control-group retail sales, used in calculating GDP, rose a solid 0.7% m/m following a healthy gain of 0.5% in March (chart).
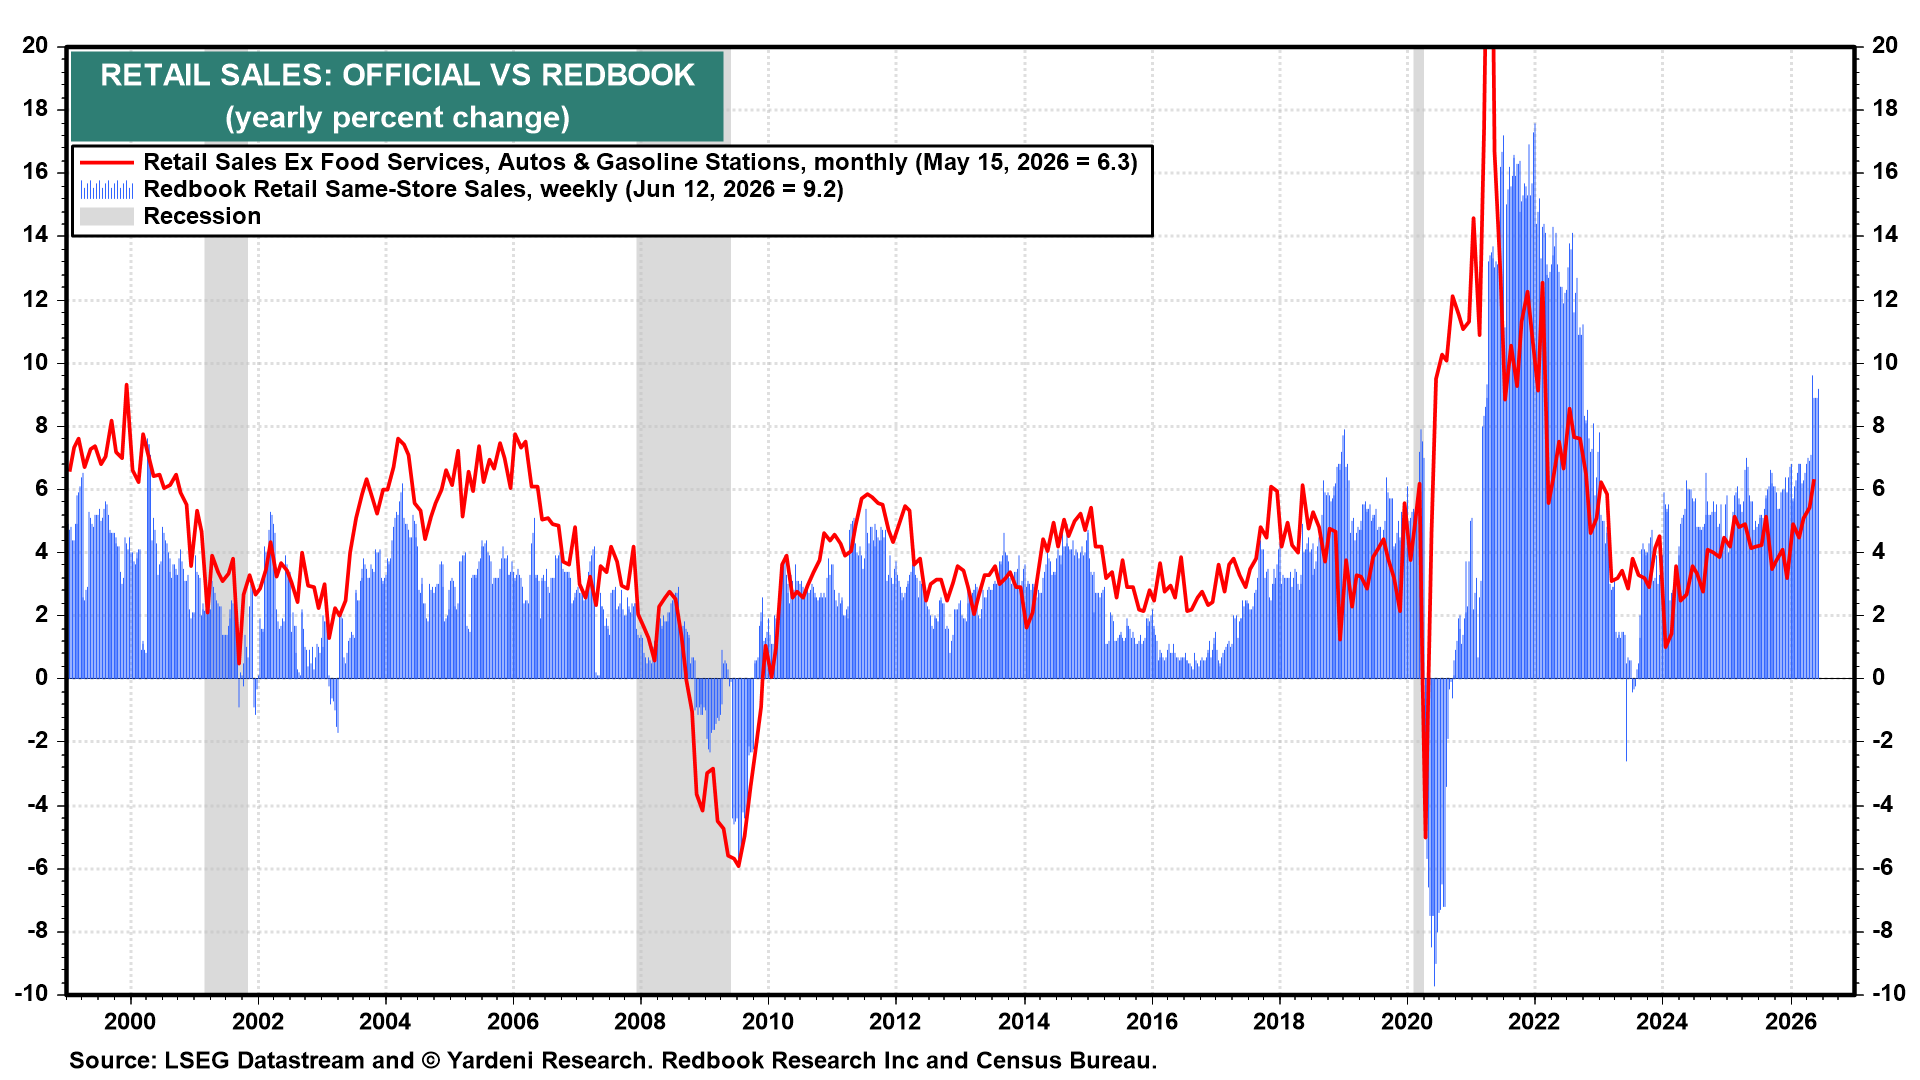
We were not surprised by the blockbuster increase in retail sales, given that we have been closely following and reporting on the Redbook same-store retail sales index, which continued to accelerate in May (chart).
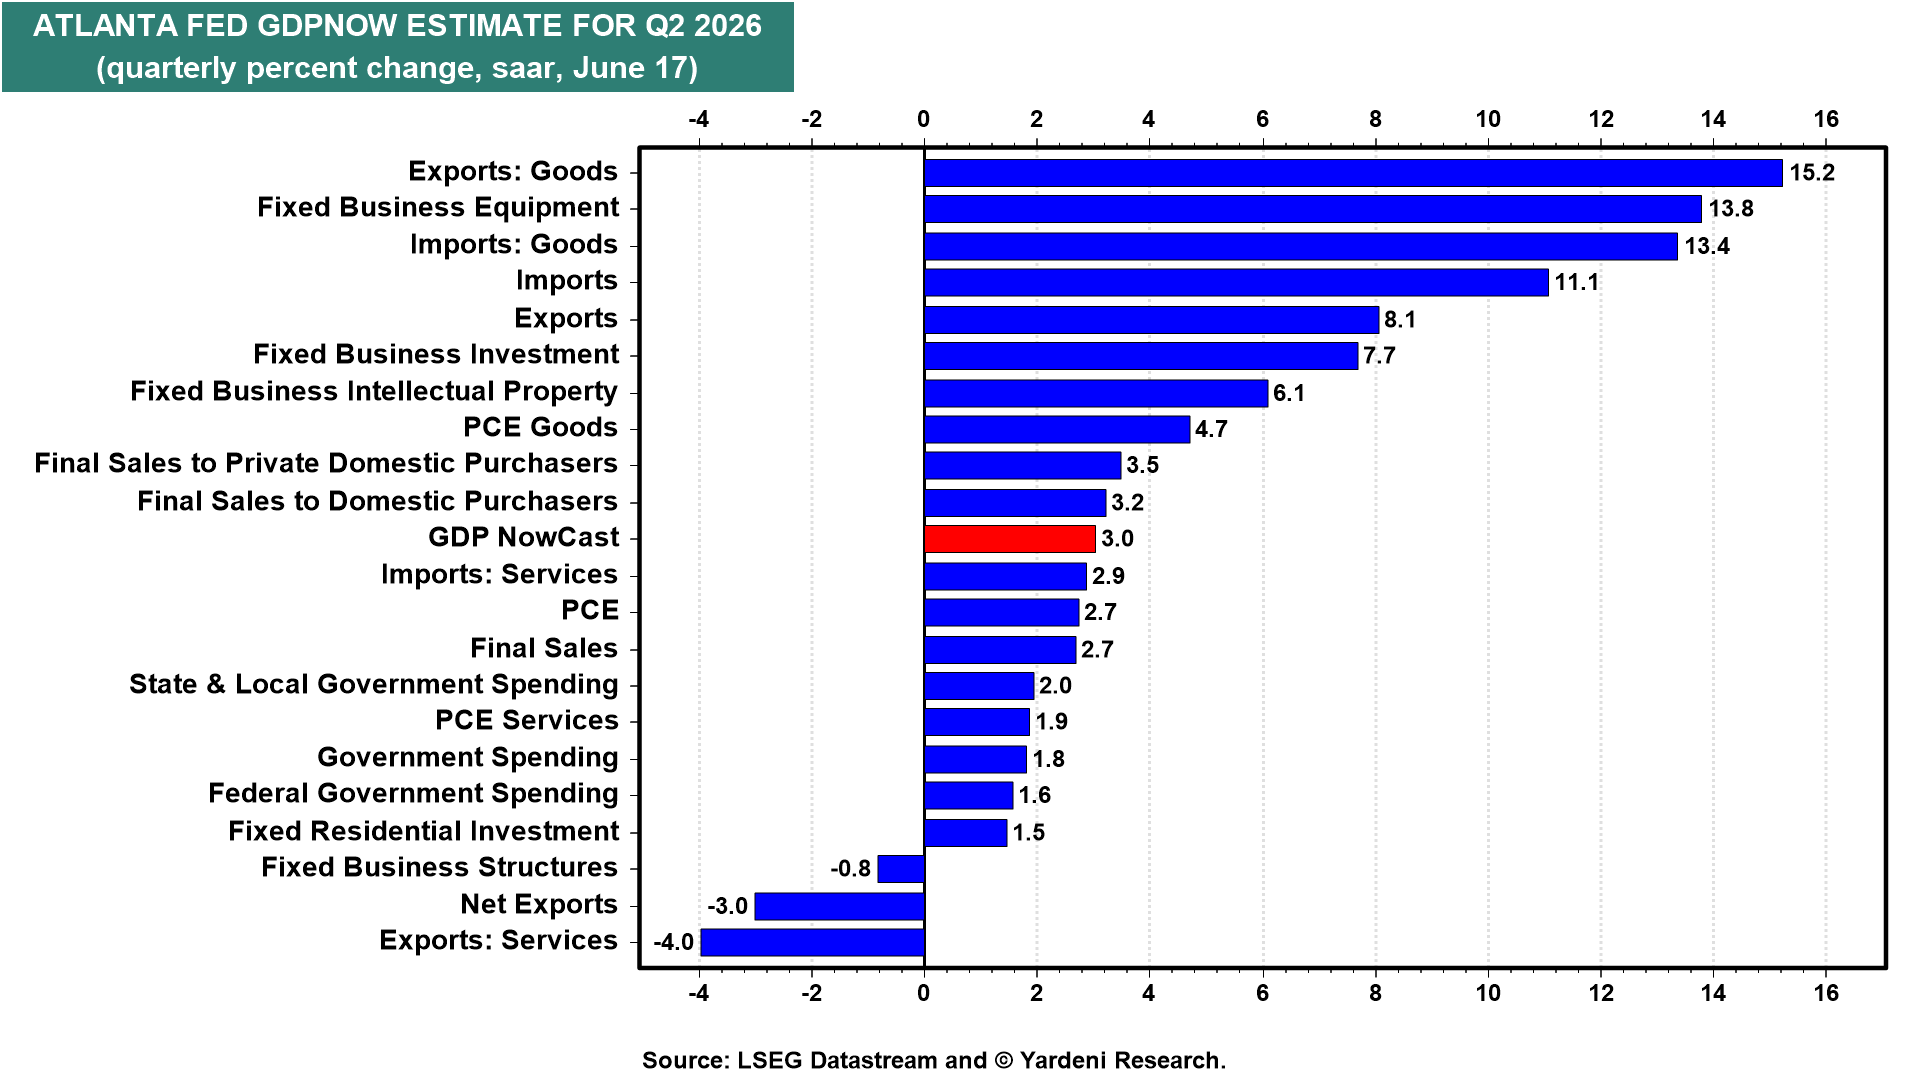
(2) GDP. Following the strong increase in control-group retail sales, the Atlanta Fed's GDPNow model estimate for Q2-2026 real GDP growth was revised higher, from 2.8% to 3.0% (chart). The “nowcast” for real consumption growth was raised from 2.4% to 2.7%, and real gross private domestic investment was lowered from 8.6% to 8.5%. These numbers imply that consumer spending growth accelerated in the second quarter and that capital investment remains strong due to the AI infrastructure buildout.
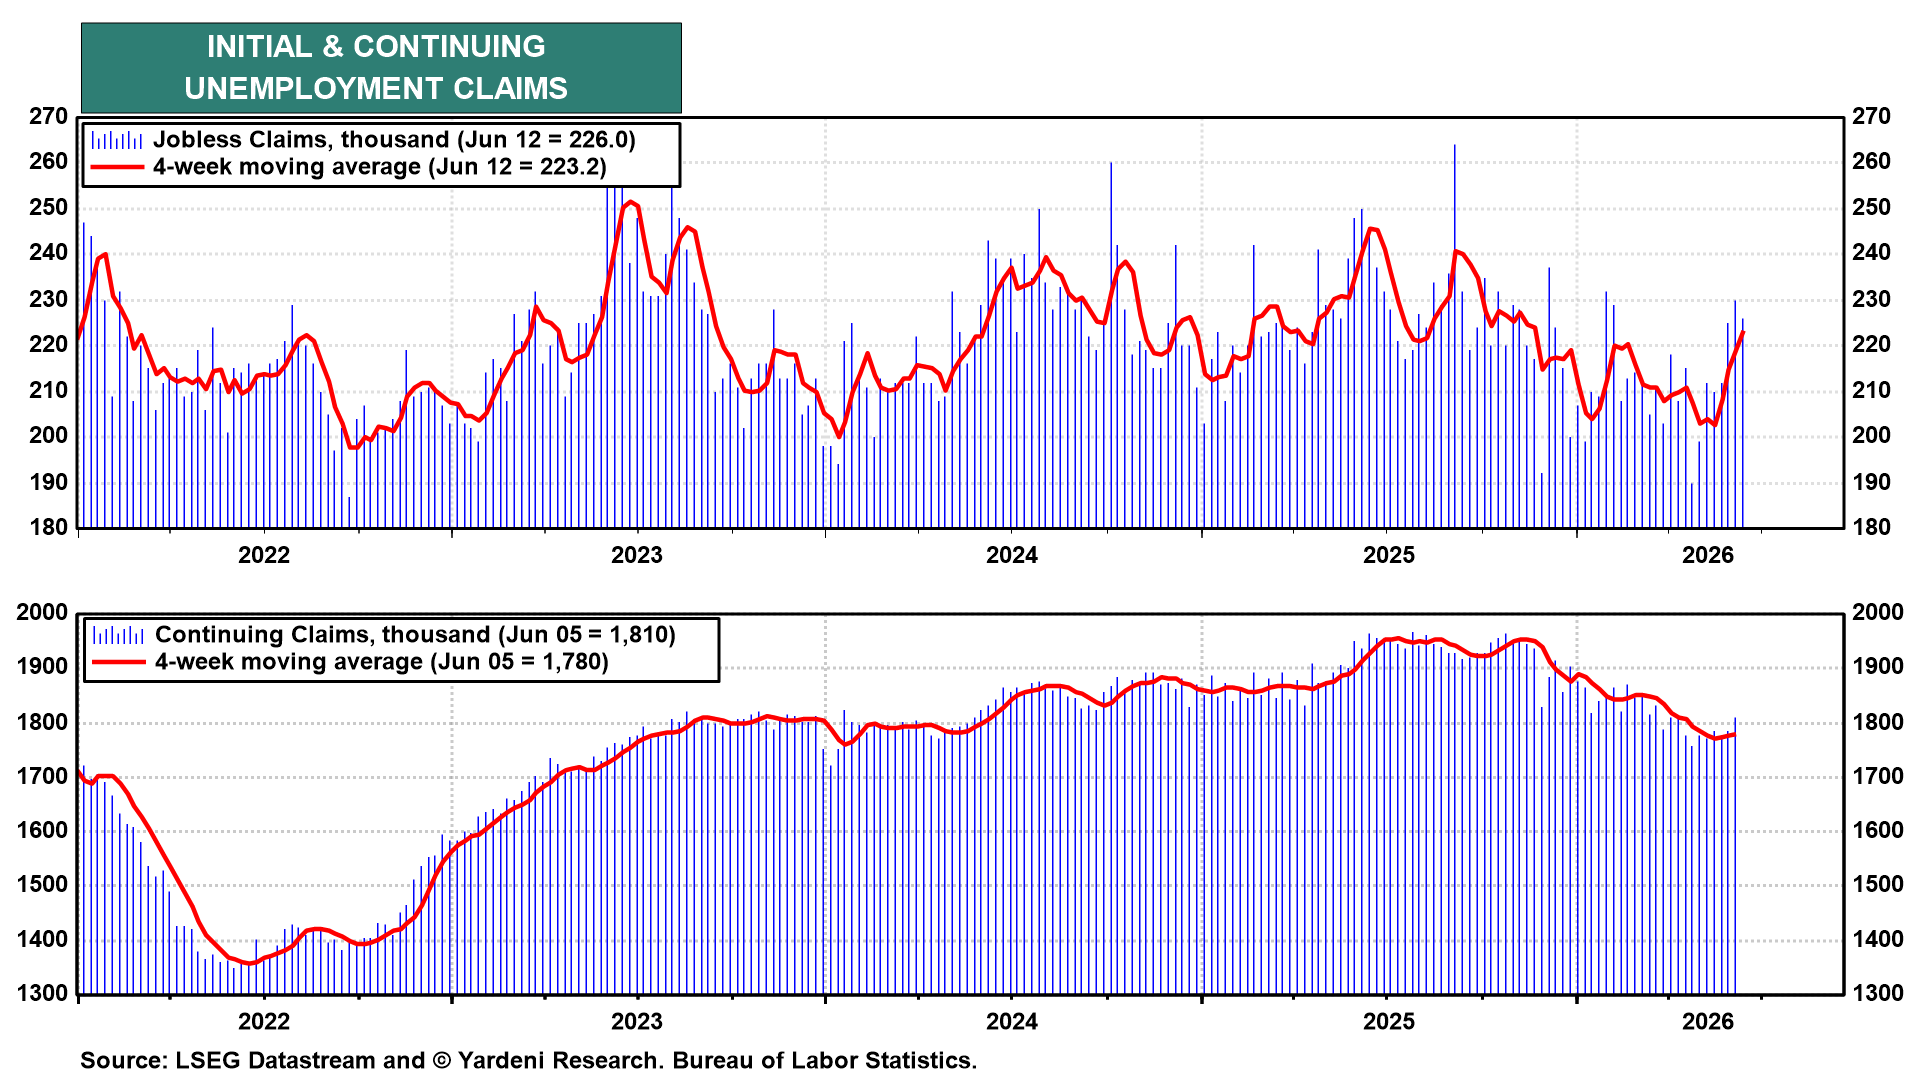
(3) Labor market. Initial unemployment insurance claims dropped slightly to 226,000 last week, a low level that is consistent with very subdued layoff activity (chart). Continuing claims ticked up to 1,810,000. The readings suggest that the labor market remains in good shape and continues to support consumer spending.
(4) Regional Fed surveys. The average of the business conditions indexes across two Fed regional business surveys ticked down to 8.0 in June but still suggests that manufacturing activity in the US economy remains in expansionary territory (chart).
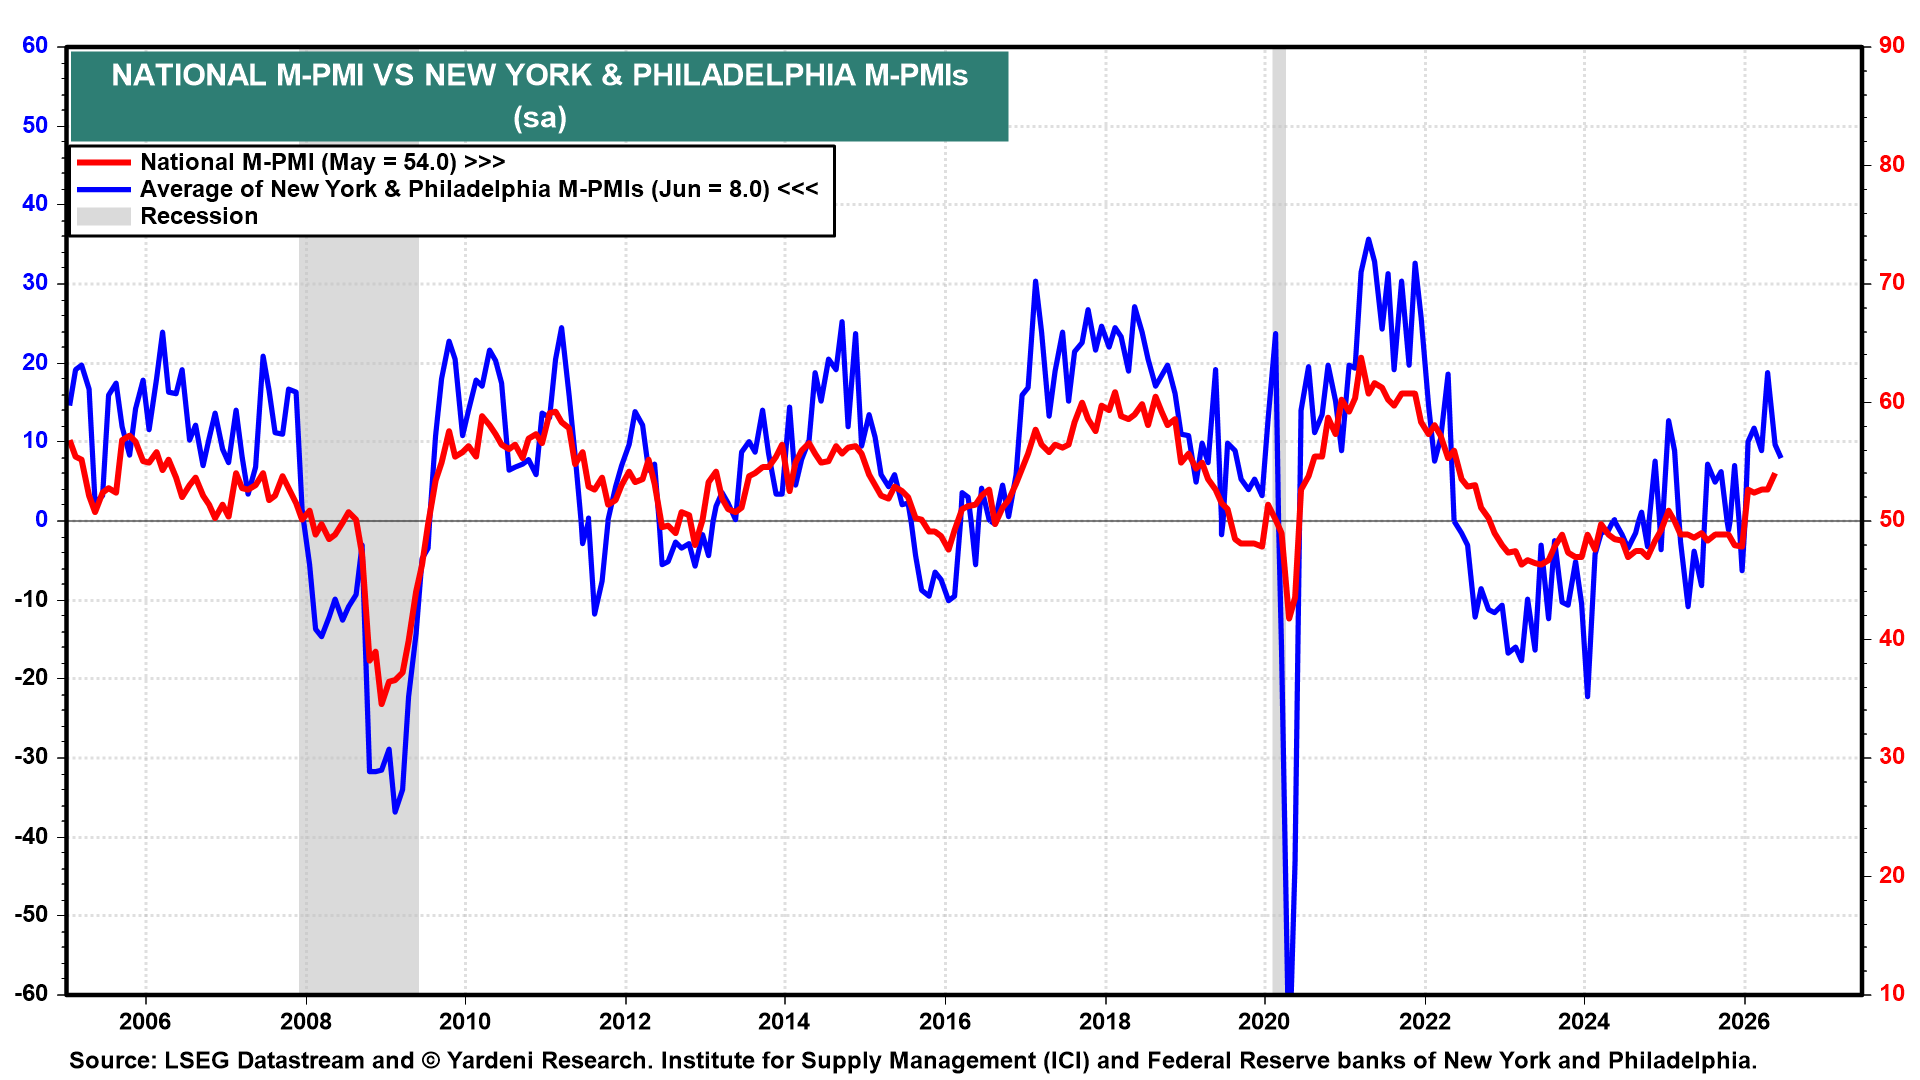
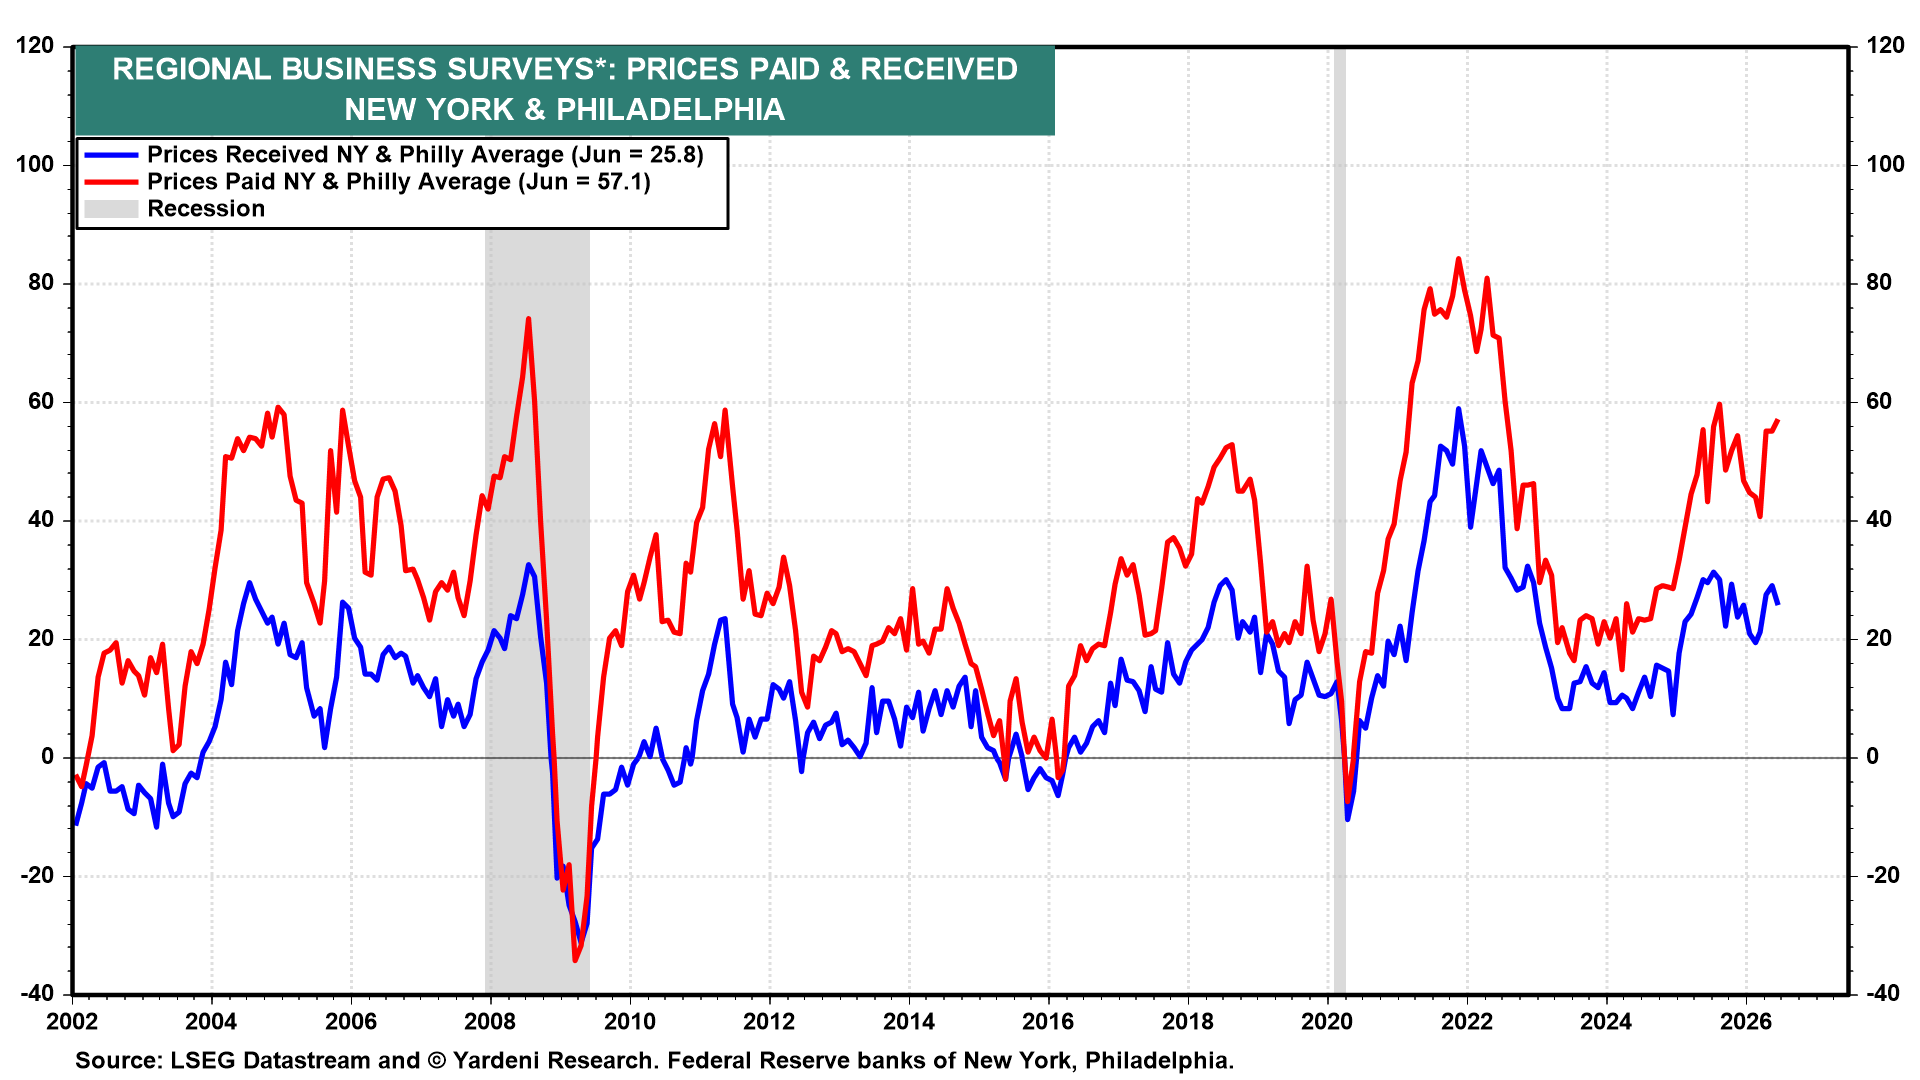
At the same time, the averages of prices-paid and prices-received indexes across the two Fed regional business surveys indicate that inflation pressures have remained elevated in June (chart). These surveys confirm that the balance of risks remains skewed toward the inflation side of the Fed's dual mandate.