


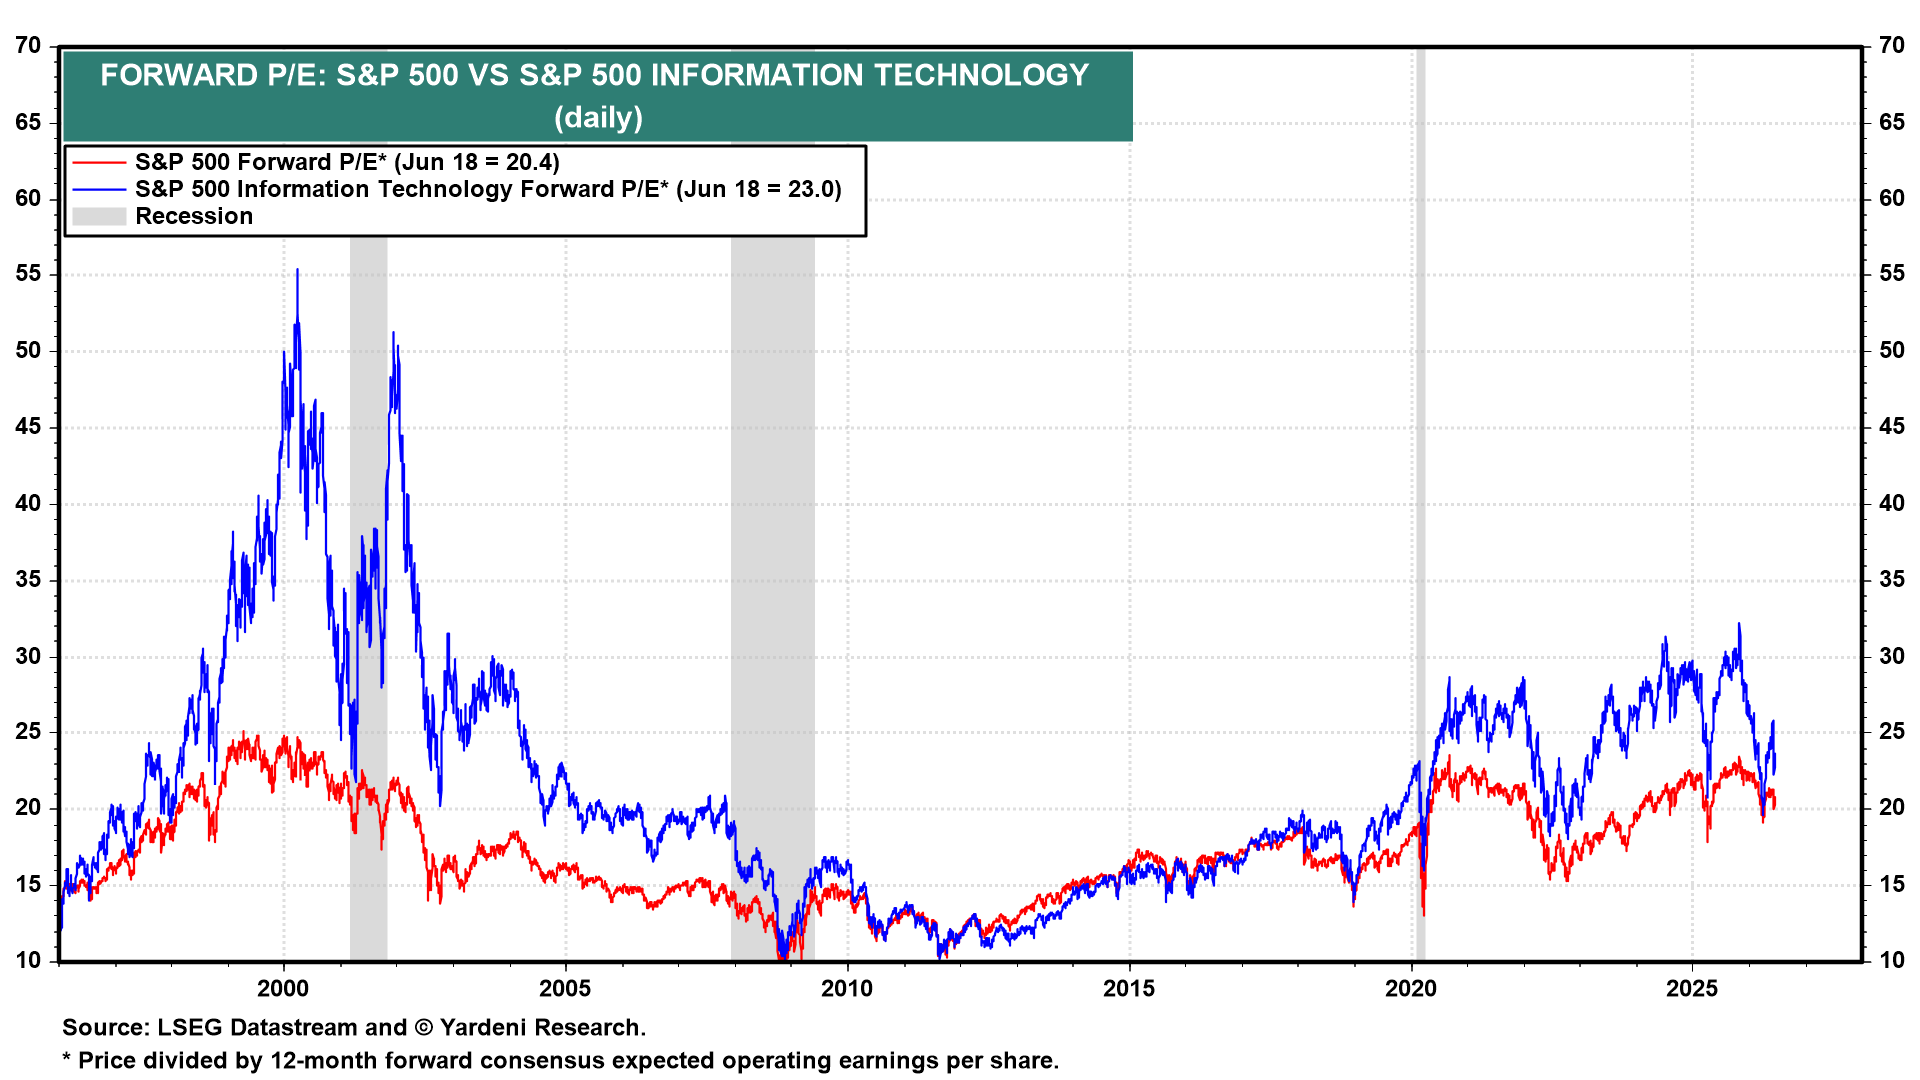
The stock market bubble of the late 1990s was driven by fear of missing out (FOMO) on the tech-led bull market. As a result, the forward P/E of the S&P 500 rose to a record high of 25.0 in early 2000 as the forward P/E of the S&P 500 Information Technology sector soared to a record high of 55.0 (chart).
The current bull market has been increasingly driven by fabulous earnings momentum (FEMO). On Friday, the S&P 500 closed near its June 2 record high of 7609.78. Its forward P/E was 20.4, while the Information Technology sector's was just 23.0.
An earnings-led rally should be much more sustainable than a P/E-led one fueled by irrational exuberance. FEMO beats FOMO. The question that we are asked more often these days is whether the quality of earnings is eroding and fueling irrational exuberance in earnings expectations. Might circular financing be artificially boosting earnings among the AI-related companies? Might capital gains on their investments in one another be doing the same?
Let’s have a look:
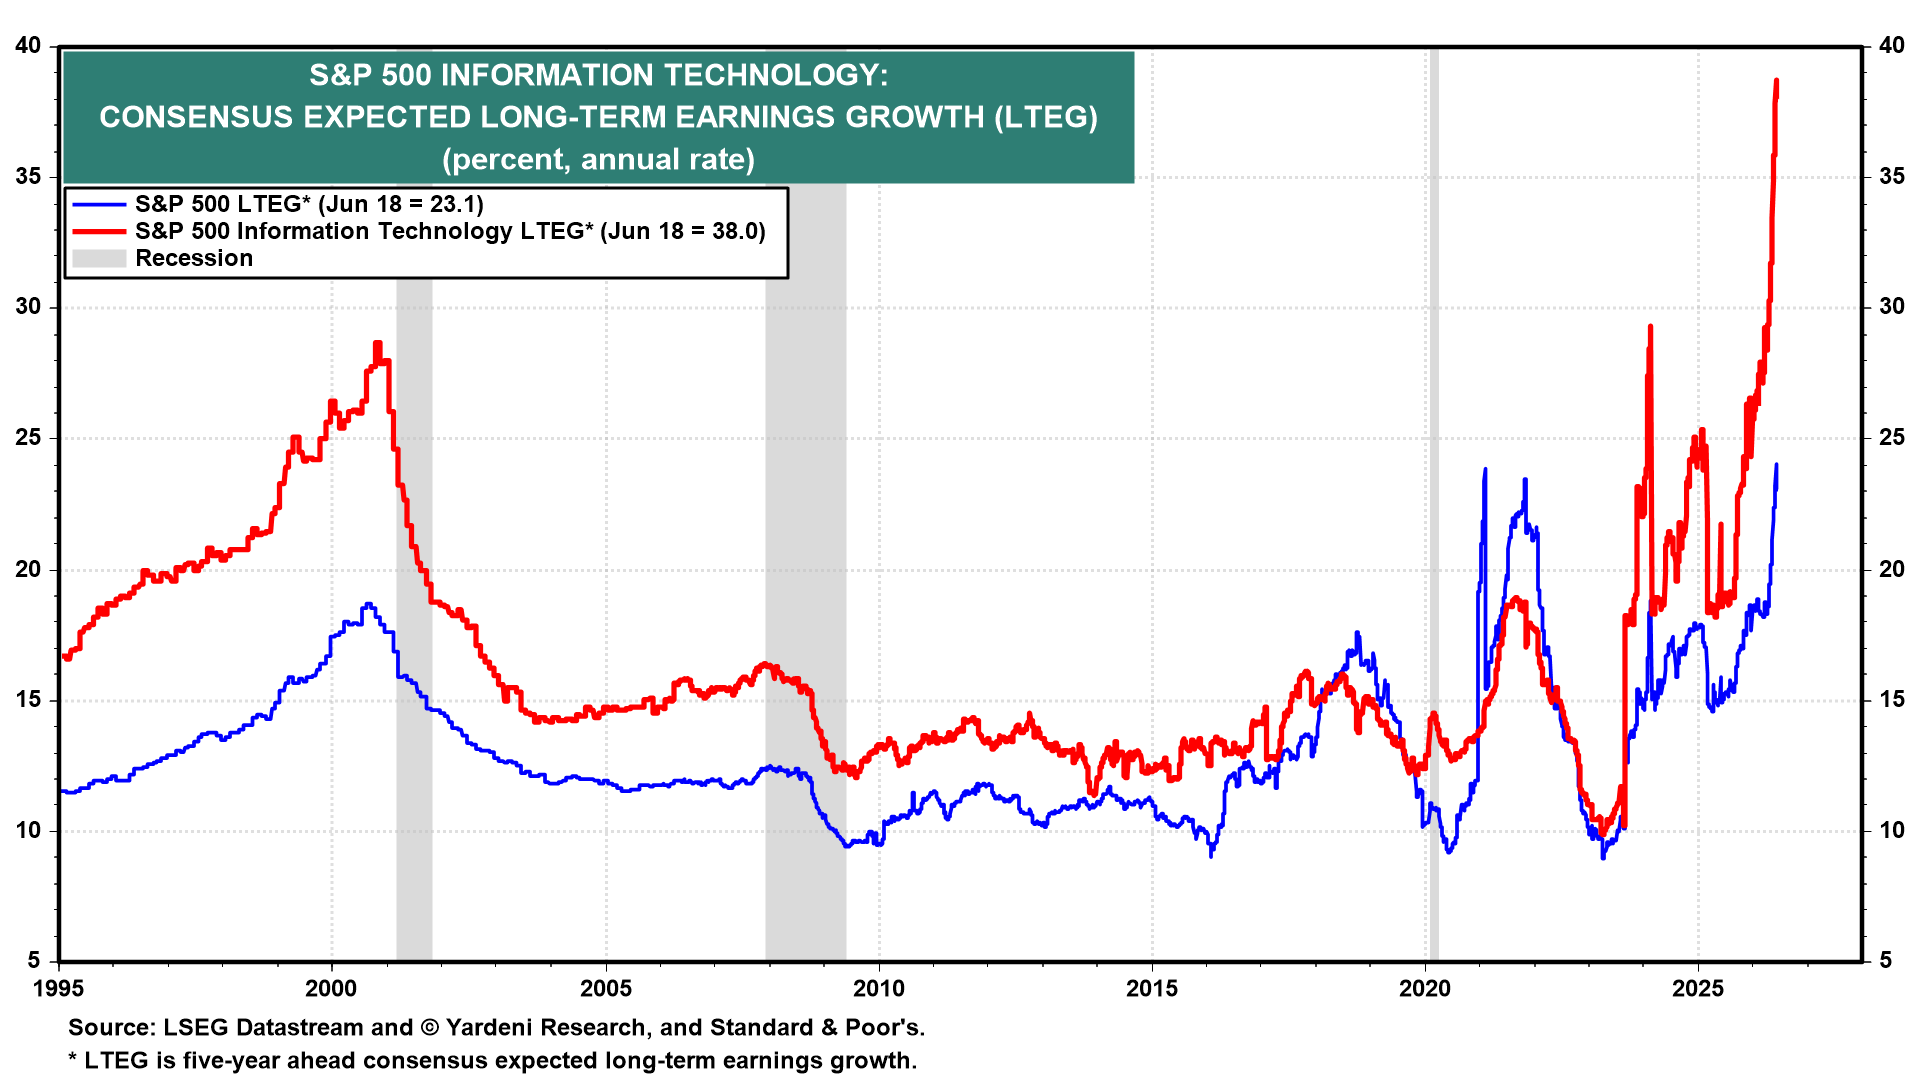
(1) FEMO. The S&P 500 Information Technology analysts' consensus expected long-term earnings growth (LTEG) soared to 38.0% during the week of June 18, while the S&P 500 LTEG climbed to 23.1% (chart). Both well exceed their 2000 peaks of 28.7 and 18.7 (chart). The 14.9-point spread between the two is wider today than the 10.0-point gap at the 2000 peak. Some of the FEMO is not pure operating income either. In Q1-2026, mark-to-market gains on equity investments in AI companies accounted for 58% of Alphabet's net profit, 52% of Amazon's, and 27% of Nvidia's. Circular financing across the AI hyperscalers is a related concern.
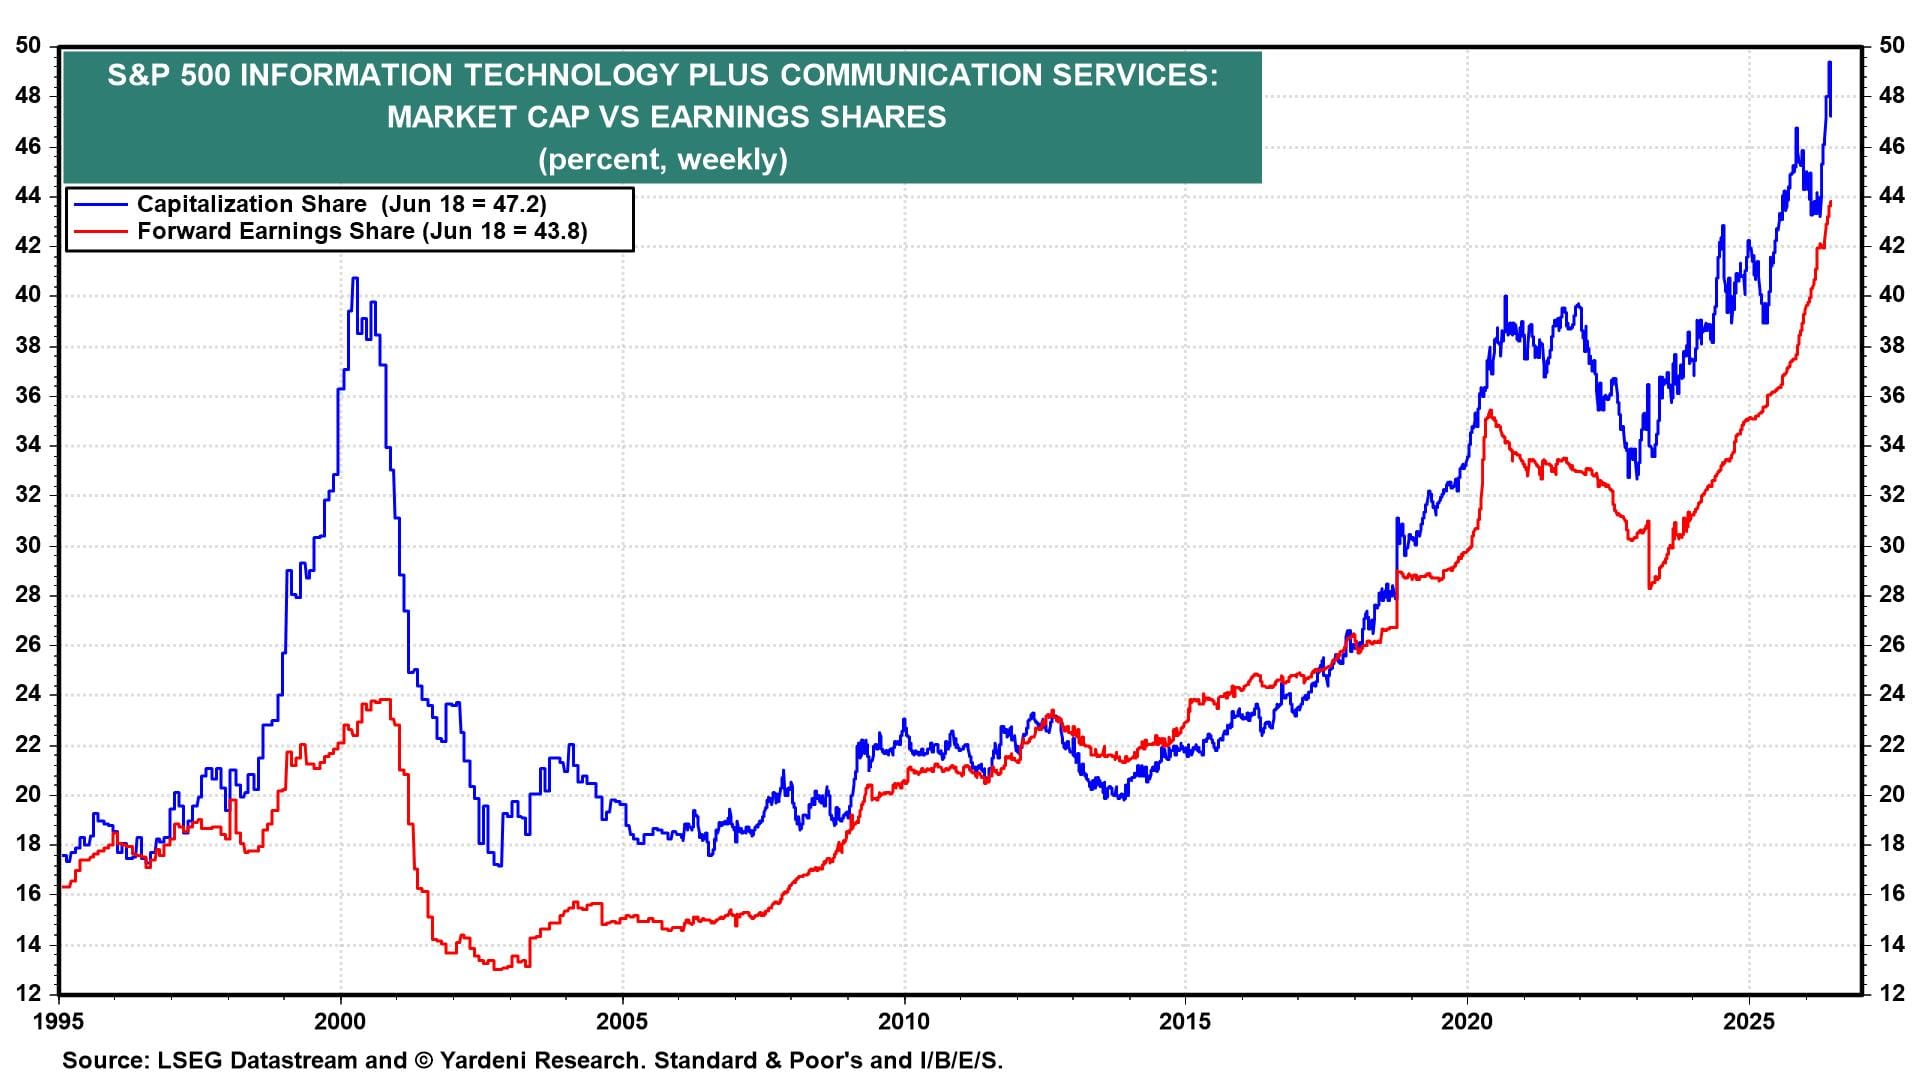
The Information Technology plus the Communication Services sectors of the S&P 500 currently account for a whopping 47.2% of the index's market capitalization (chart). That's not a sign of irrational exuberance, given that their combined forward earnings share of the index is 43.8%. However, irrational exuberance might play a role to some extent if the earnings expectations are unlikely to be realized for the reasons mentioned above.
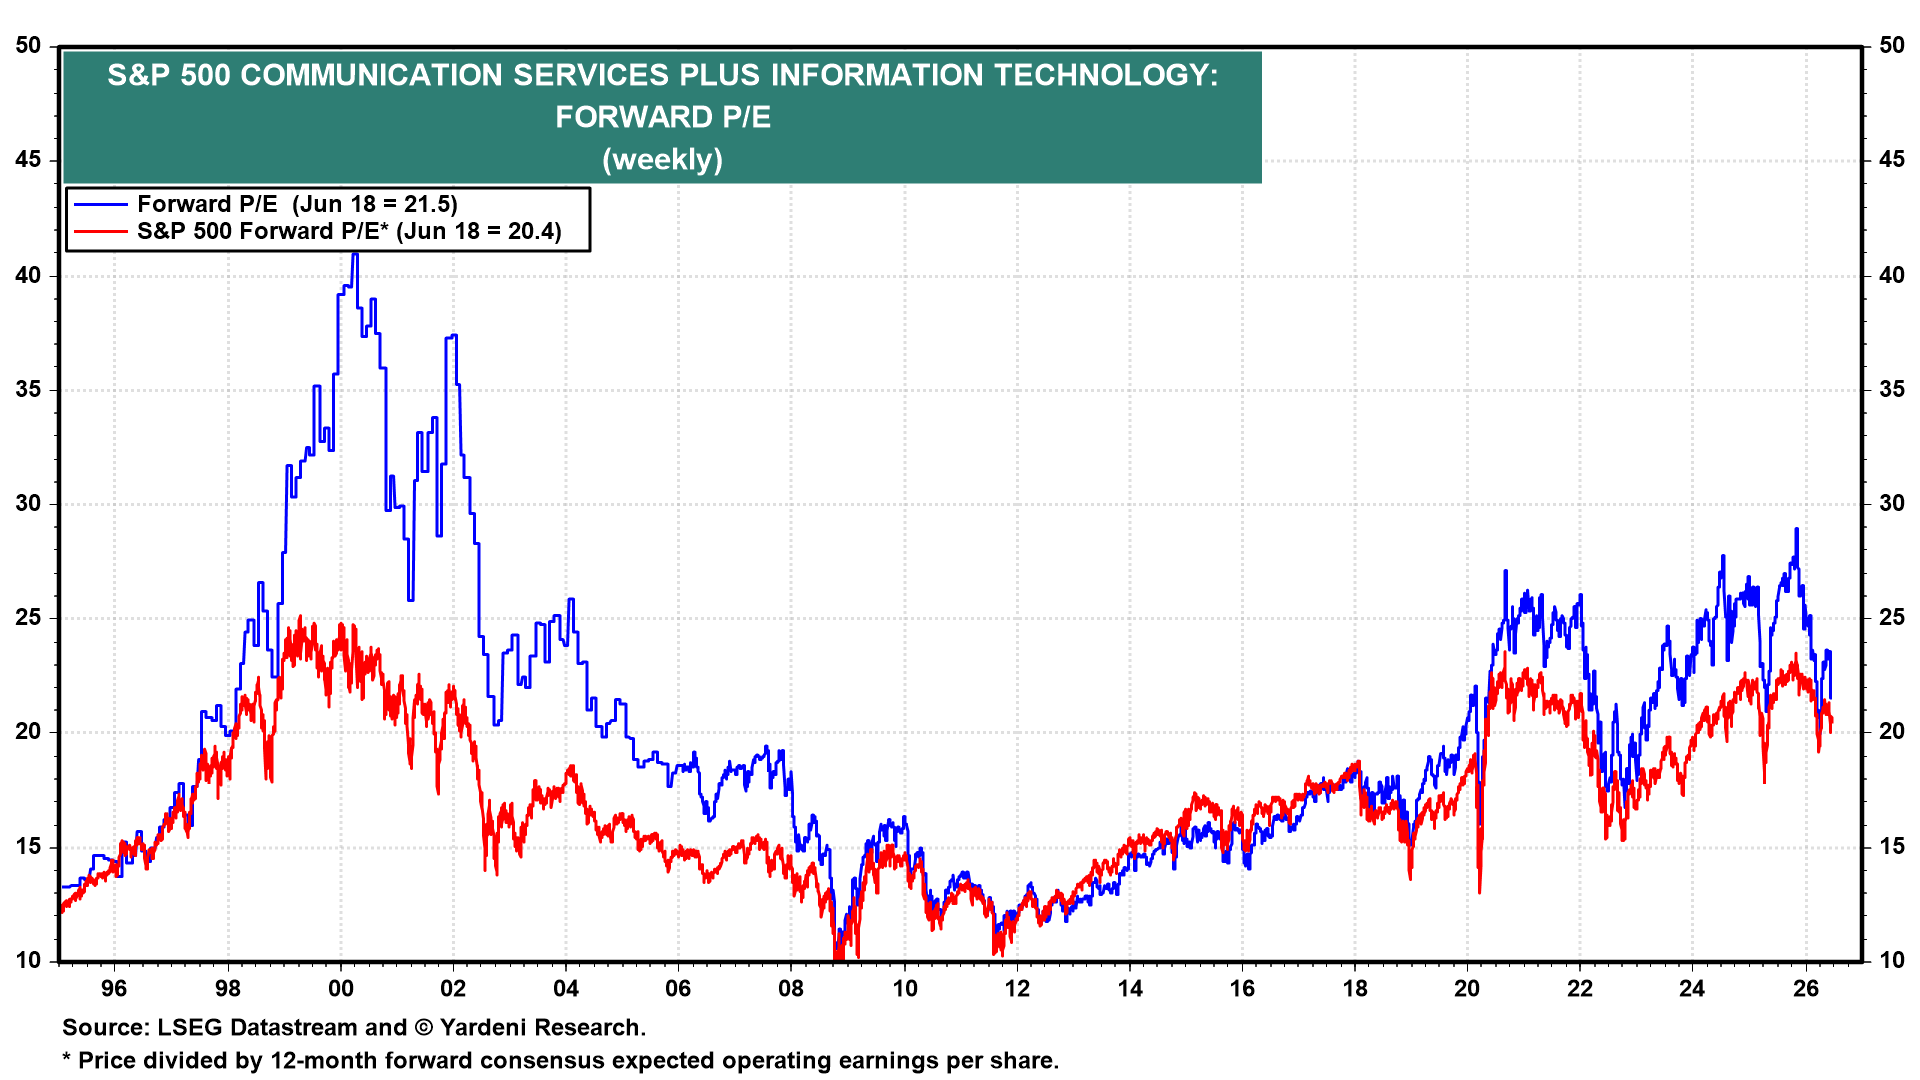
Then again, investors certainly aren't valuing the analysts' earnings outlooks for the two sectors as highly as they did during the tech bubble of the late 1990s (chart). Back then, it was FOMO driving the bull market. Now it's FEMO.
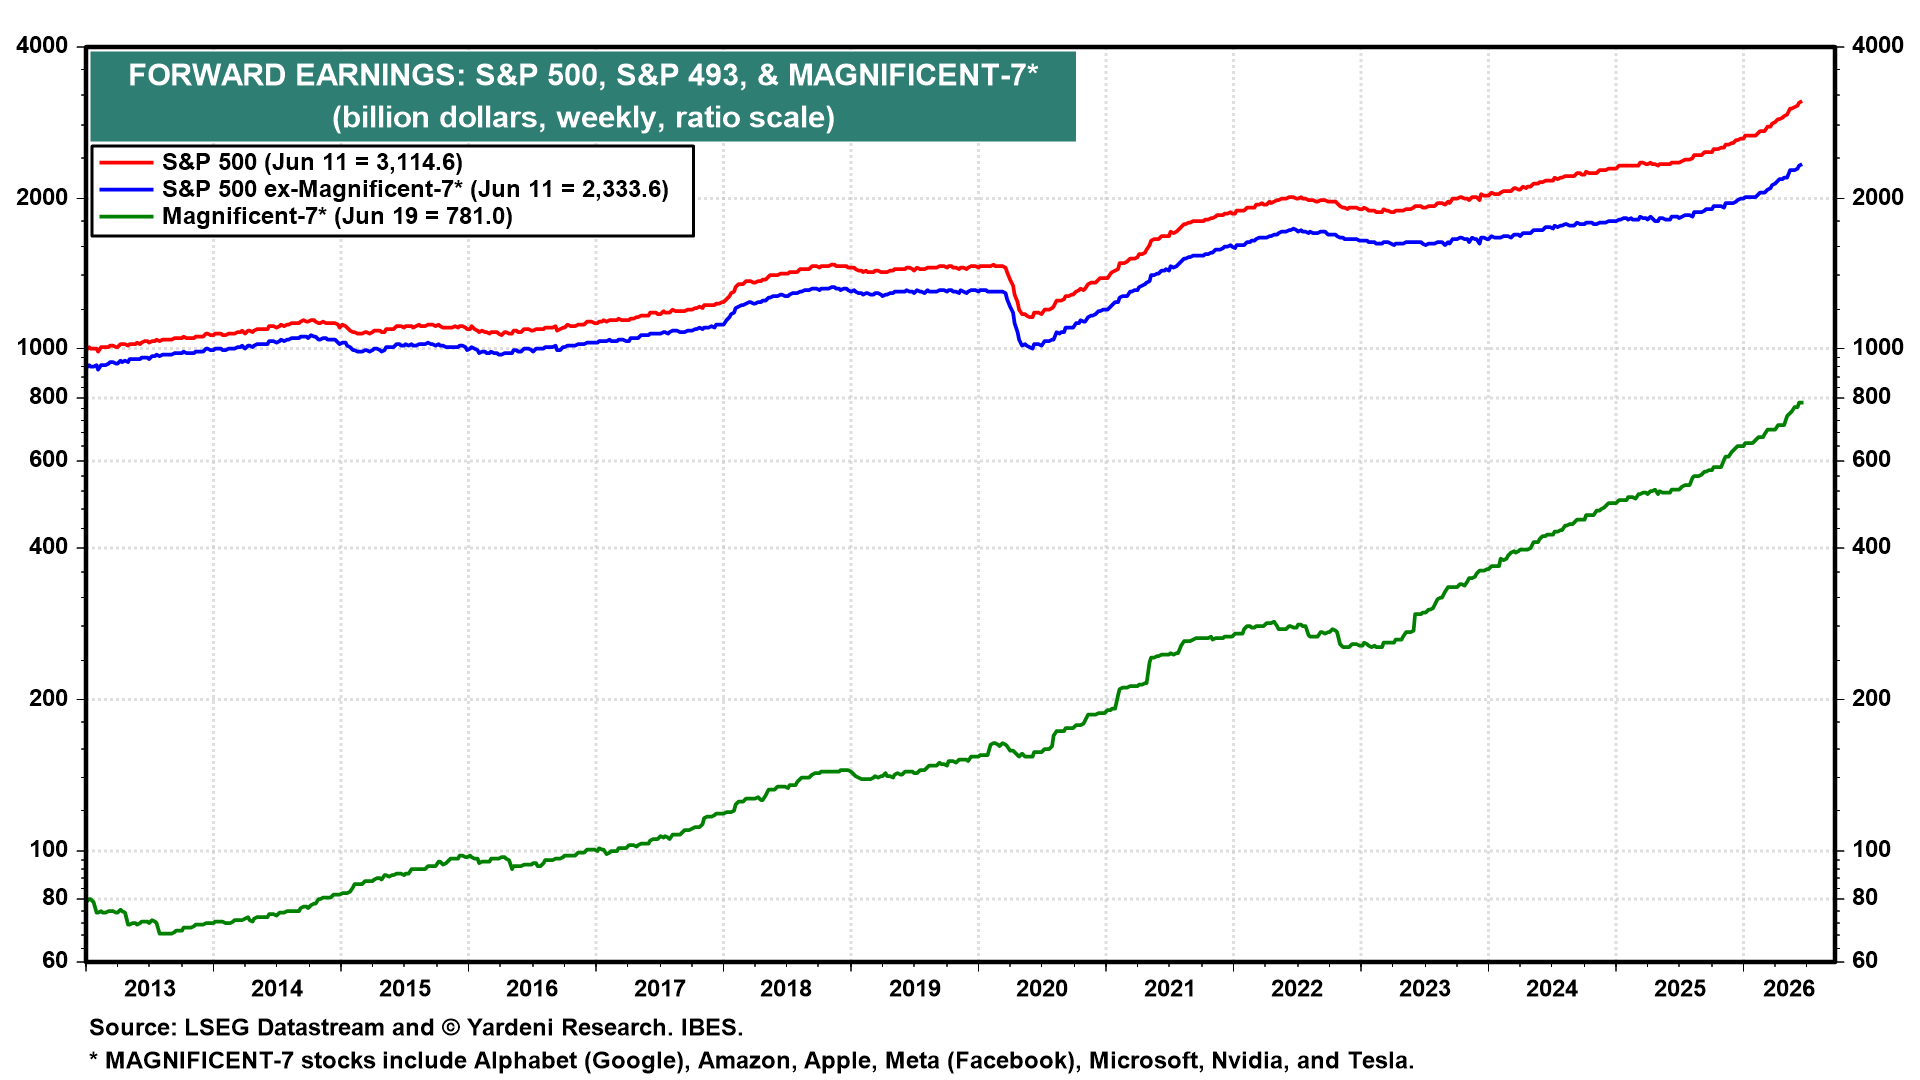
While the earnings quality of the Magnificent-7 might be reduced by circular financing and capital gains, that's not an issue for the earnings of the Impressive-493, which has been increasing at a faster pace since mid-2025 (chart).
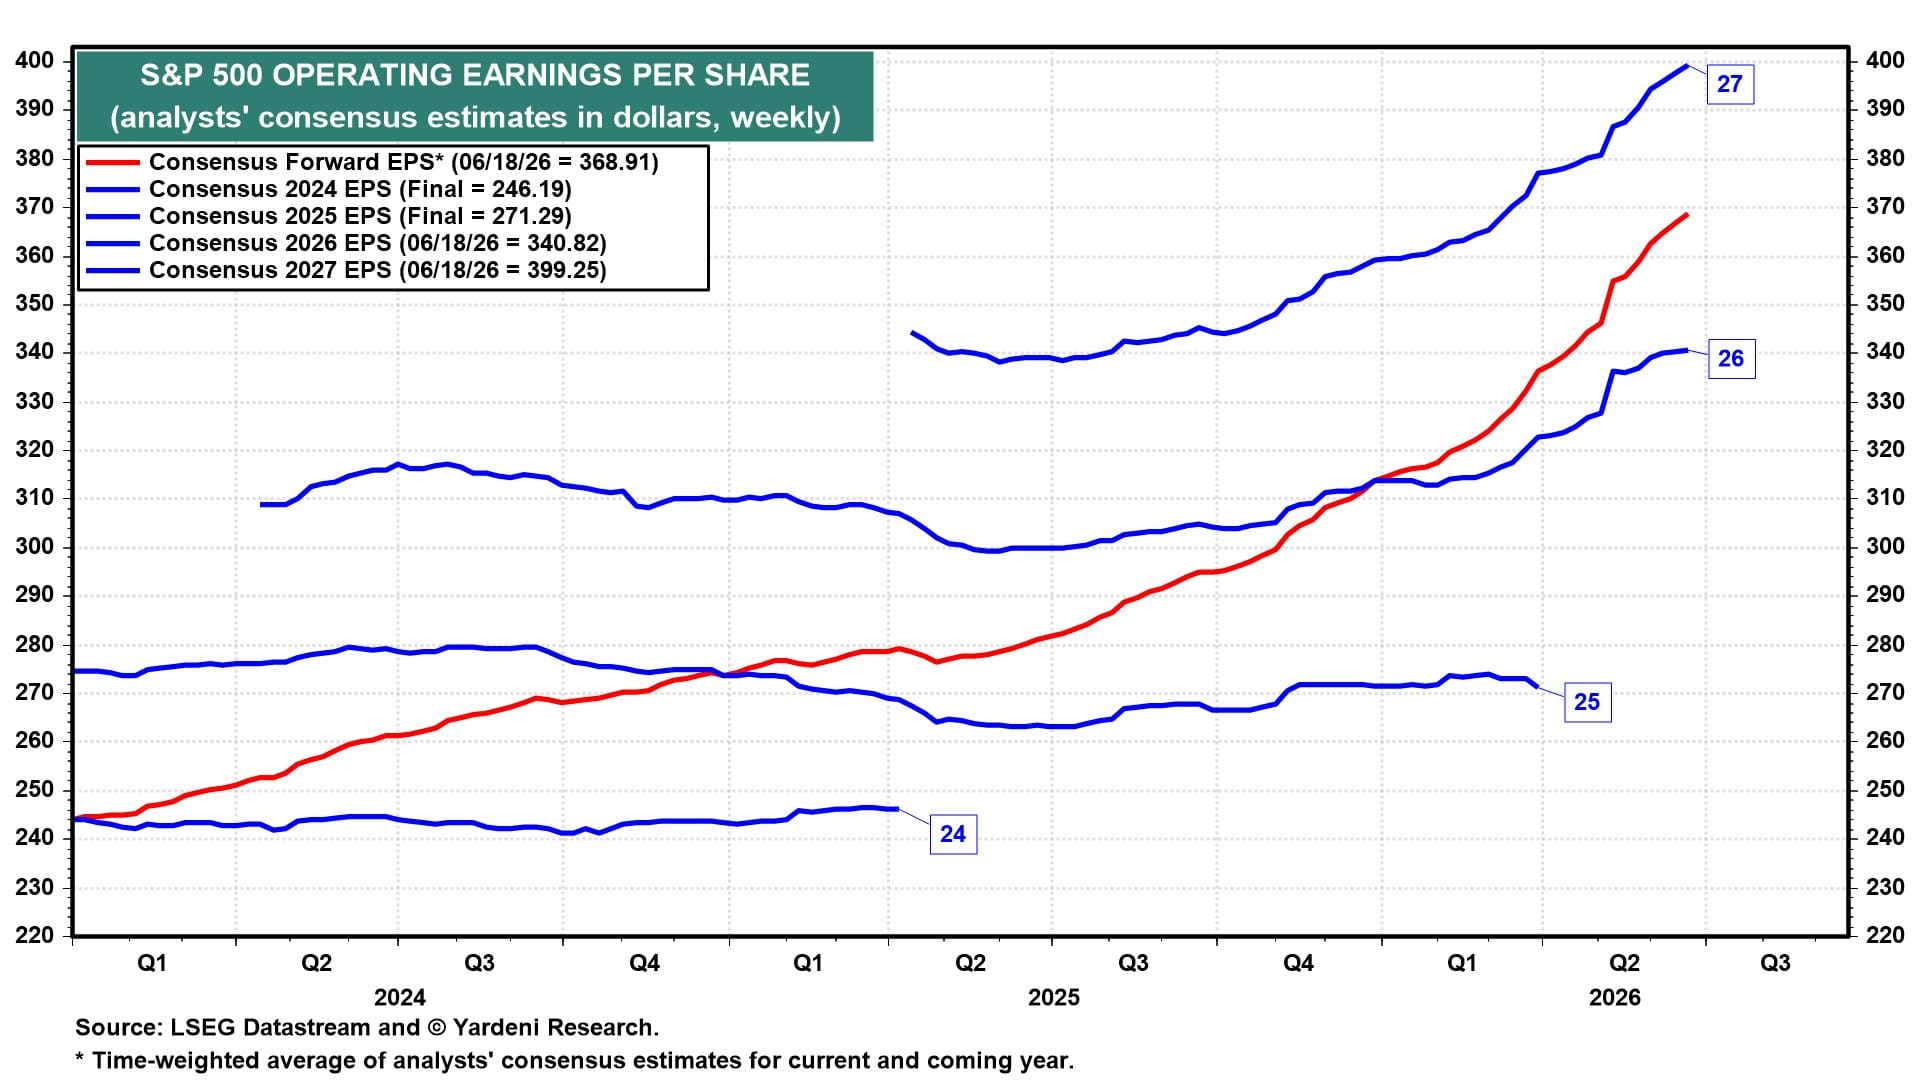
Meanwhile, S&P 500 forward EPS rose to $368.91 during the June 18 week, with 2026 at $340.82 and 2027 at $399.25 (chart). That's another record high for forward earnings.
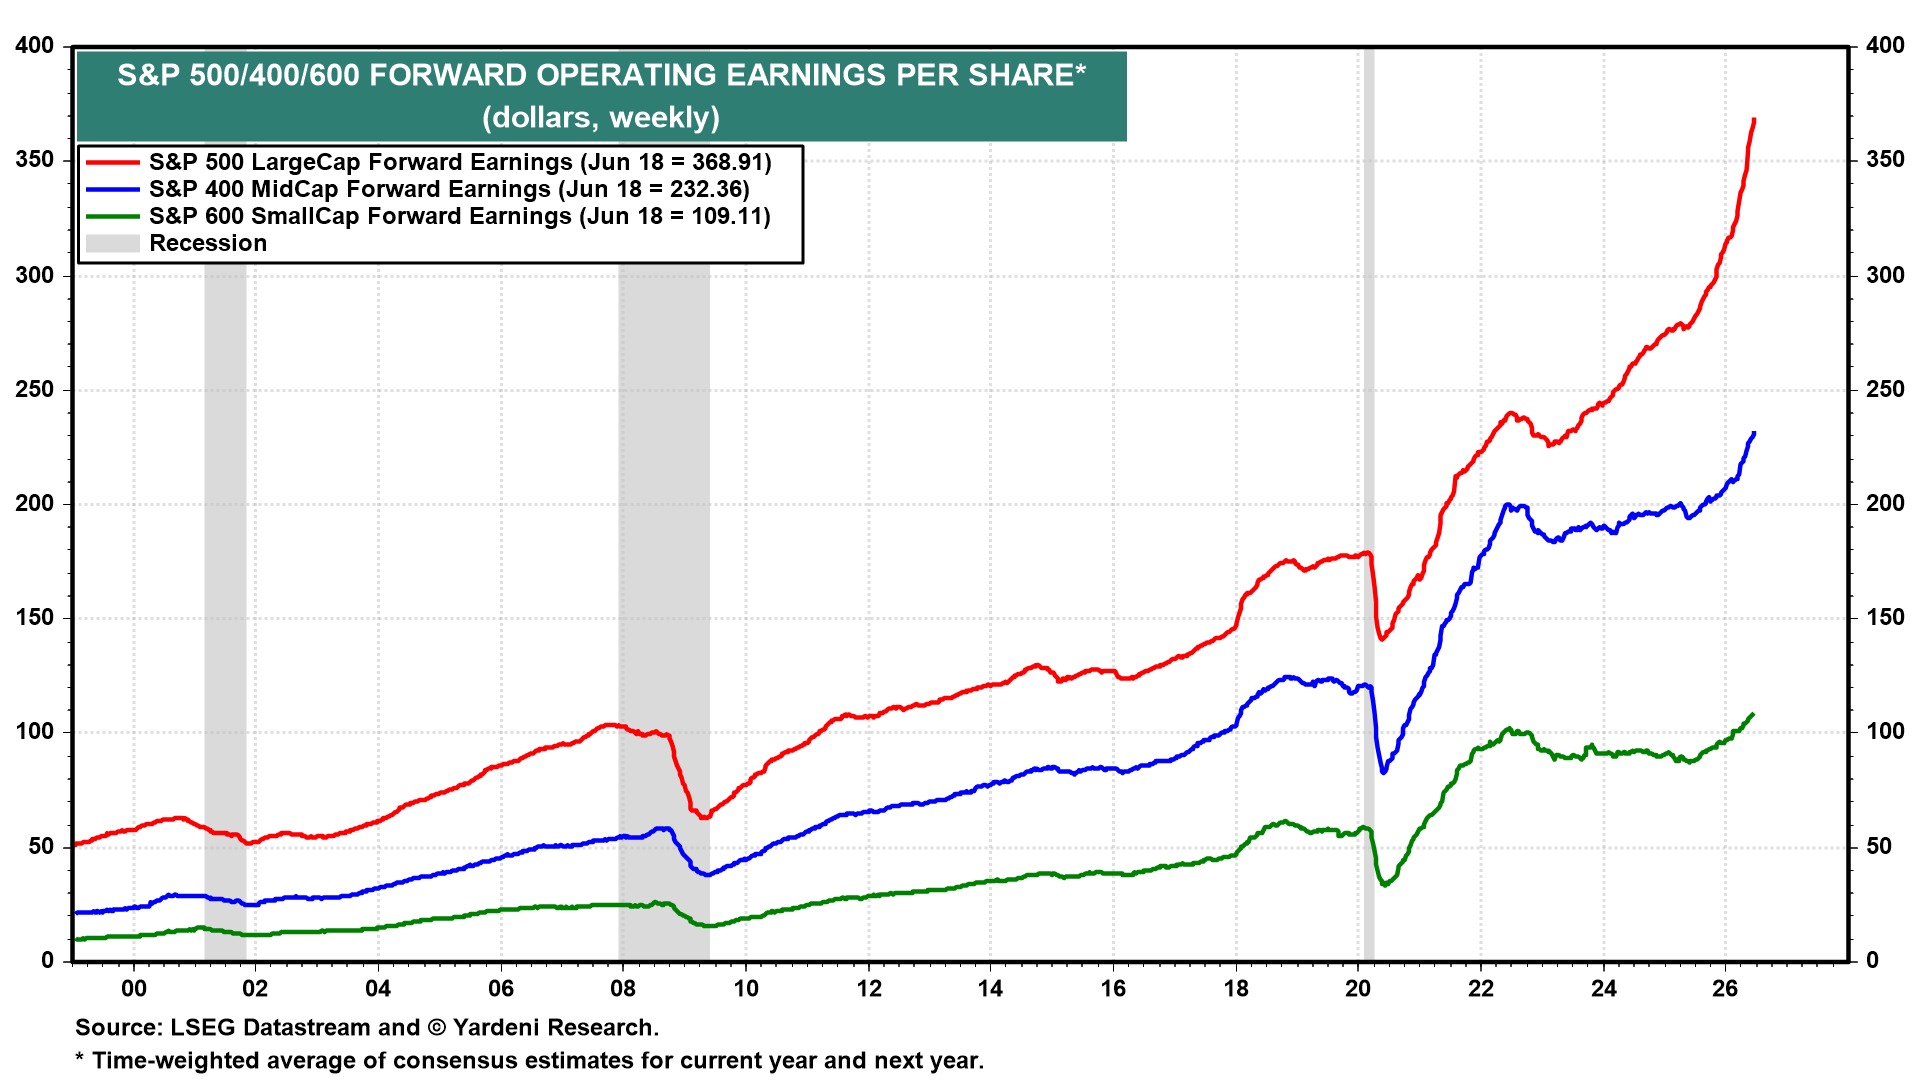
S&P 600 SmallCap and S&P 400 MidCap forward earnings also have been rising at faster paces over the past year, to record highs (chart). FEMO is broadening.
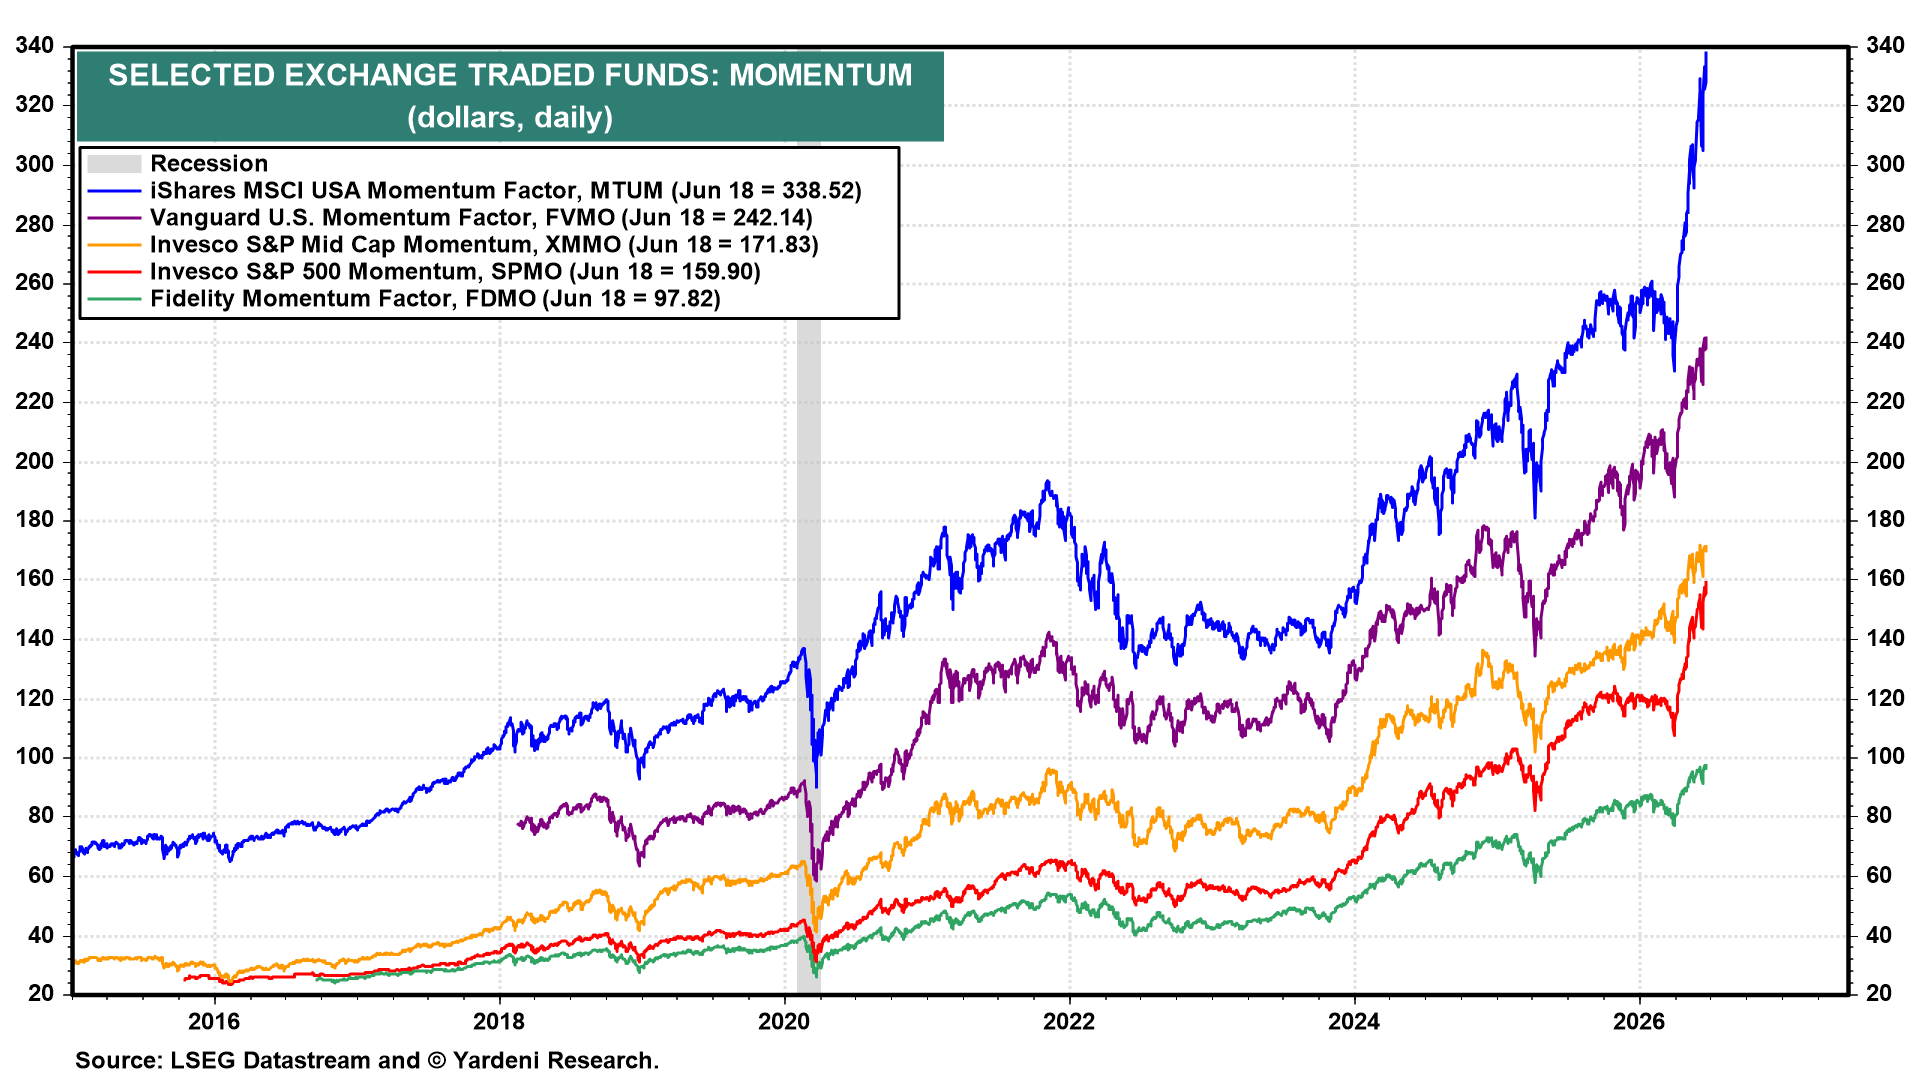
(2) Stocks. FEMO is driving Momentum ETFs to record highs, led by iShares MSCI USA Momentum (MTUM), up 33.9% ytd (chart).
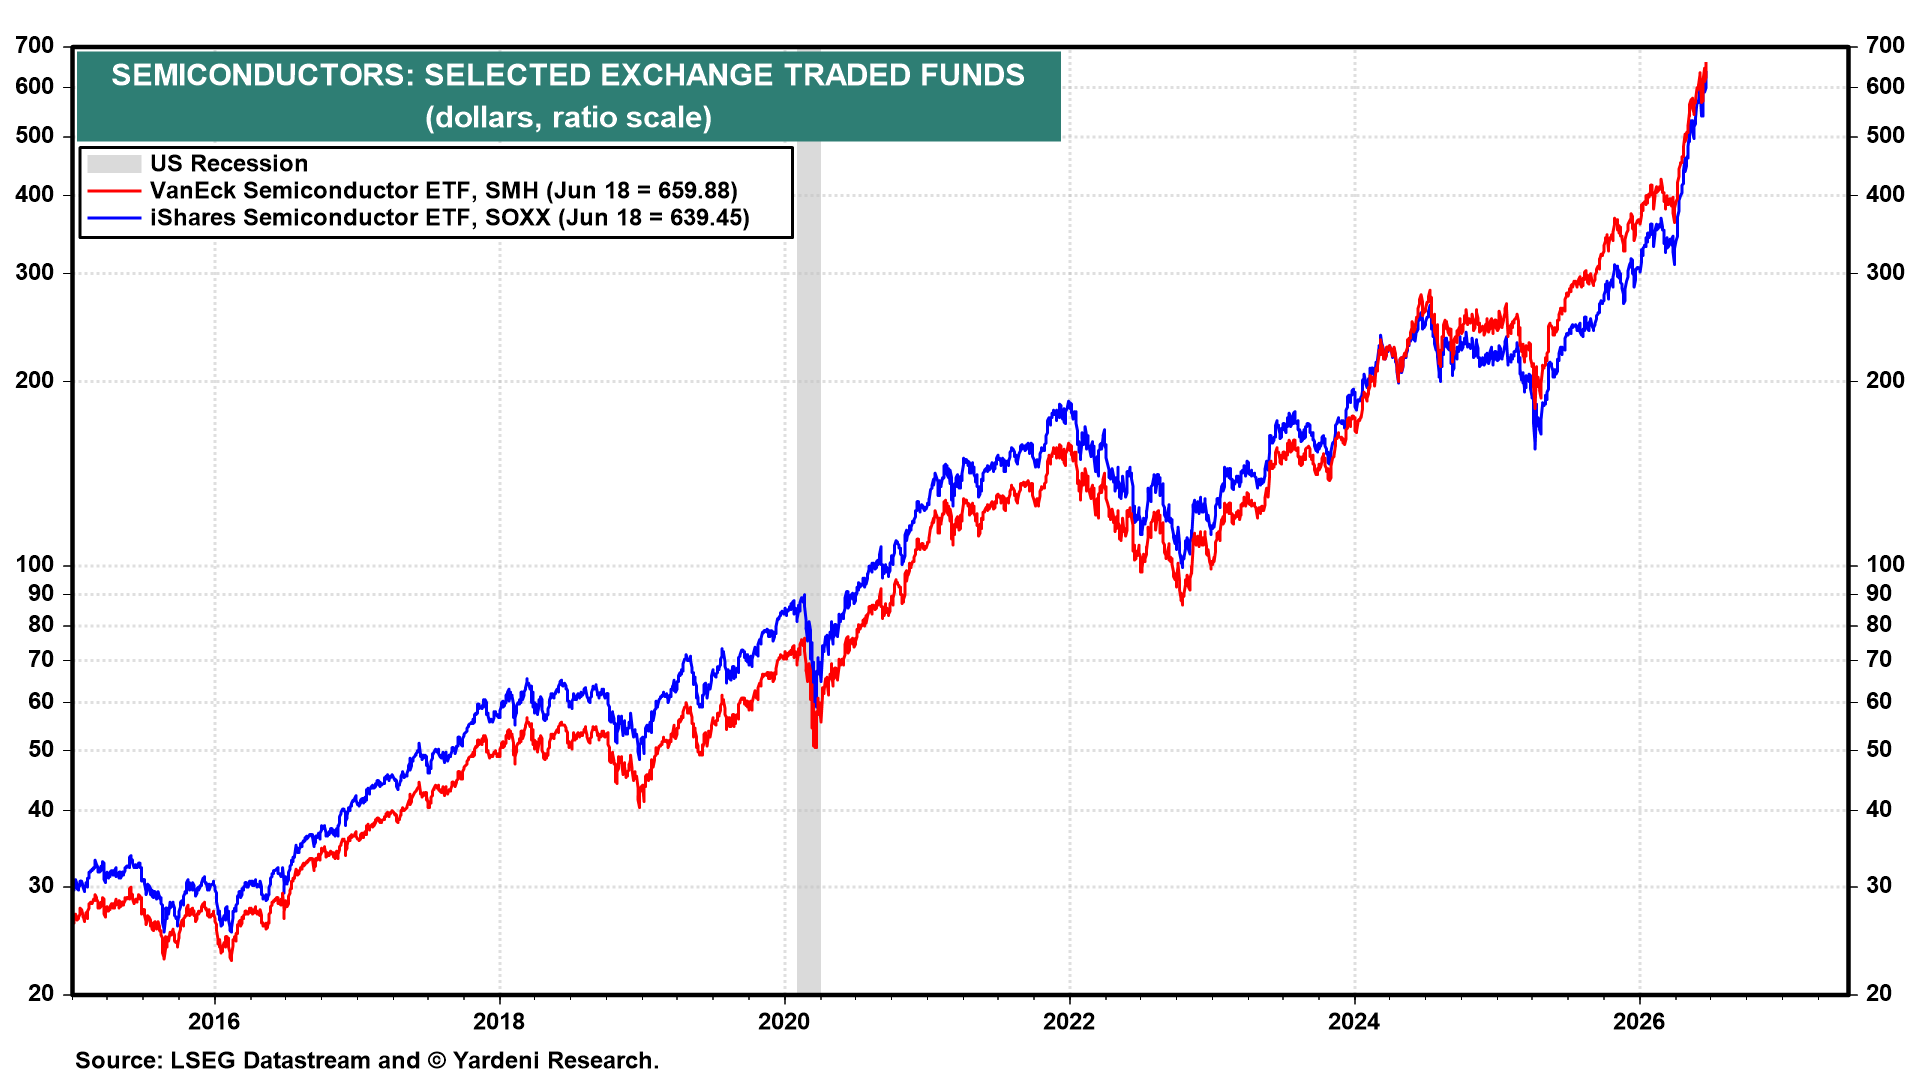
Semiconductor ETFs are also at record highs (chart). Micron is now the third-largest weighting in SMH after a 259% ytd return.
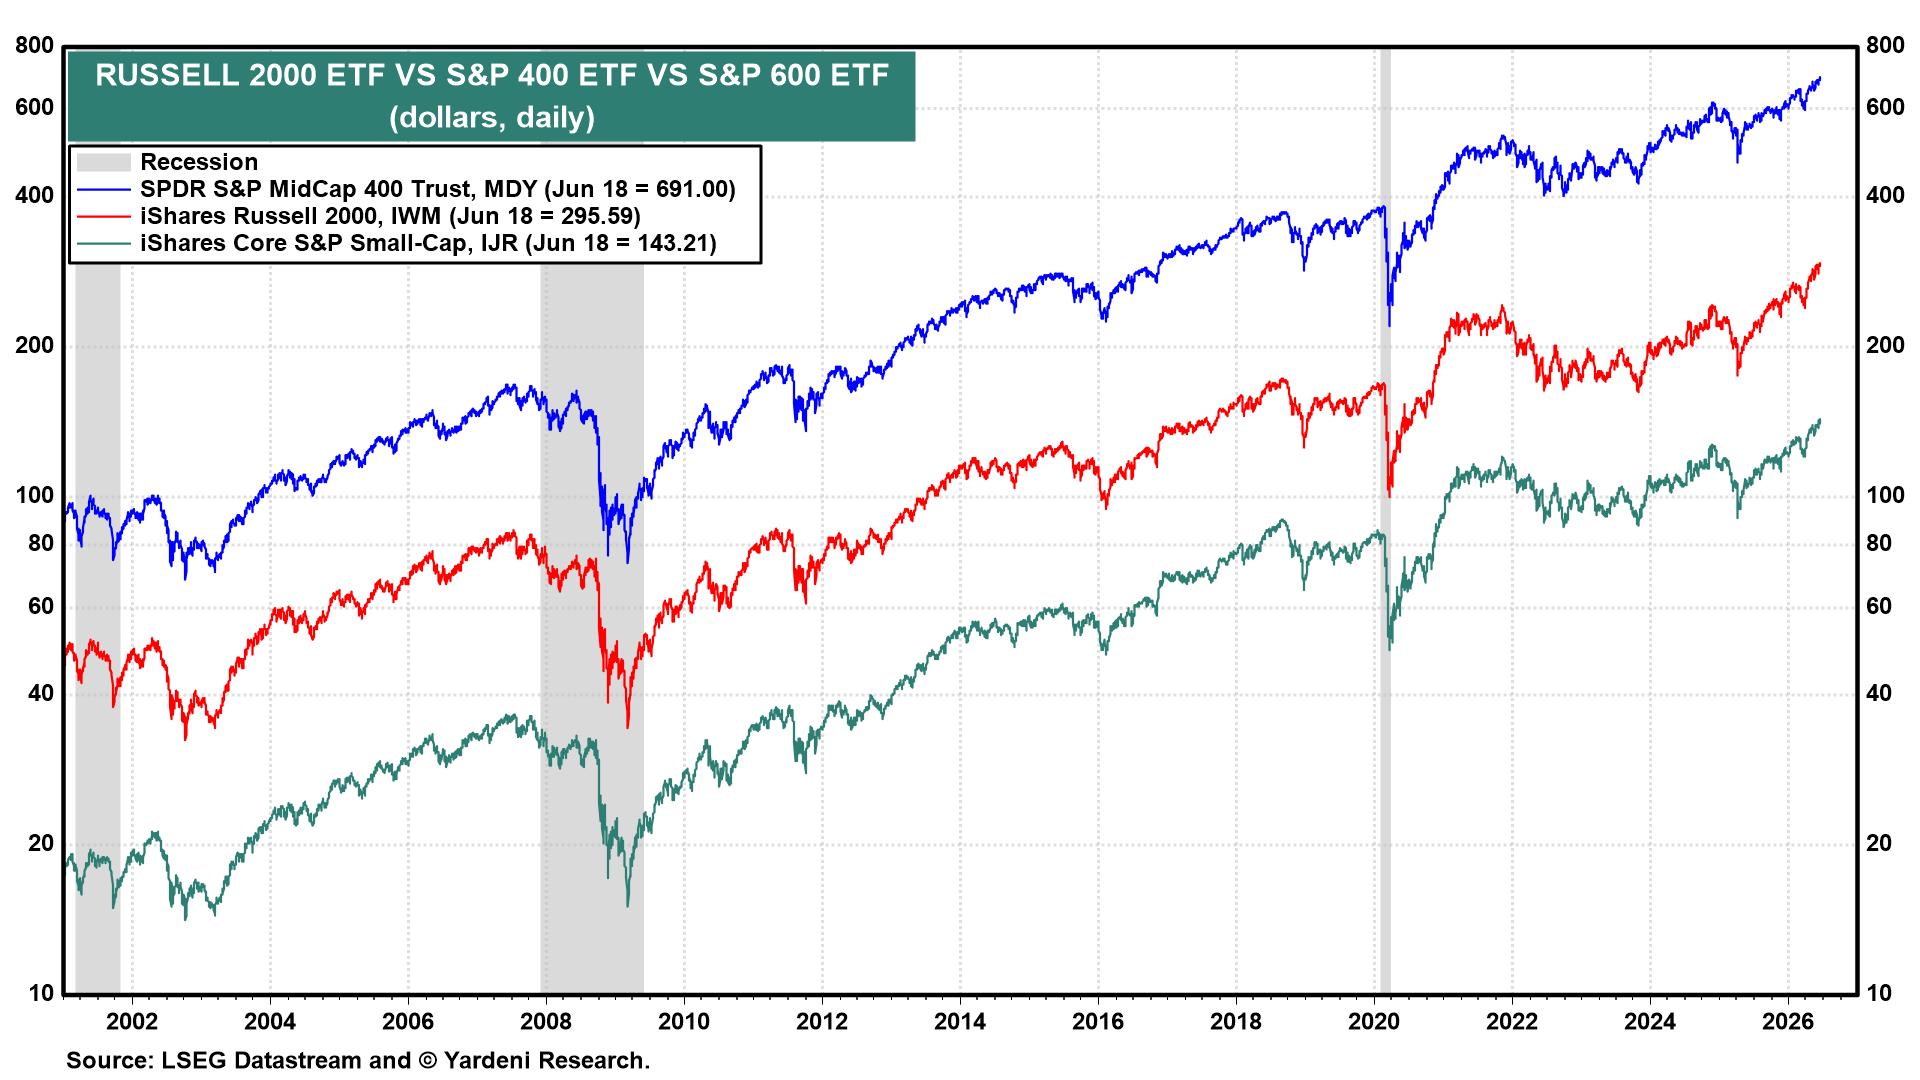
The Russell 2000 ETF (IWM) is breaking out to new highs, a sign that the rally is broadening beyond mega-cap stocks (chart).
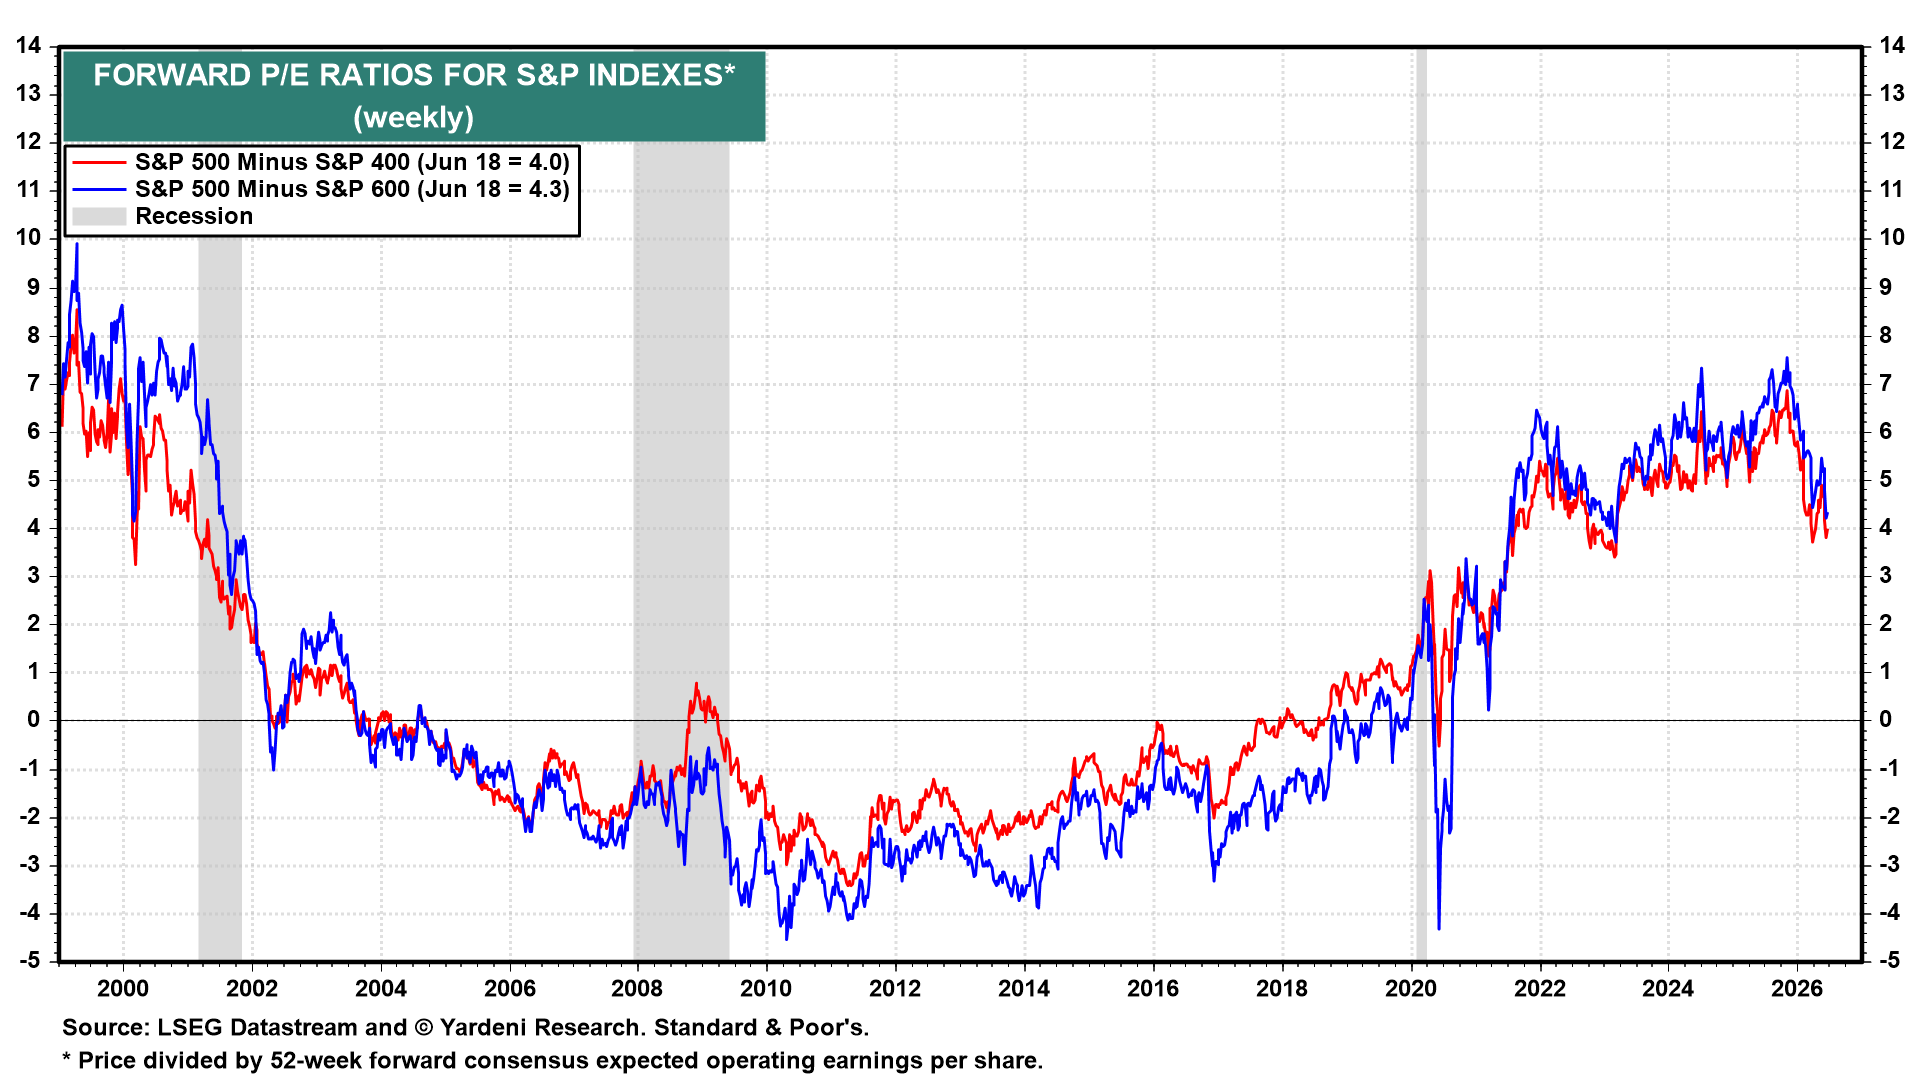
(3) Valuation & sentiment. The forward P/E spread between the S&P 500 and S&P 400 has narrowed to 4.0, and the spread to the S&P 600 is at 4.3 (chart). Both are off late-2025 highs of 6.9 and 7.5.
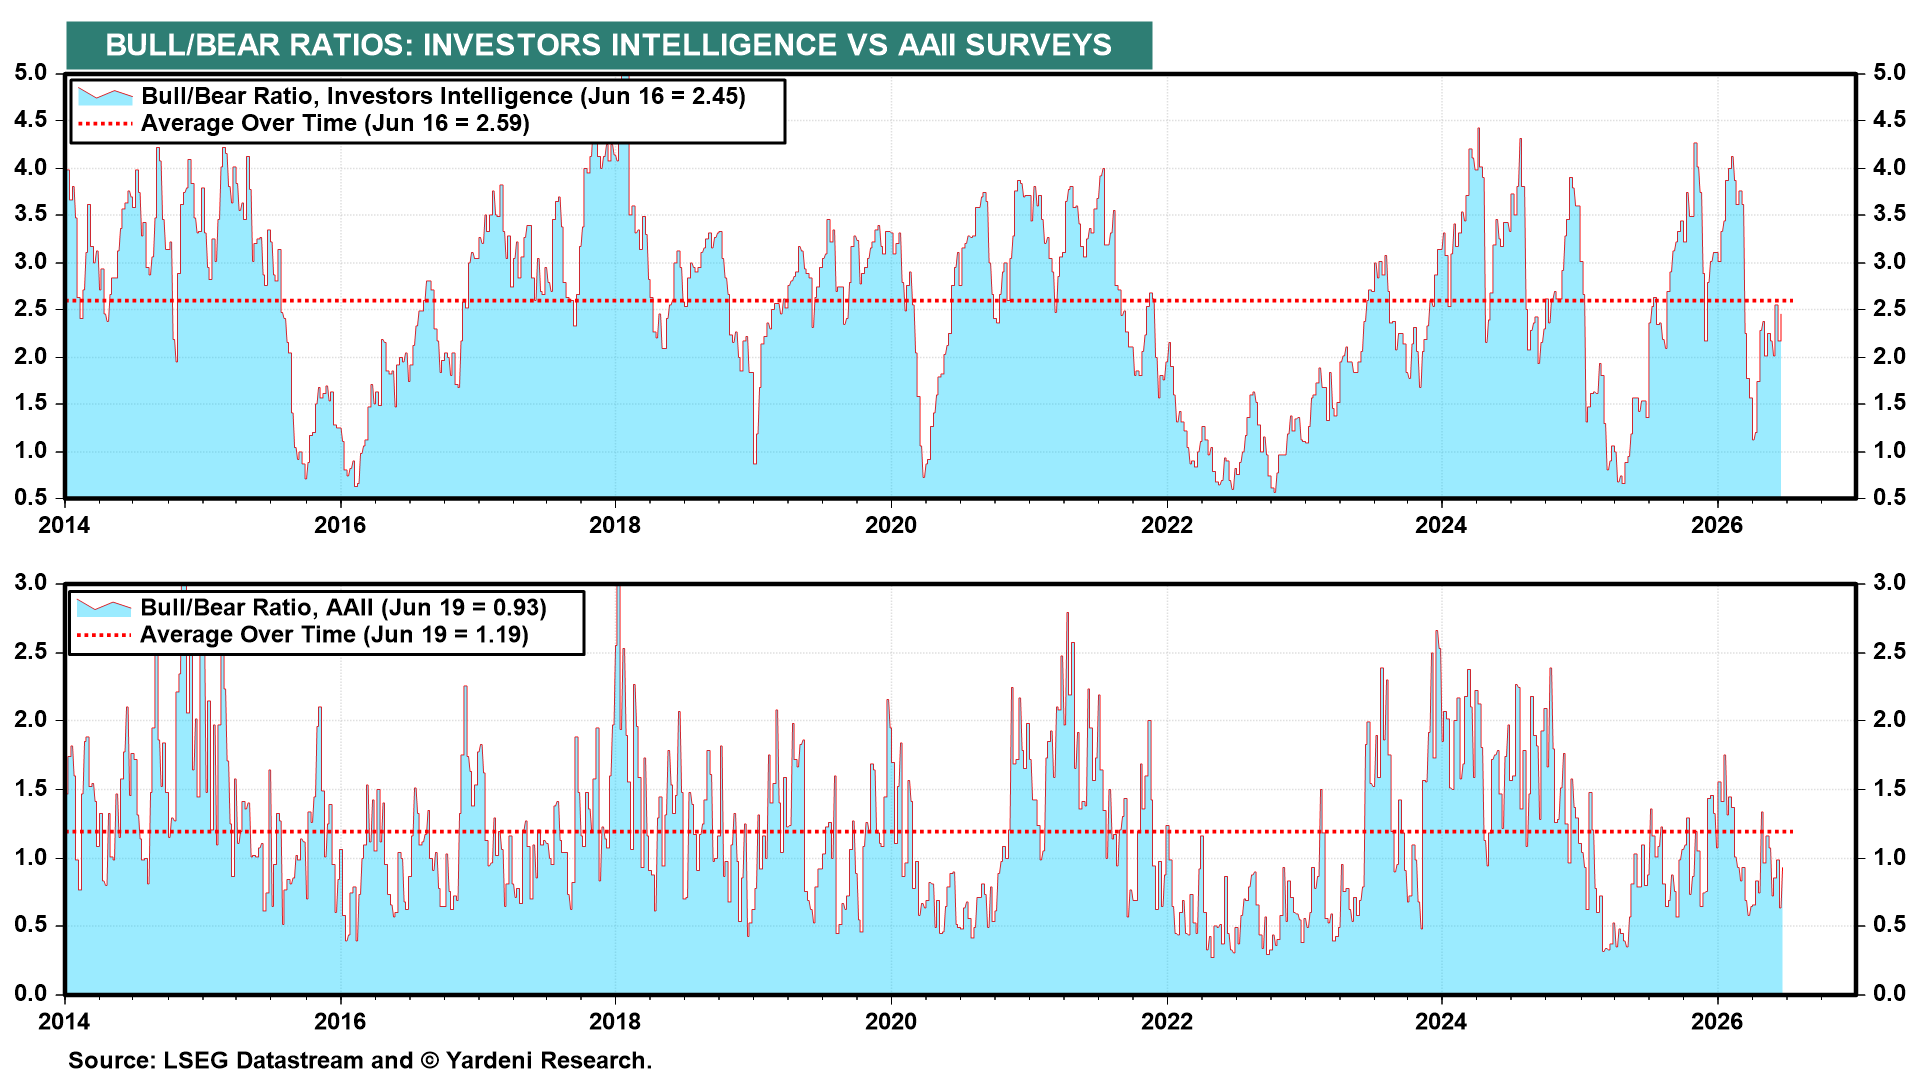
The Investors Intelligence Bull/Bear ratio is 2.45 against its long-run average of 2.59, and the AAII ratio is 0.93 against its 1.19 average (chart). Sentiment is balanced, neither too bullish nor too bearish.
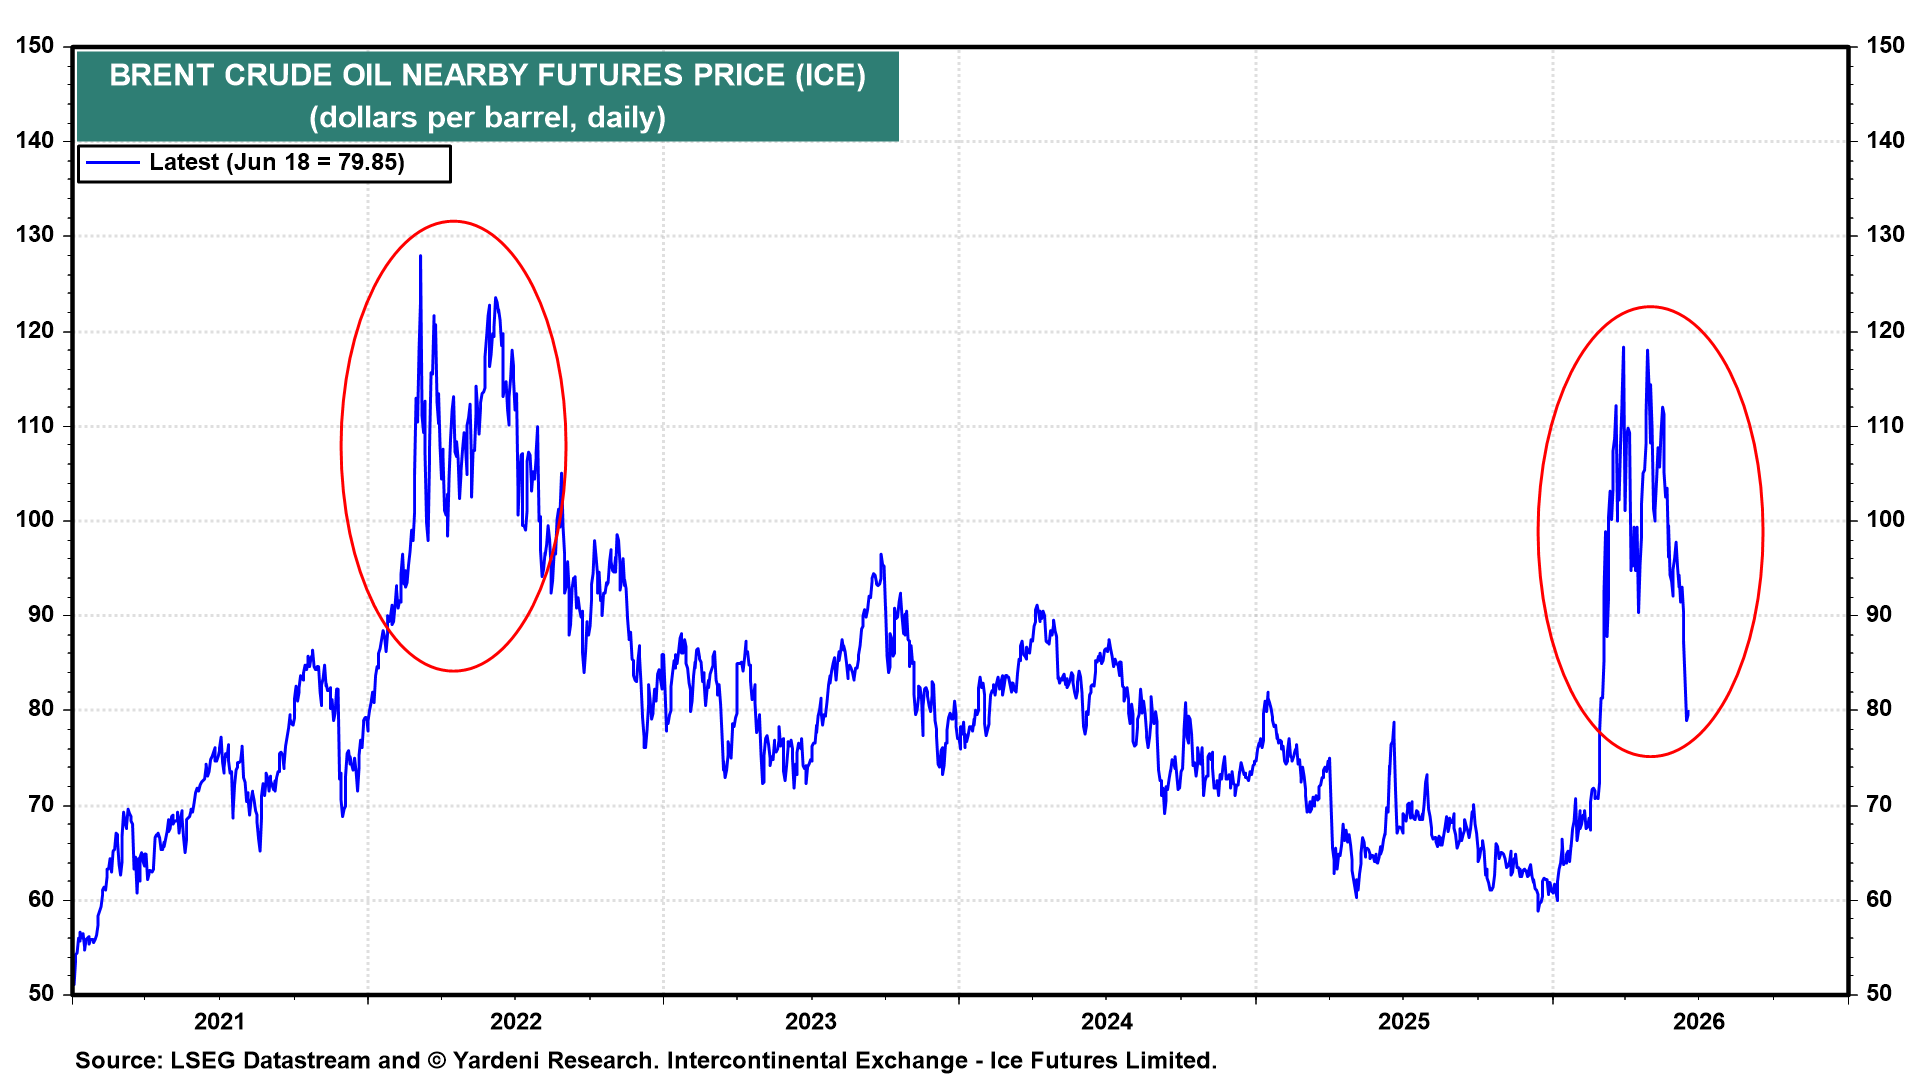
(4) Commodities. The price of Brent crude is down sharply to $79.85 a barrel in recent days (chart). That should contribute to more FEMO in the coming weeks. Then again, the oil price might rebound if the latest peace deal is already falling apart.
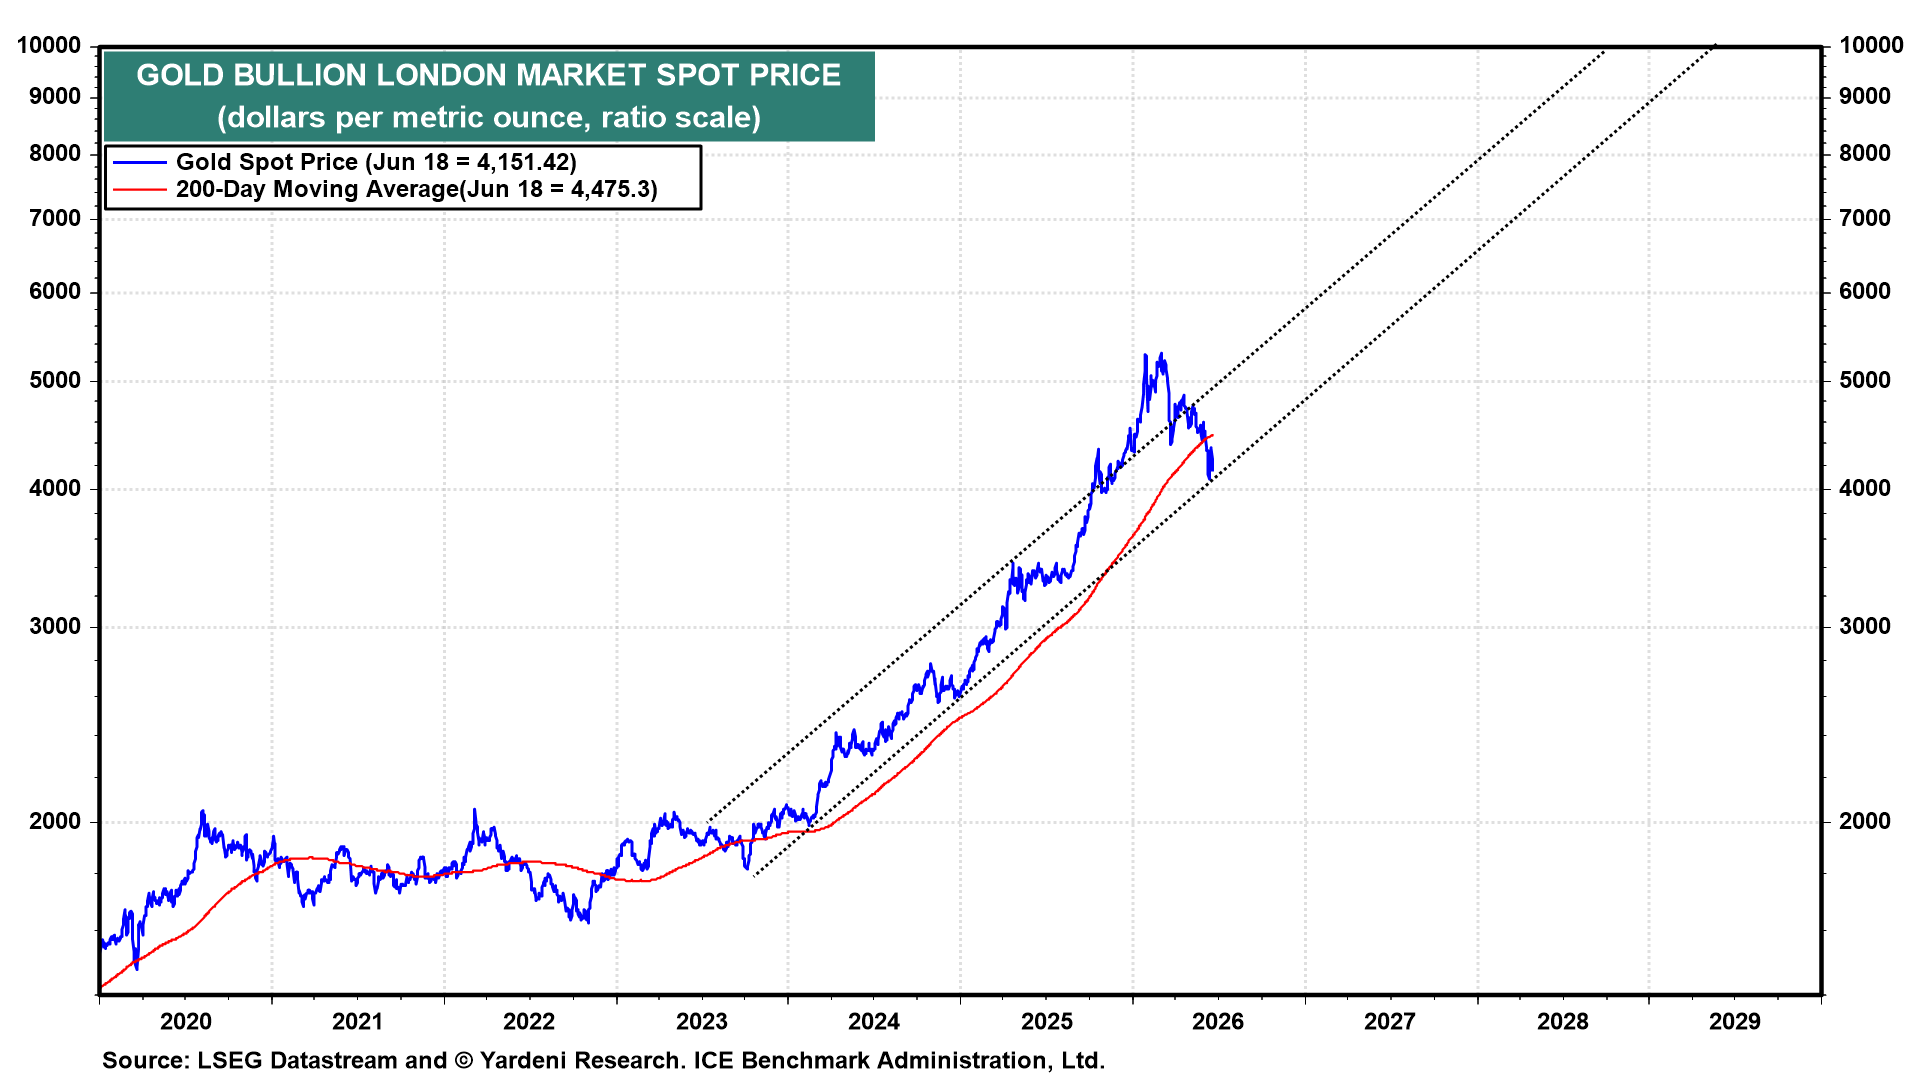
The price of gold might have bottomed around $4,000 an ounce a few days ago (chart). However, a hawkish Fed might continue to weigh on this price.
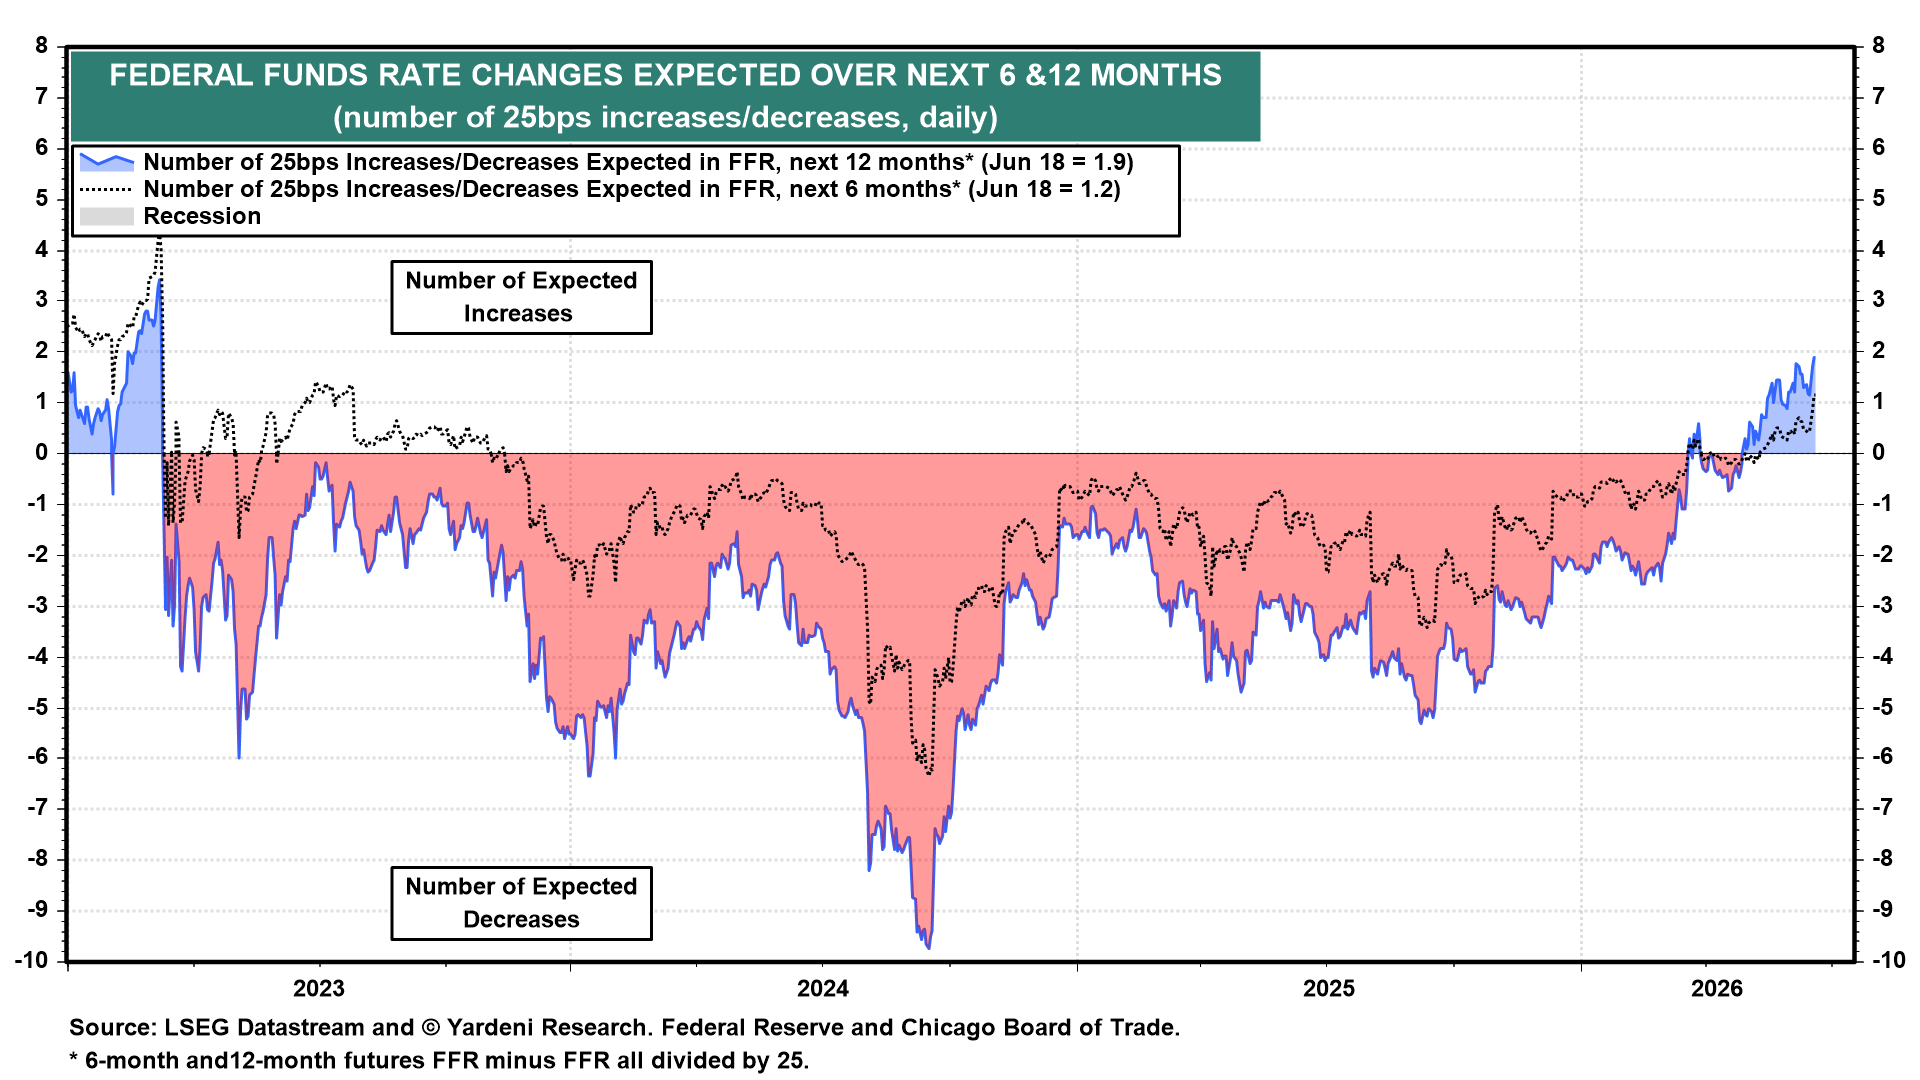
(5) Credit. The markets have repriced since Fed Chair Kevin Warsh's debut presser last Wednesday, with federal funds rate (FFR) futures now pointing to one 25bps FFR increase over the next six months and two over the next 12 months (chart).
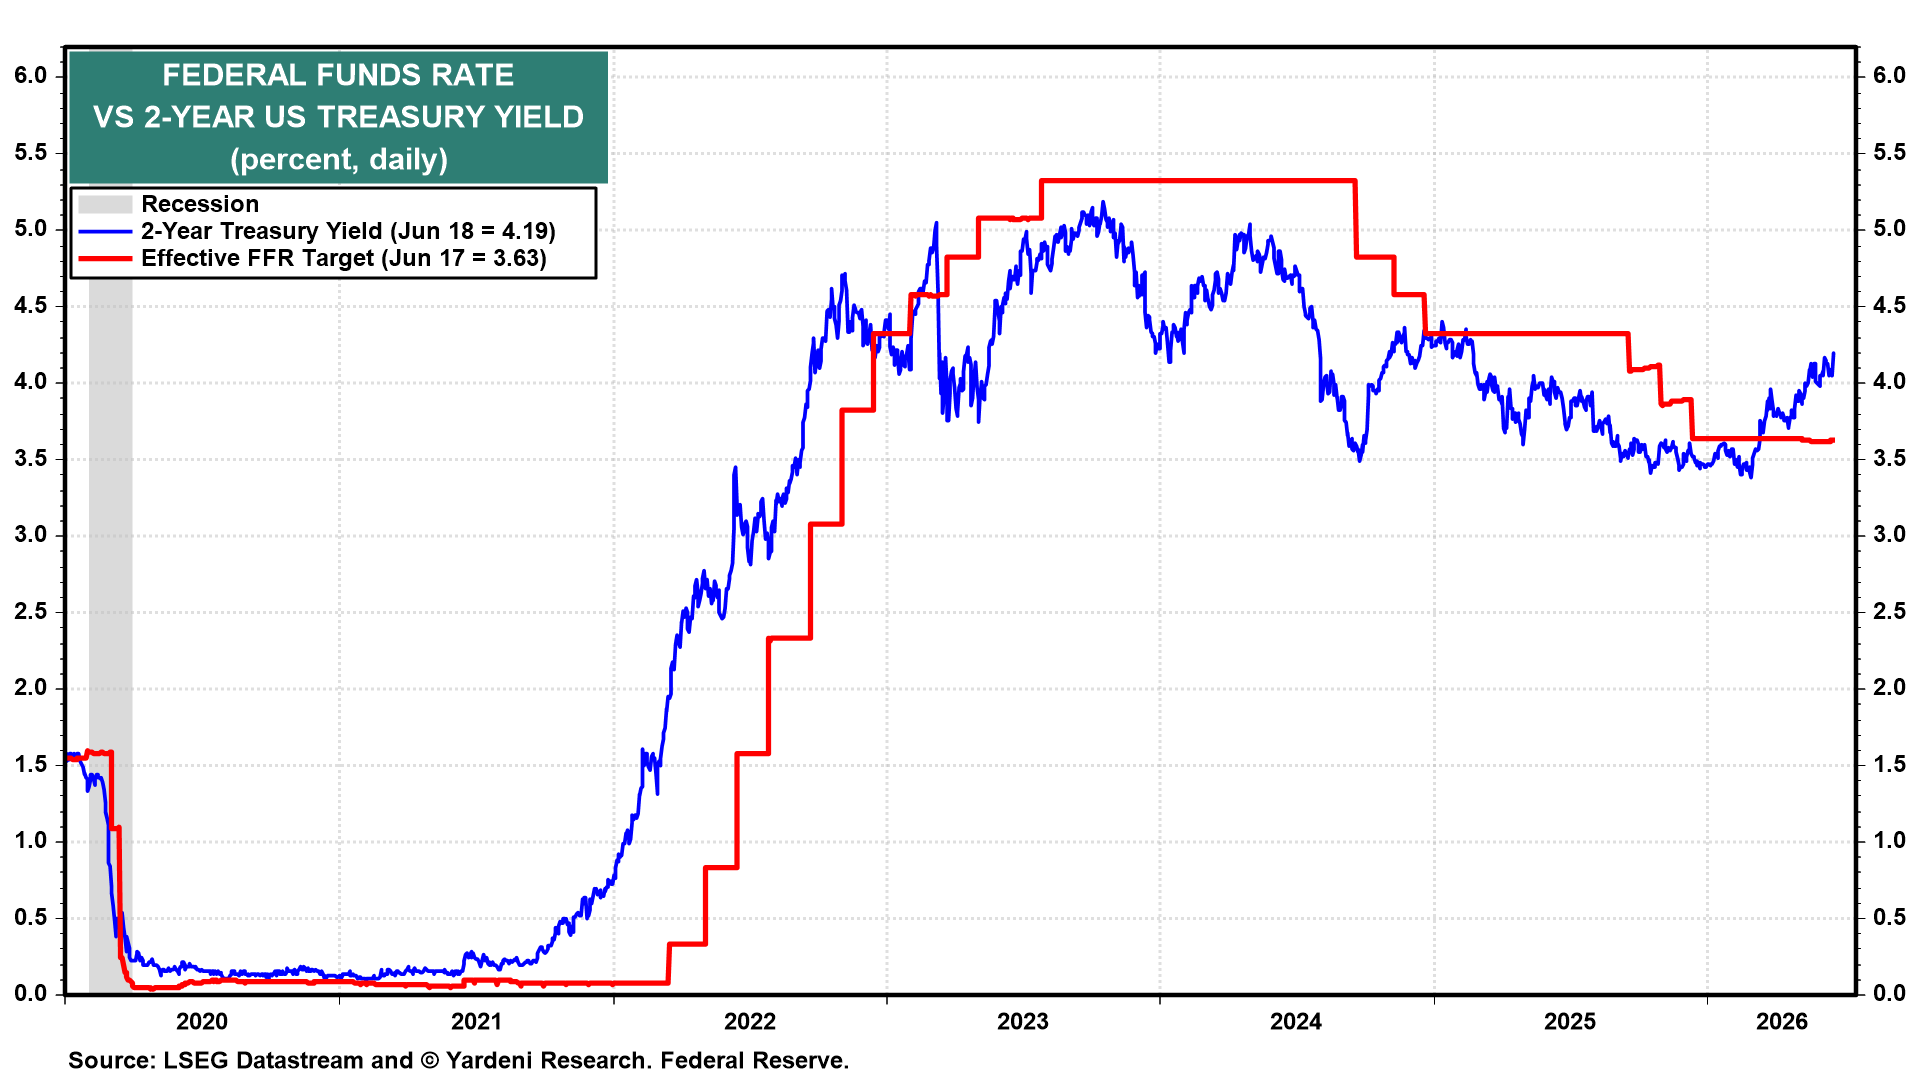
The 2-year Treasury yield at 4.19% is well above the effective FFR of 3.63% (chart). The spread between the 2-year and 10-year Treasury yields has flattened to its tightest level in a year.
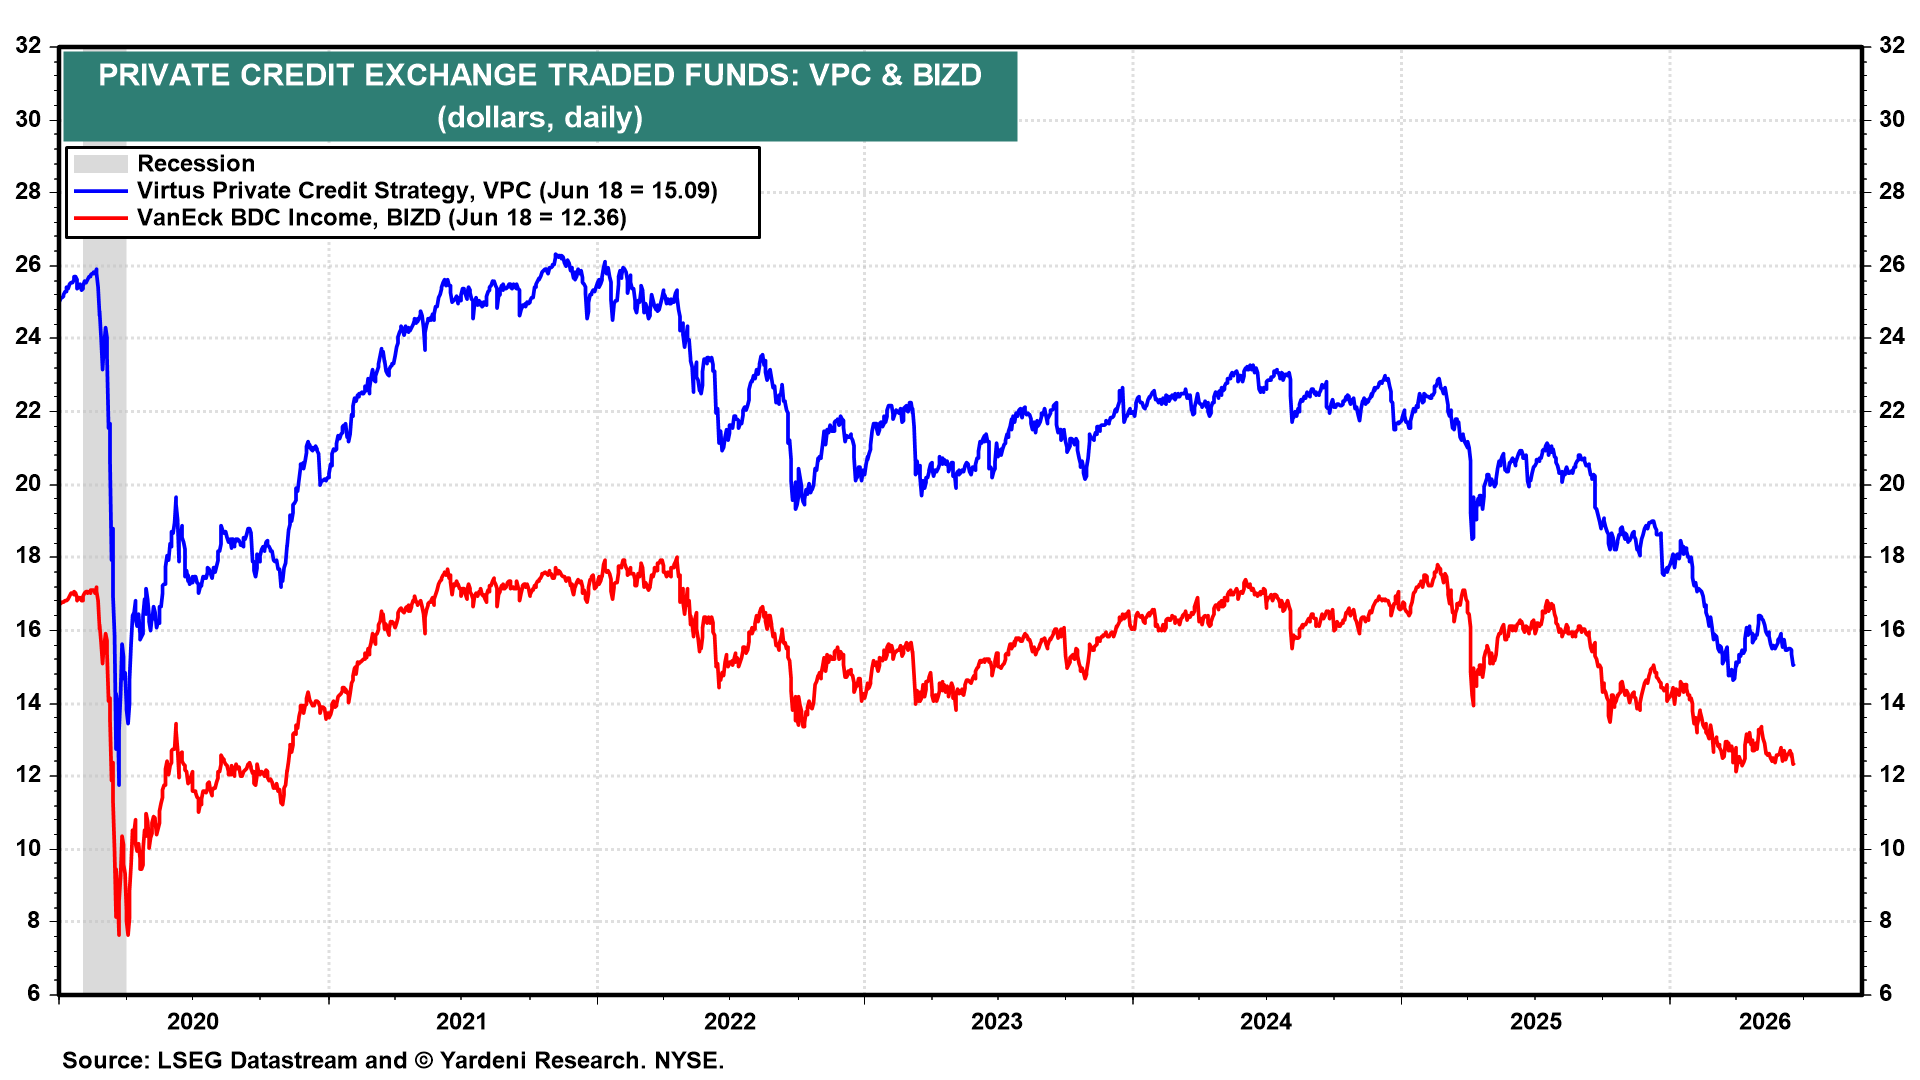
Private-credit ETFs have rolled over, with Virtus Private Credit (VPC) down 3.3% over the past month to $15.09 and VanEck BDC Income (BIZD) down 1.2% to $12.36 (chart).
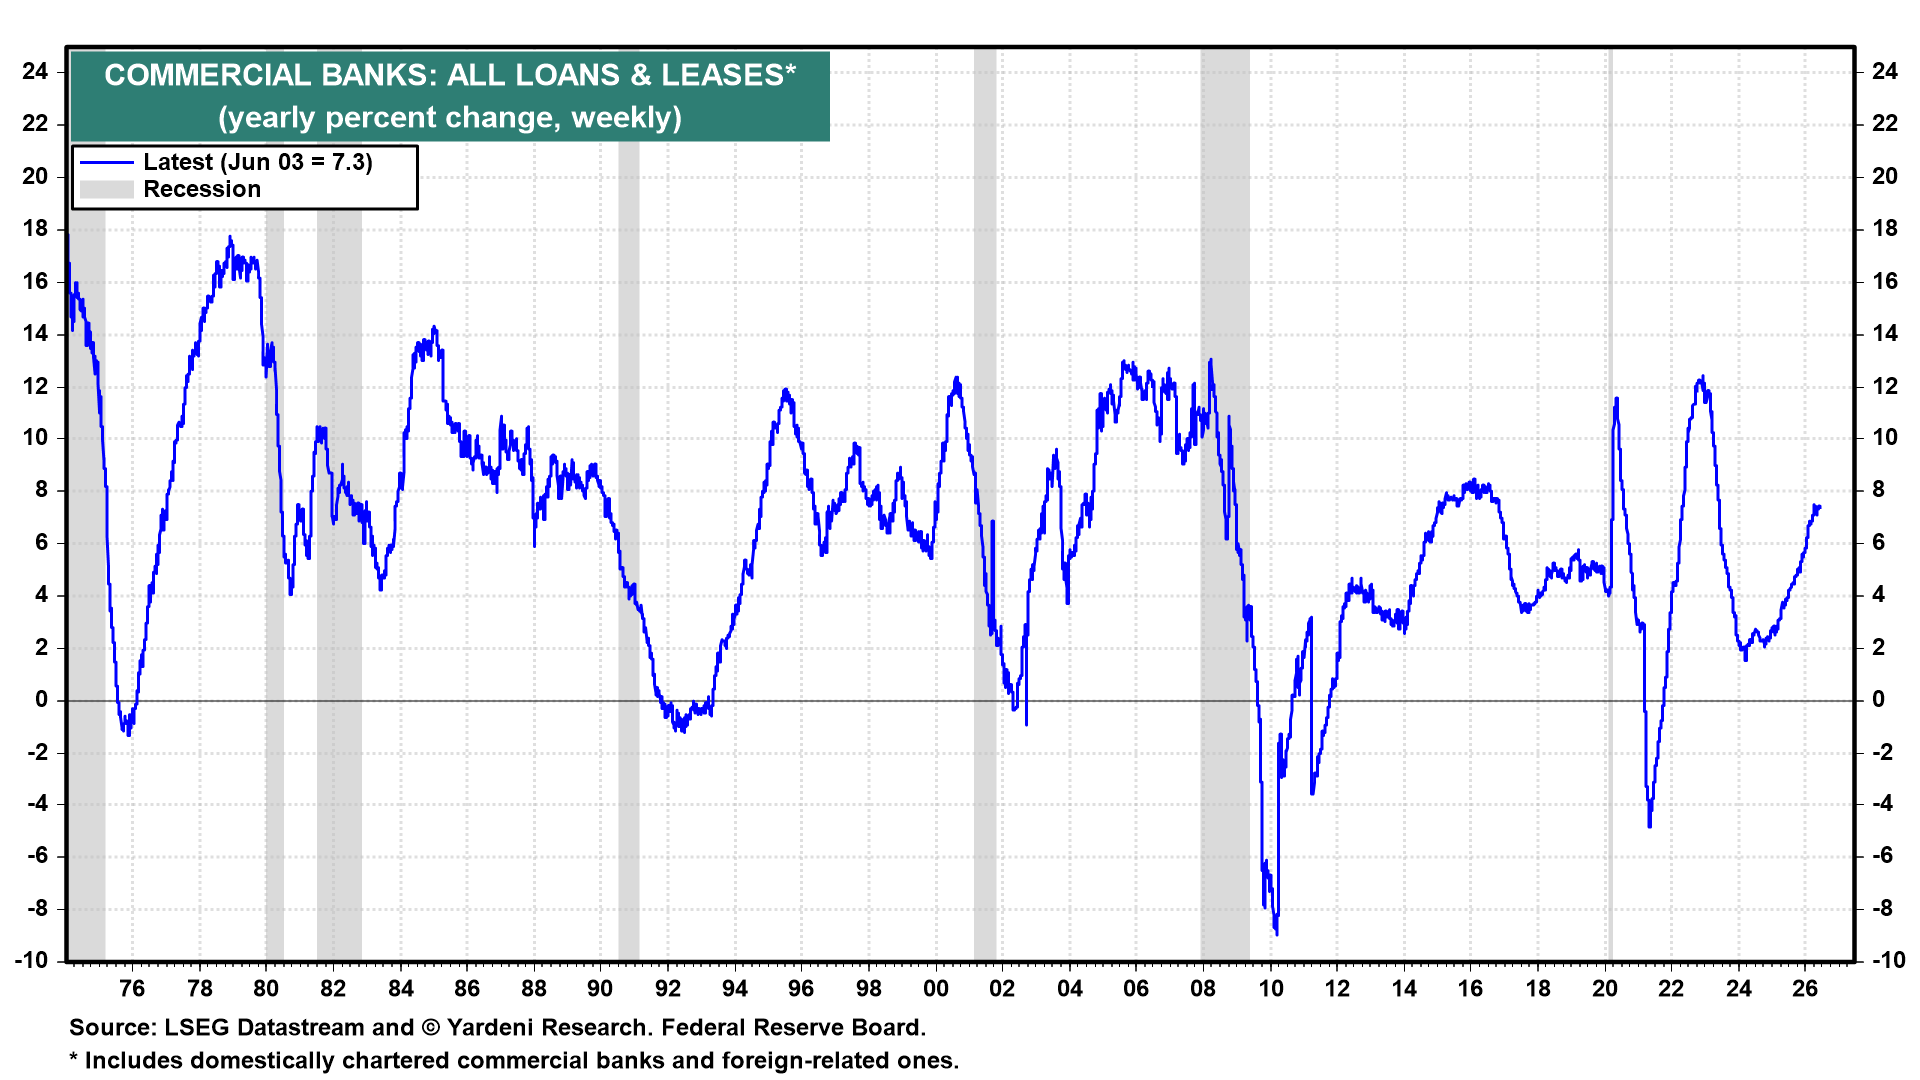
At the same time, commercial bank loans and leases are still growing 7.3% y/y, a pace consistent with a healthy expansion and well above the contractionary readings that have preceded past downturns (chart). There is no credit crunch underway, and banks are still financing the real economy.
We remain constructive on the bull market, with FEMO now broadening across the market-cap structure. We will continue to monitor the quality of earnings.