Stock prices continue to rise worldwide. A run of central bank meetings over the coming weeks will test whether equity composure holds. Bond yields are also rising worldwide. The question is whether that reflects better-than-expected economic growth, higher-than-expected inflation, and/or looming fiscal debt crises.
Equities are voting for growth. We are too. Here's more:
I. Global Stock Markets
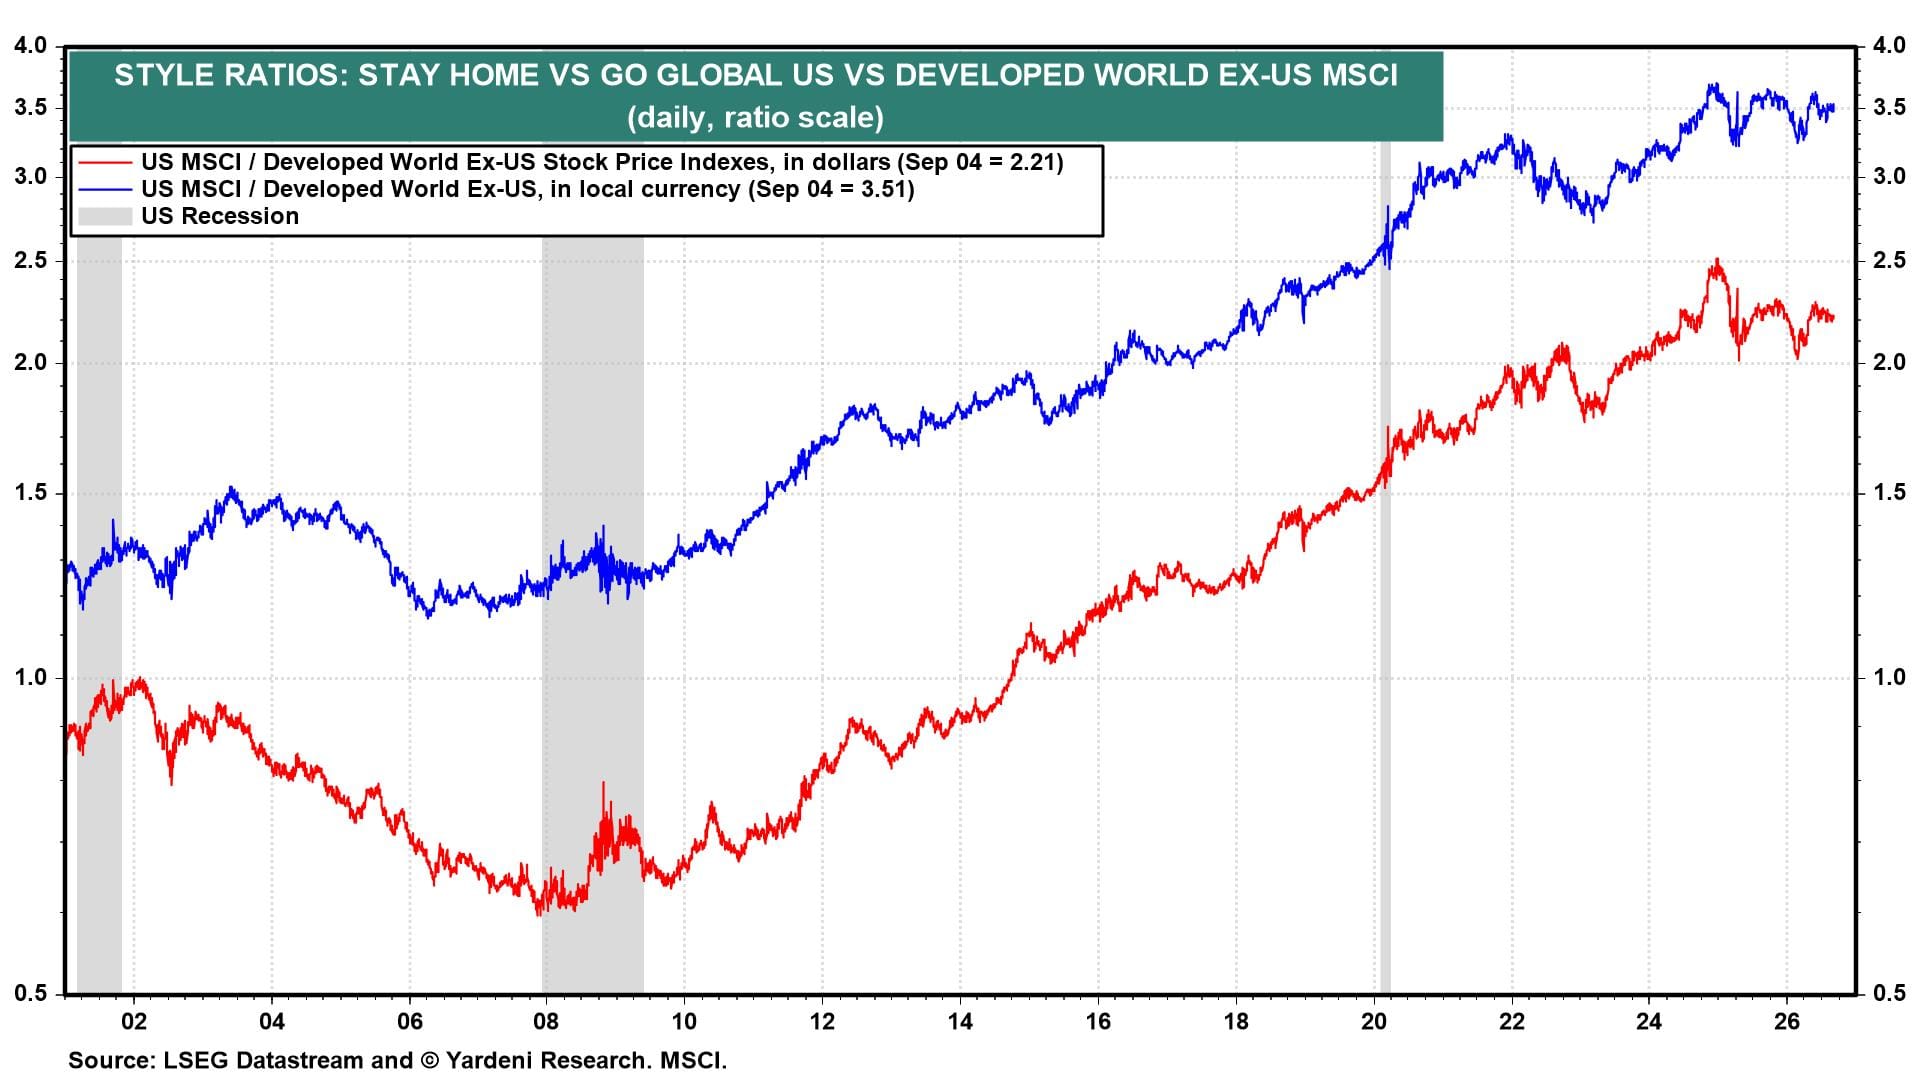
The US-to-Developed World ex-US MSCI ratios have gone flat since early 2025 after climbing for 15 years (chart). They've had matching gains.
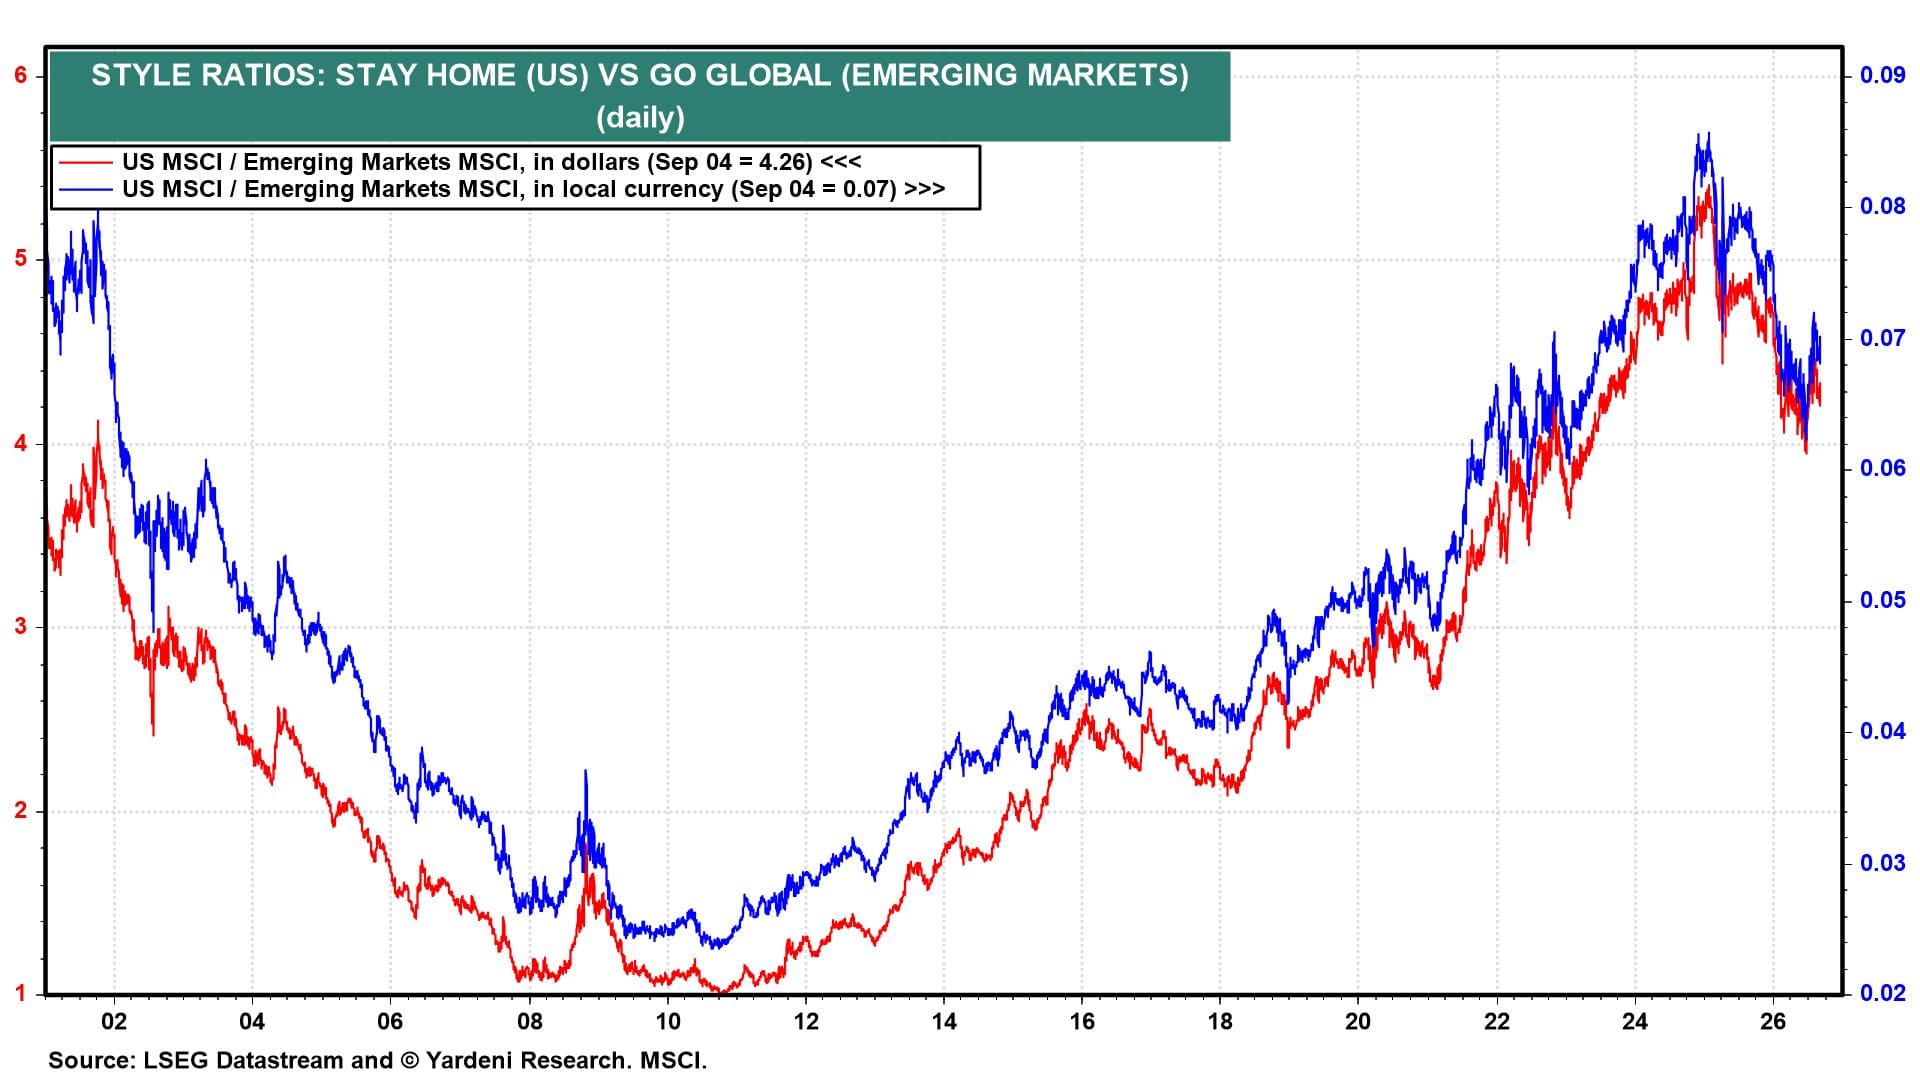
The US-to-EM MSCI ratios have turned up in recent weeks, though both remain well below their 2024 highs (chart). Emerging markets did the heavy lifting for Go Global through the first half of the year and gave some of it back in July. The turn suggests that gap is starting to close again.
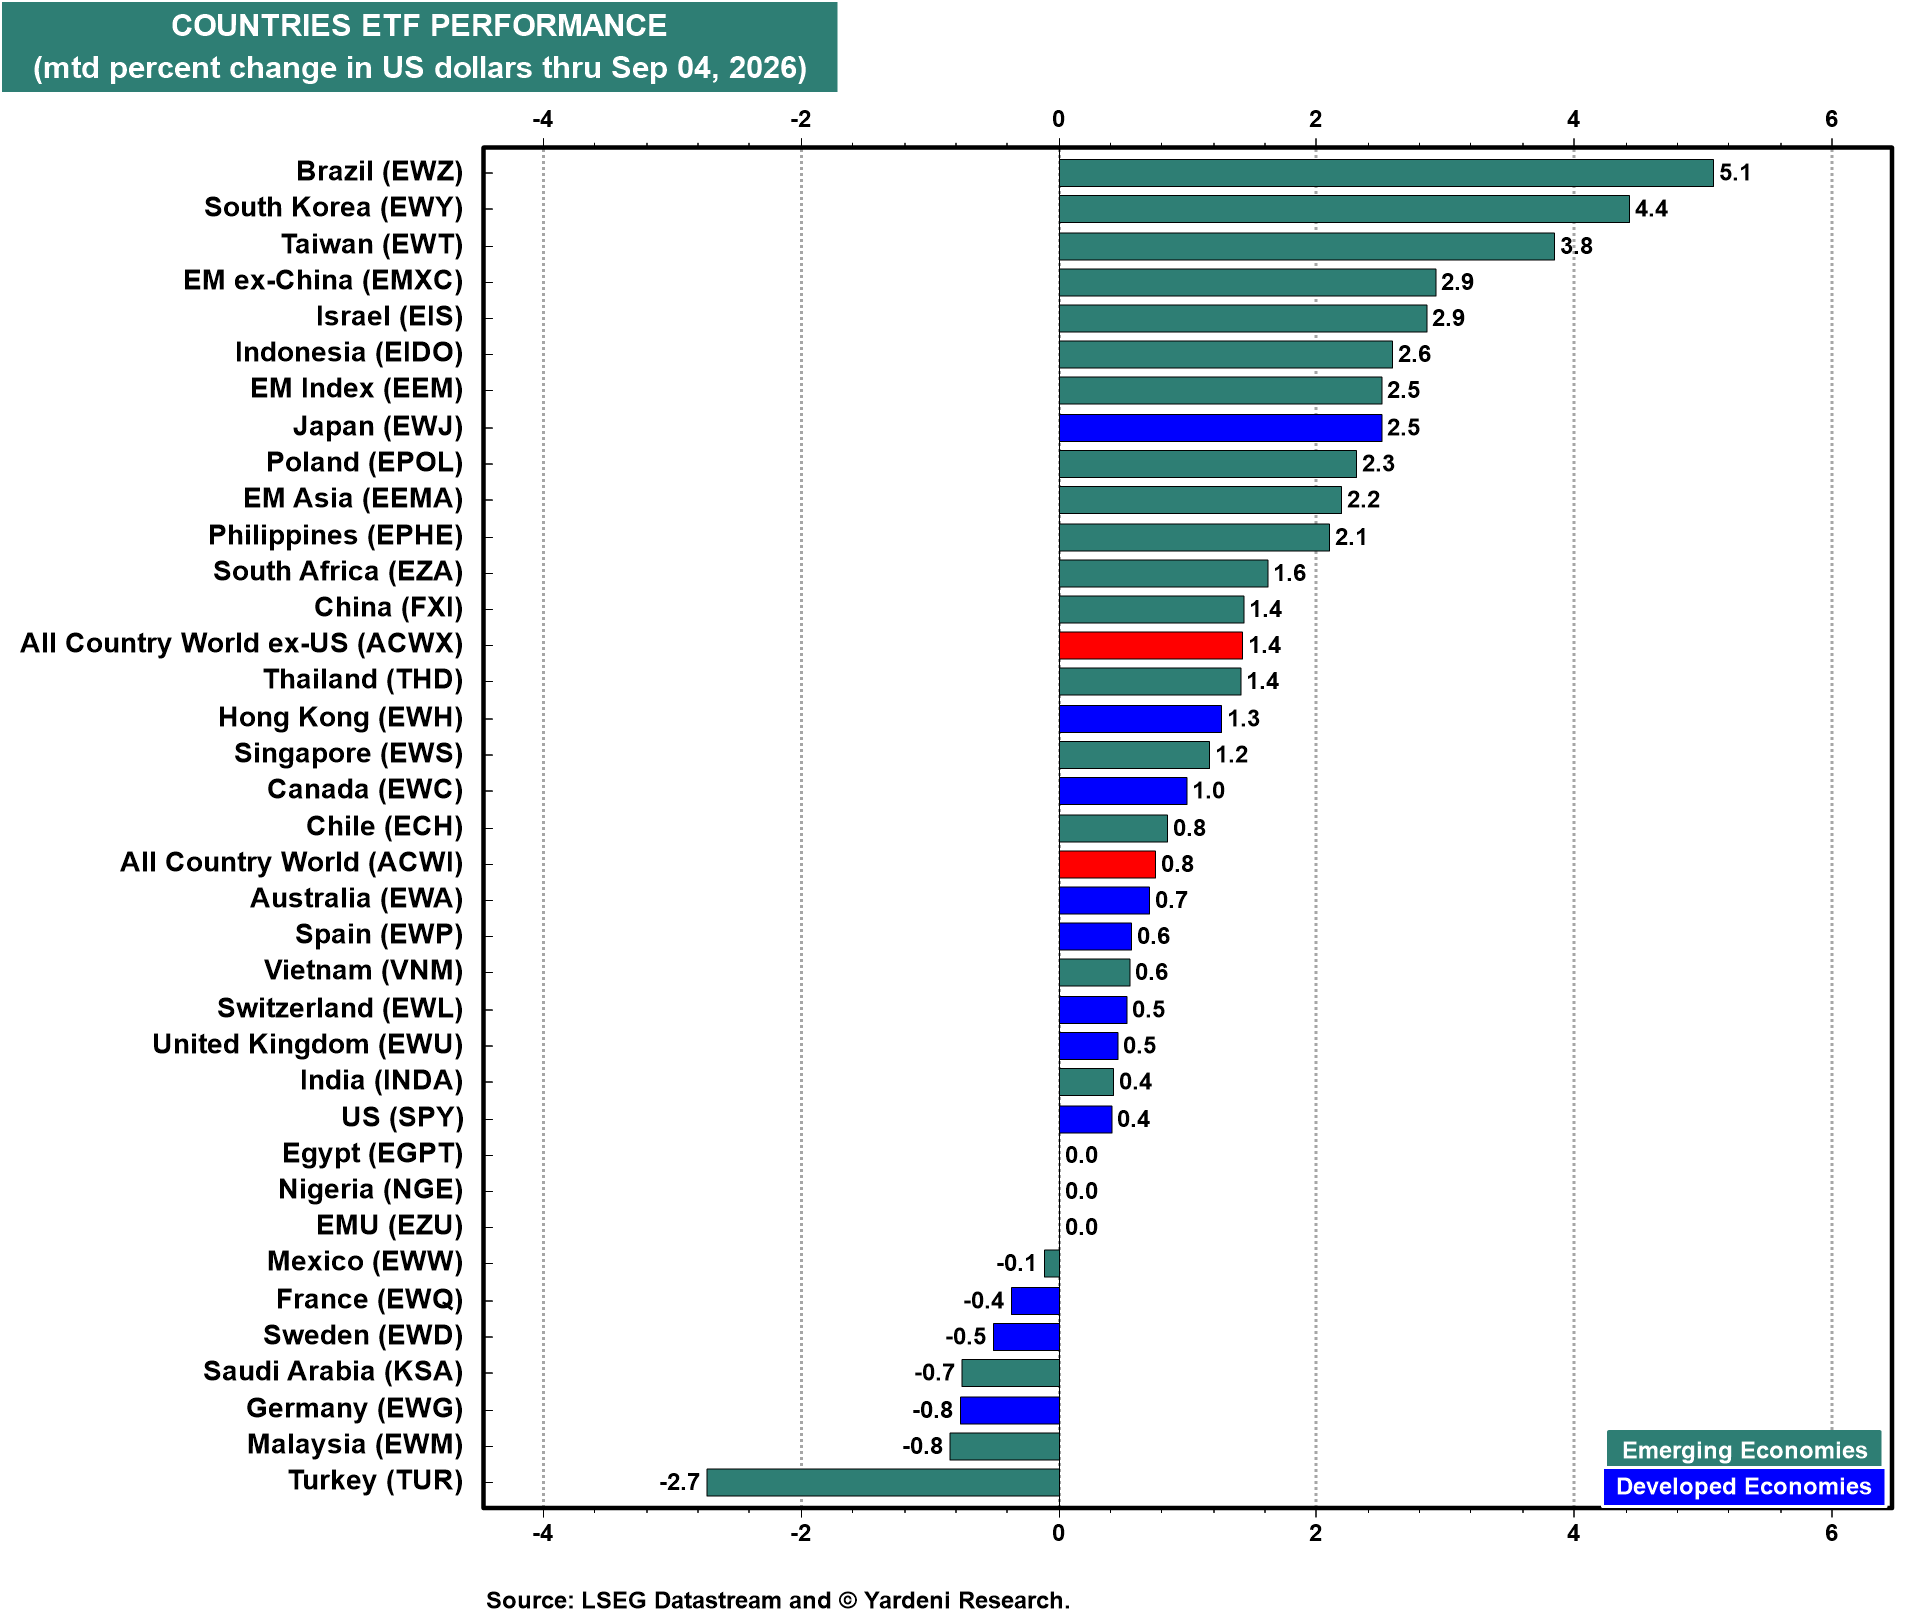
September has a ways to go. But so far, Brazil leads the country ETF rankings at 5.1% mtd in dollar terms, with South Korea at 4.4% and Taiwan at 3.8% (chart). The US is towards the bottom at 0.4%. Last week was a good one for Go Global.
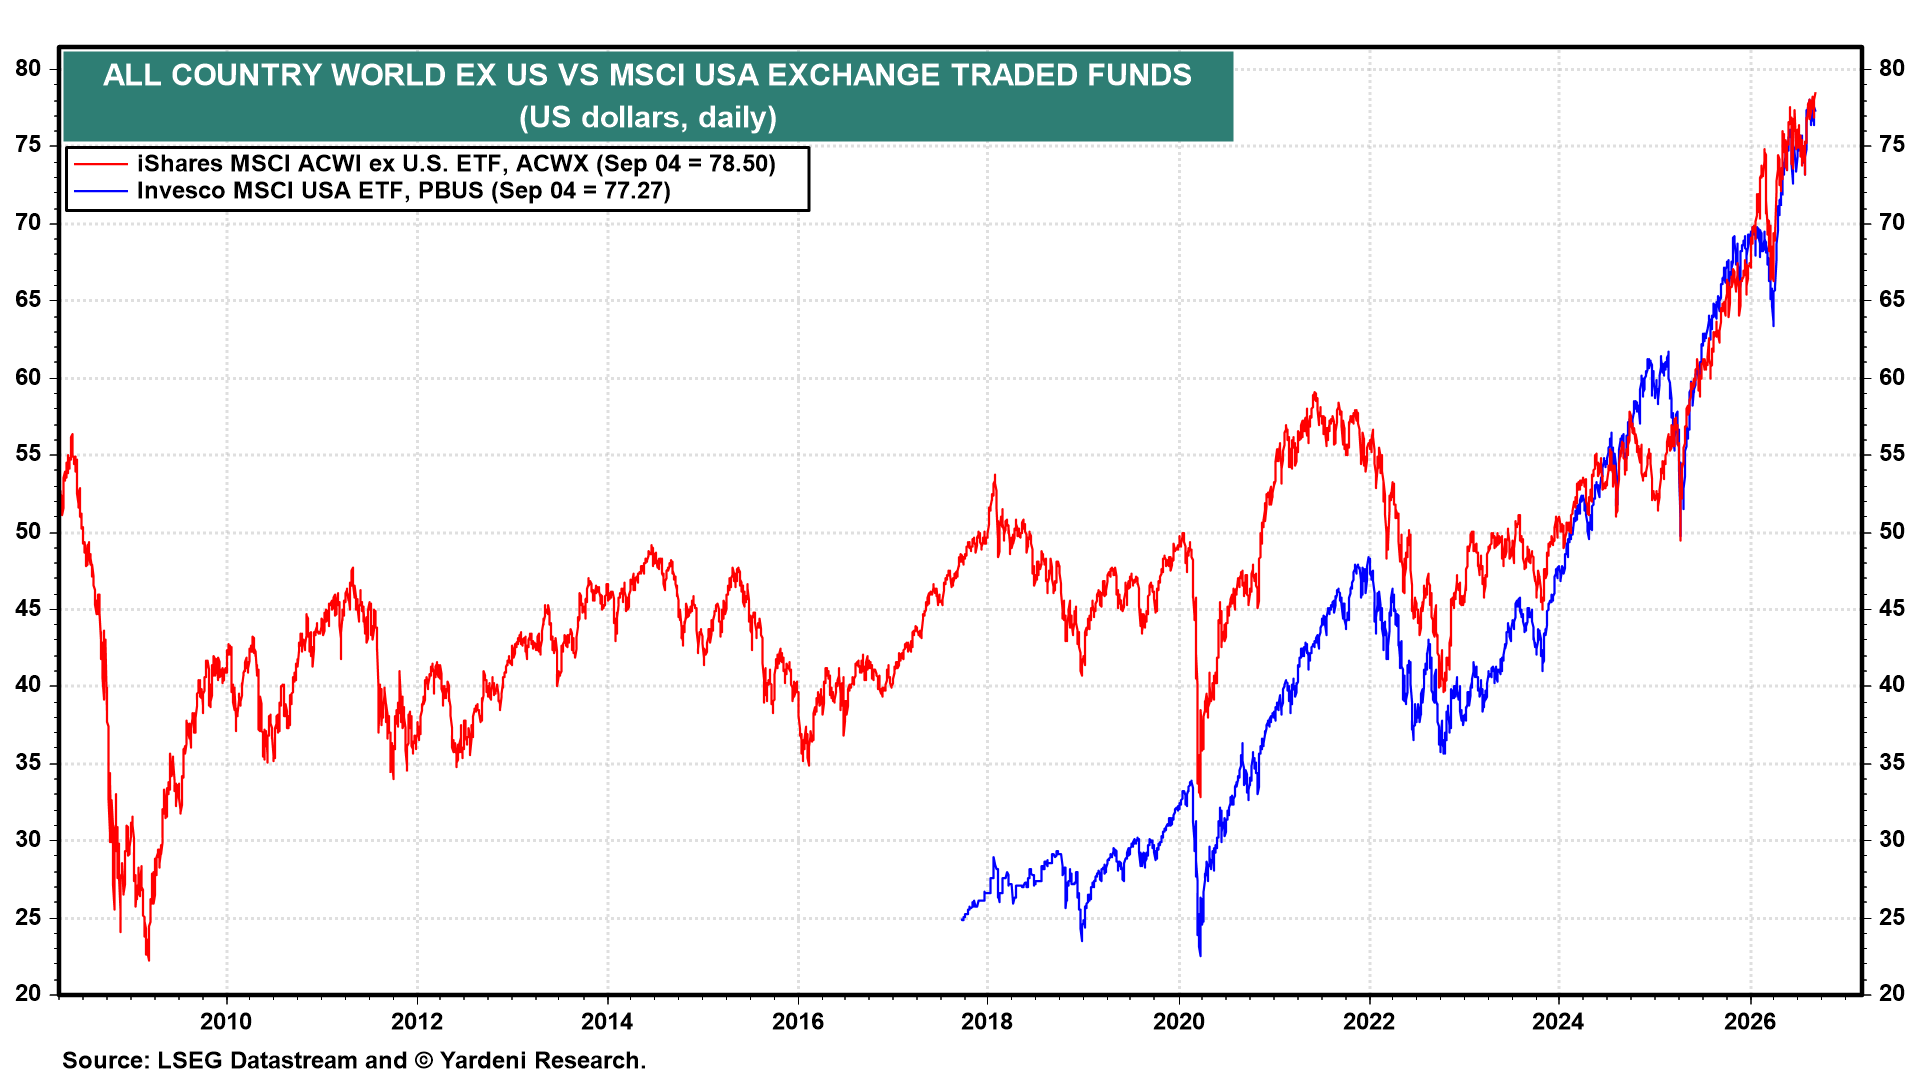
The ACWX ETF and PBUS have tracked one another closely since Liberation Day last year (chart). A global bull market running that evenly across US and overseas equities for well over a year is remarkable.
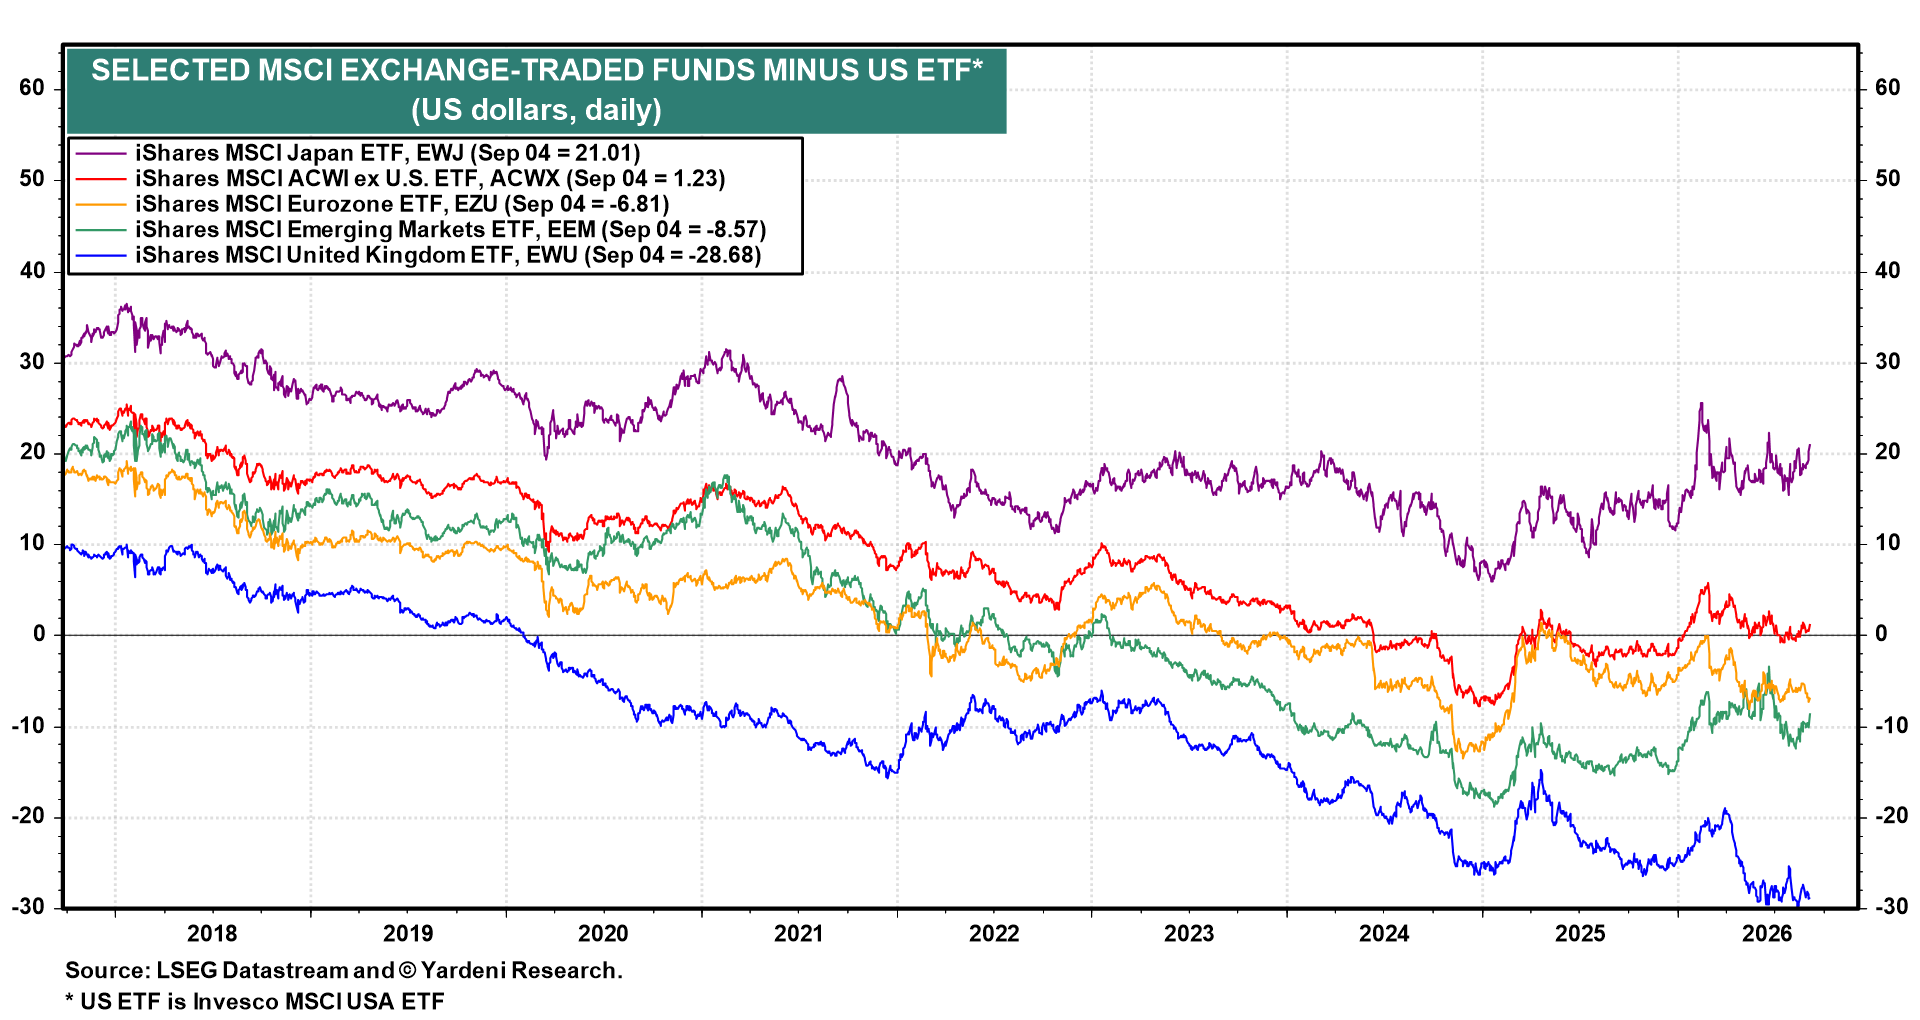
The spreads between the major overseas equity ETFs and the US ETF have been mixed since early 2025, when Go Global started outperforming (or at least keeping up) with Stay Home. Japan and EMs have outperformed the US. The Eurozone has fizzled. The UK continues to lag (chart).
II. Earnings & Valuation
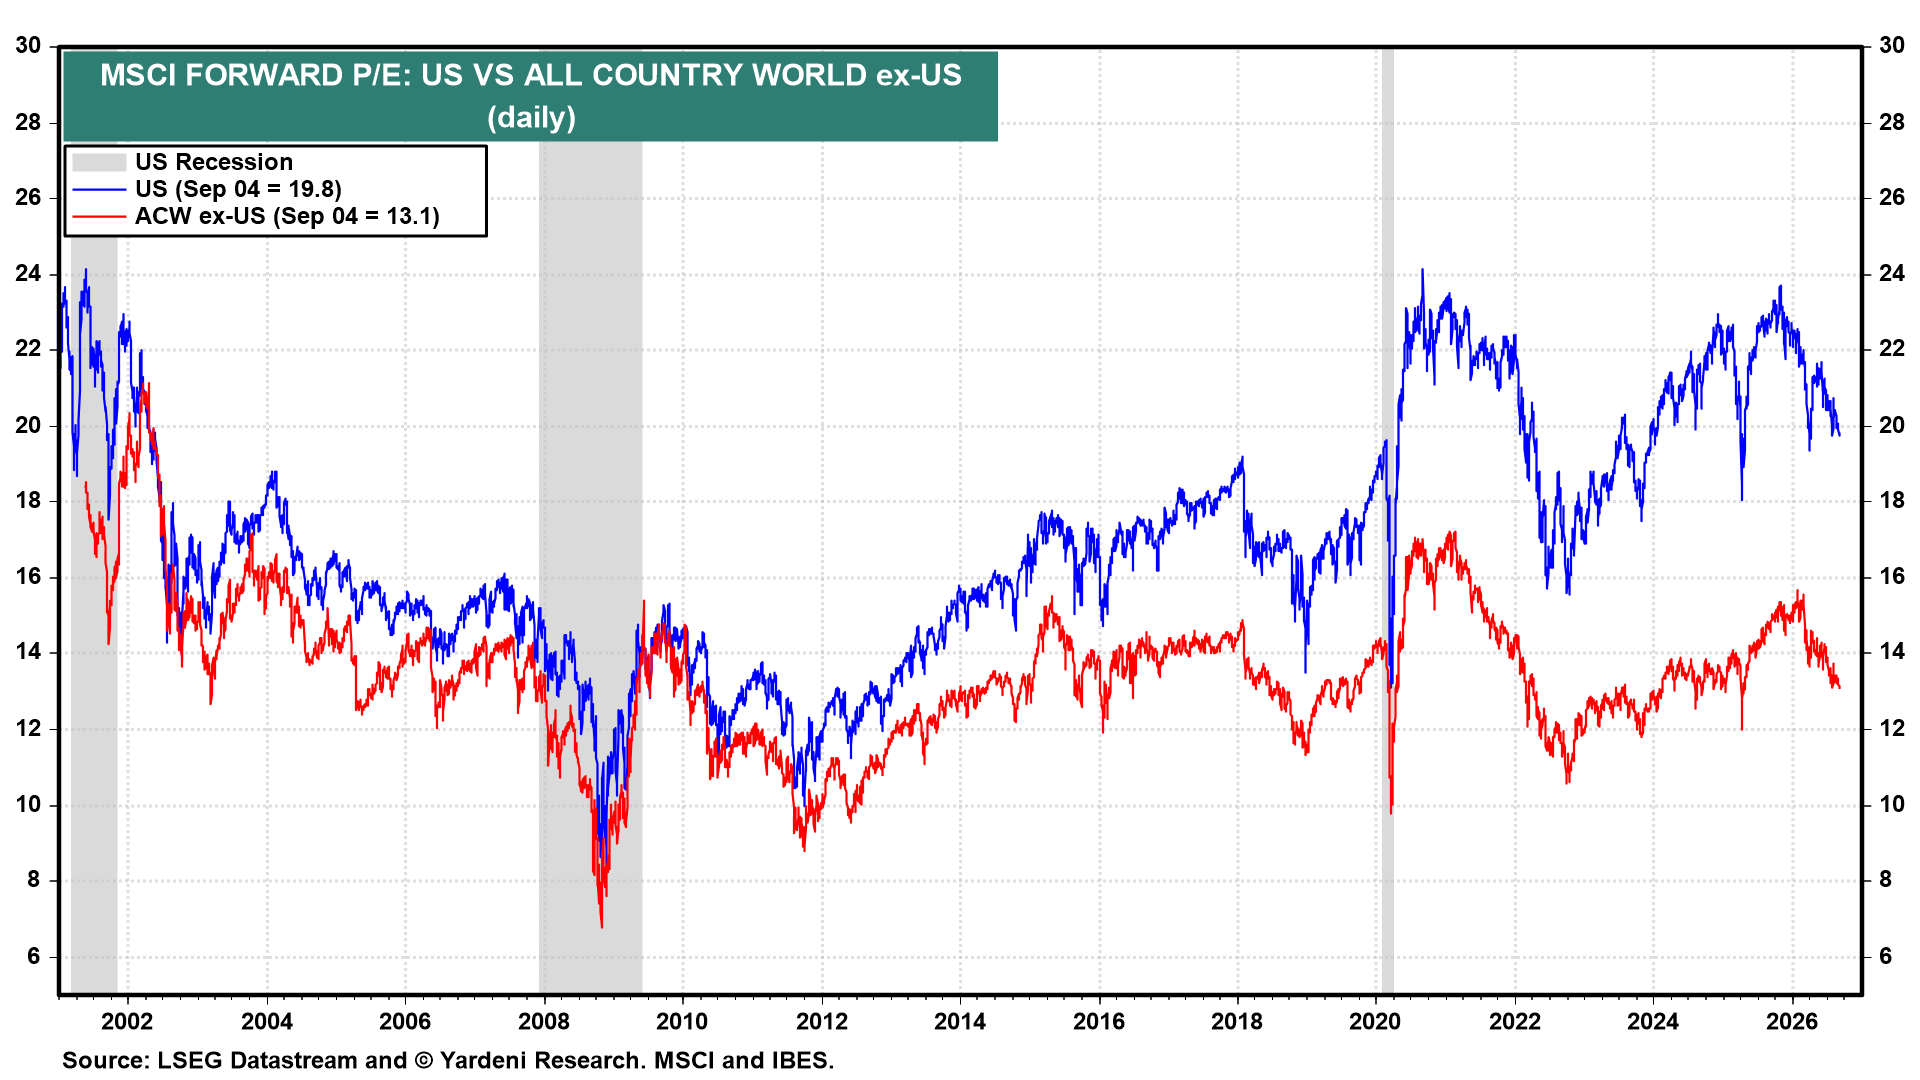
The US MSCI trades at a 19.8 forward P/E against 13.1 for the All Country World ex-US (chart). Both have fallen this year, as earnings gains outpaced stock price increases.
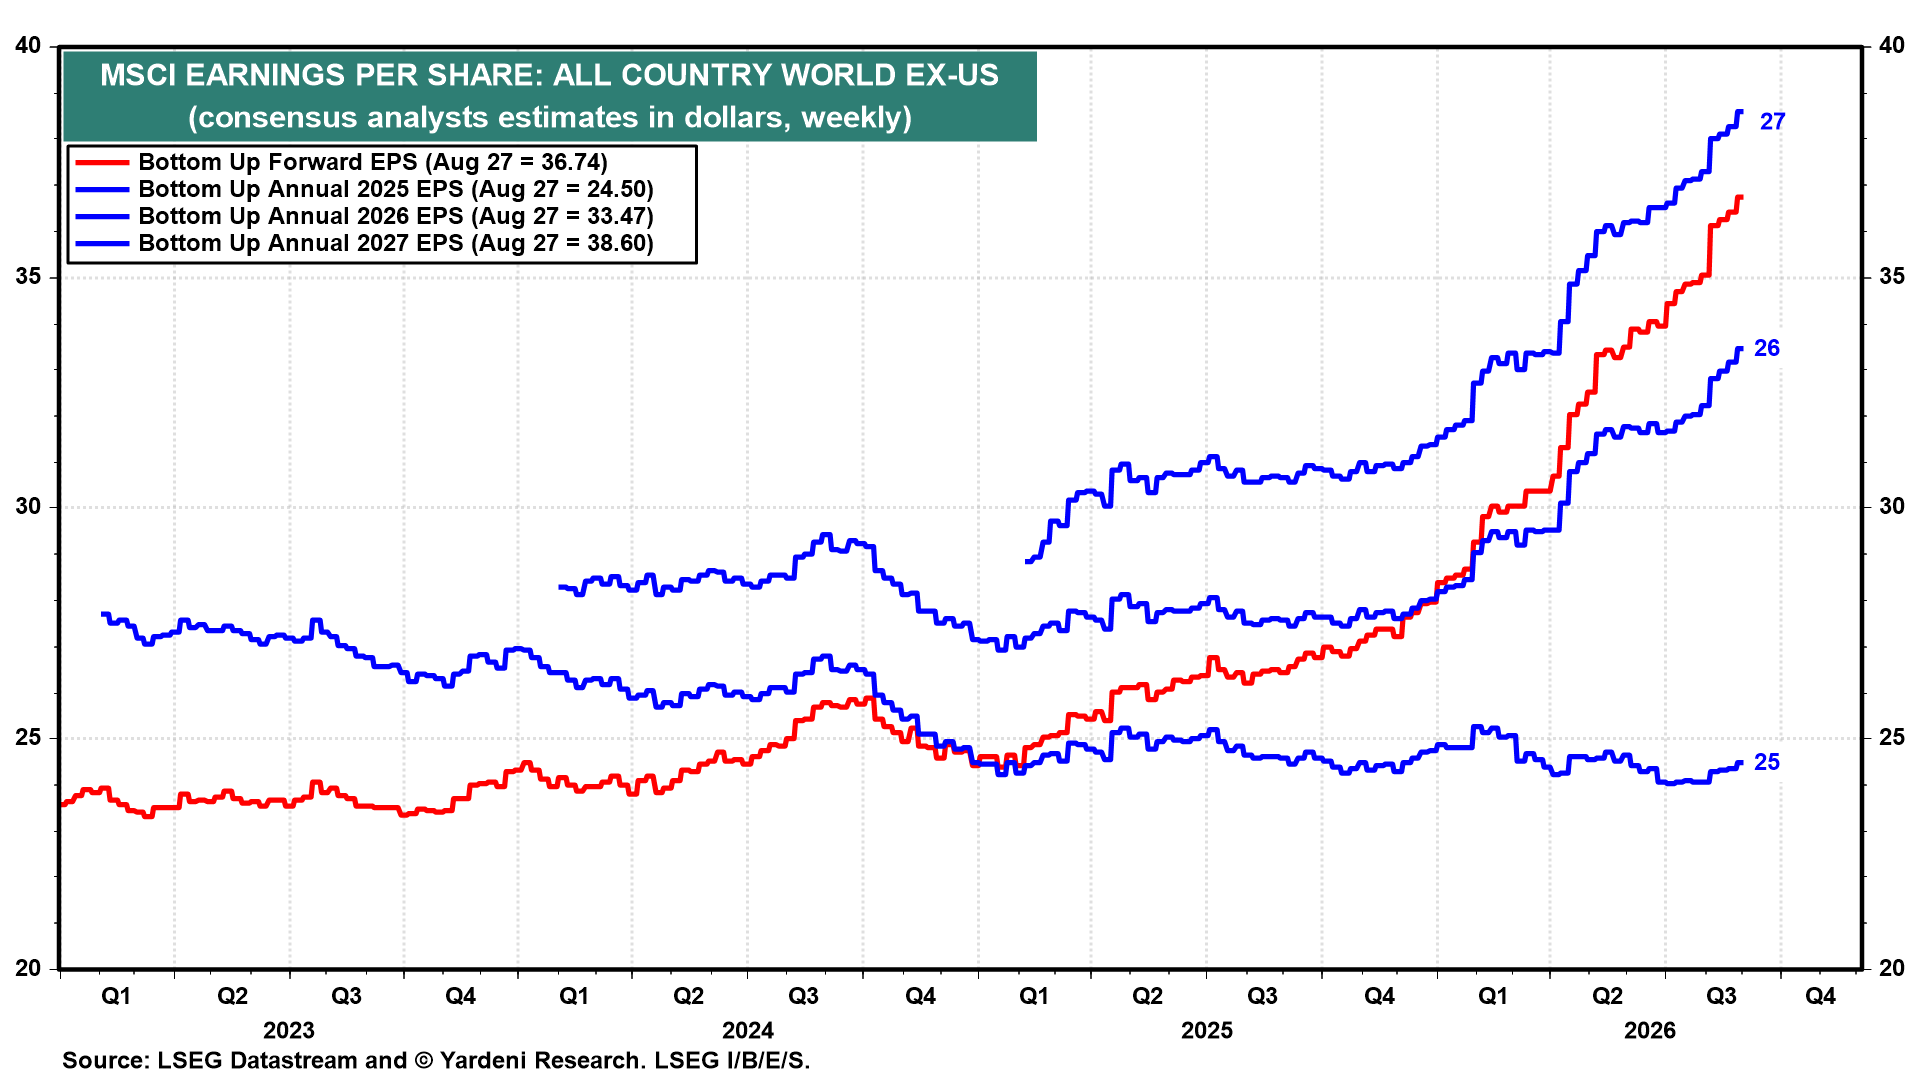
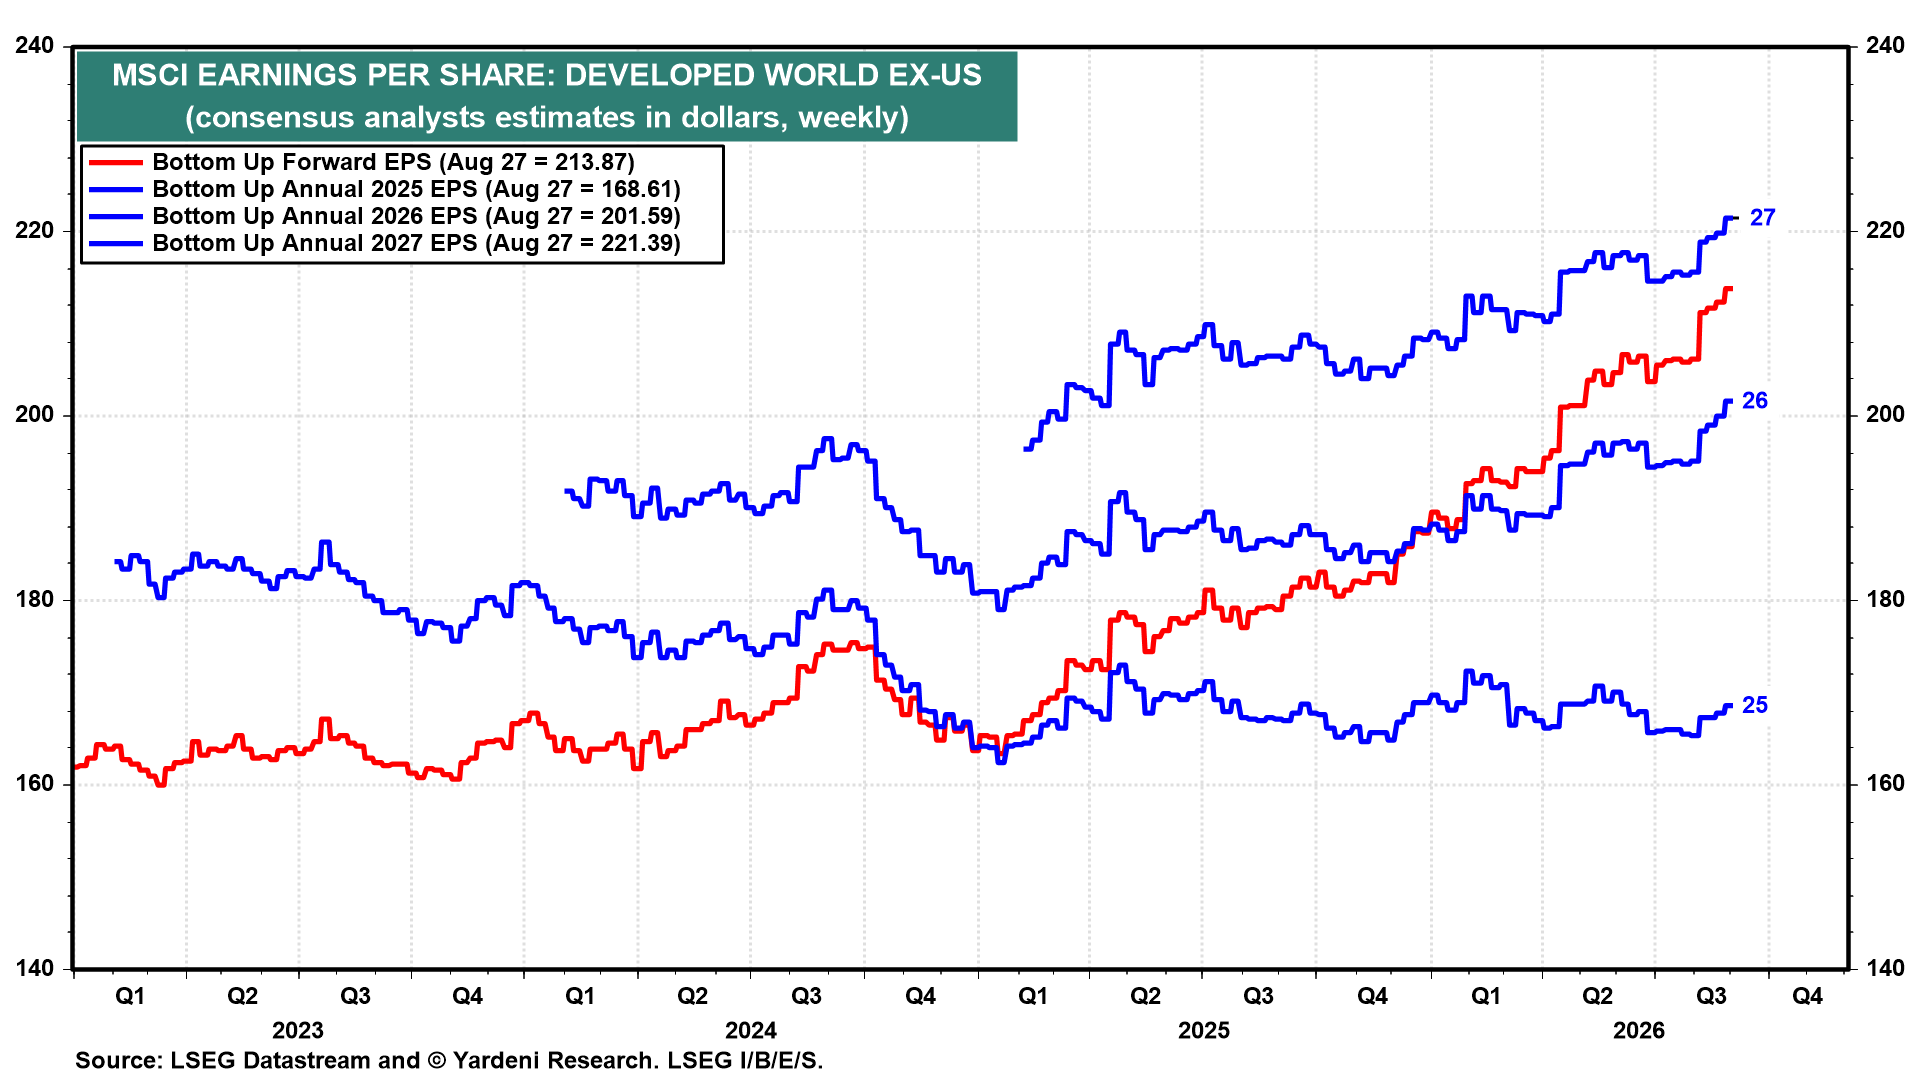
All Country World ex-US forward EPS keeps climbing, with the consensus stepping up from 2025 to 2026 to 2027 (chart). The stair-step from 2026 to 2027 is steep, and the forward series continues to climb to record highs.
The Developed World ex-US series shows the same pattern (chart).
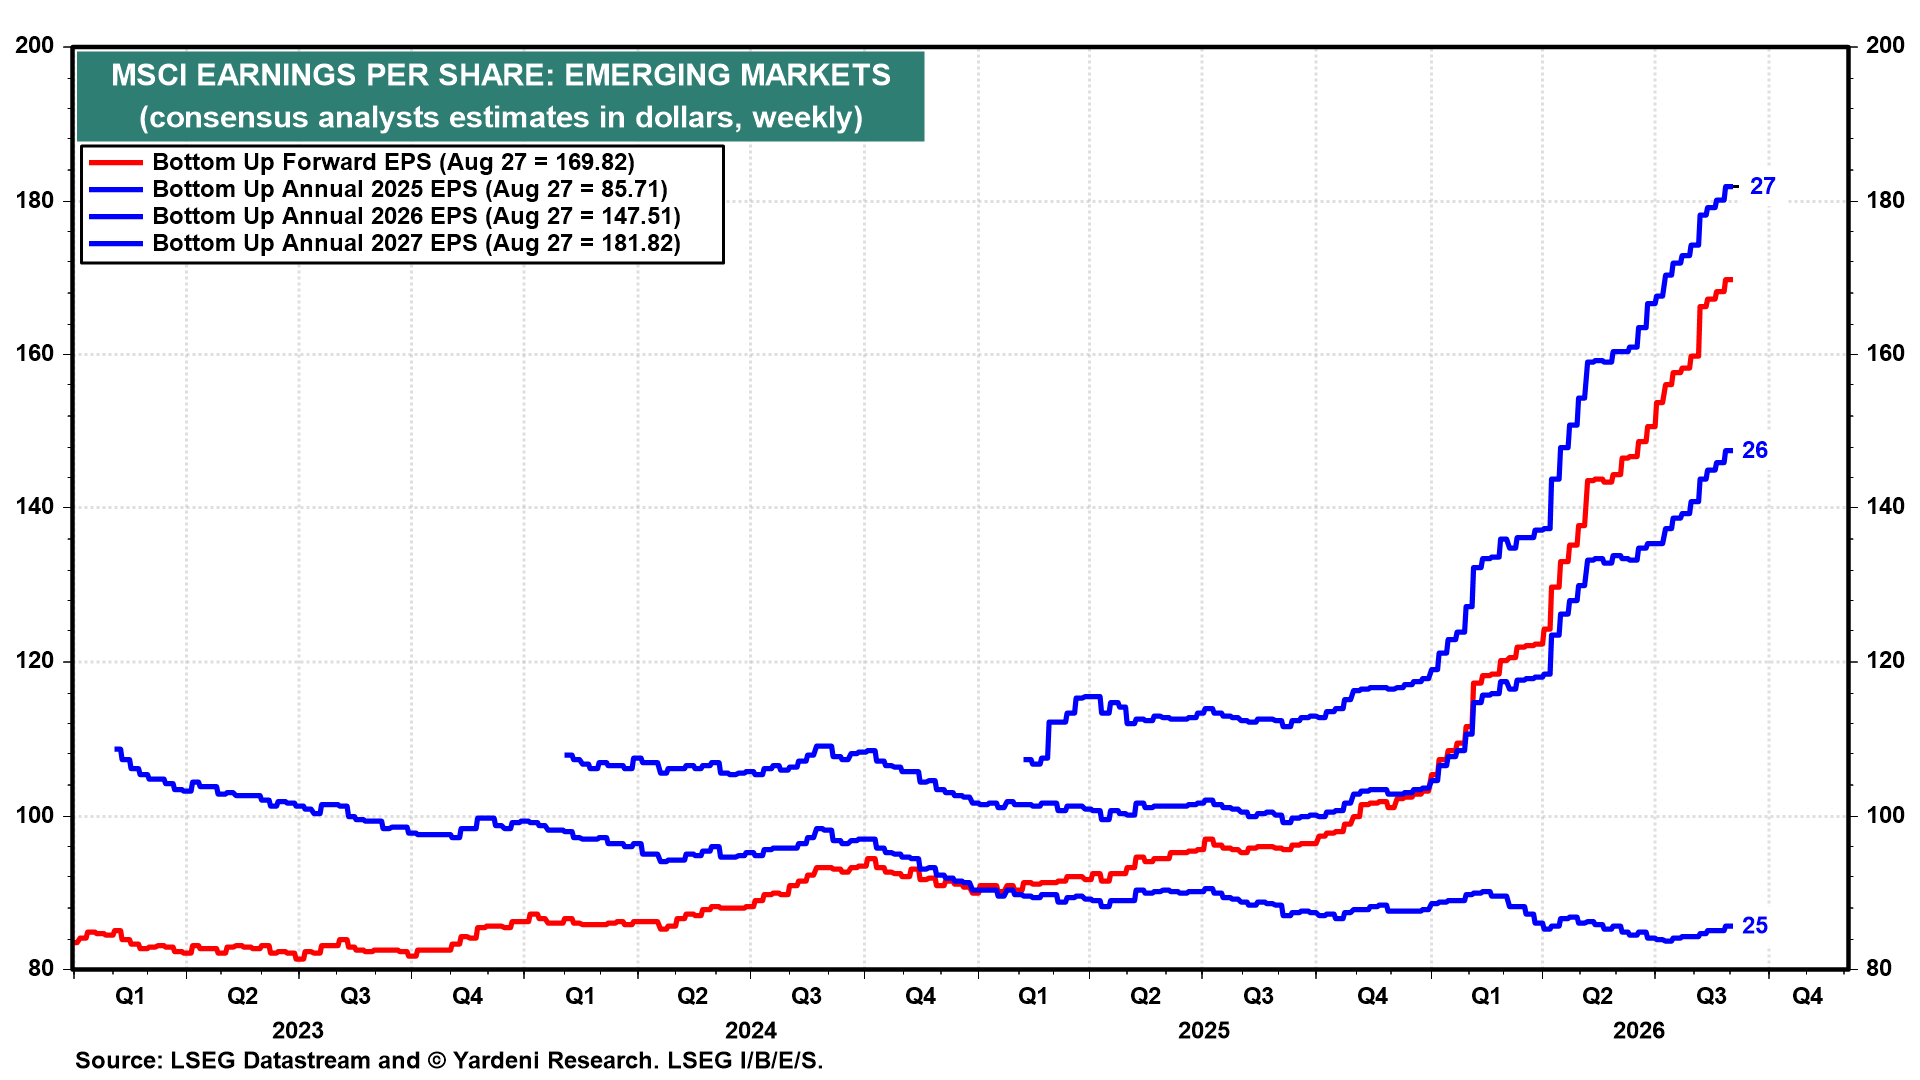
Emerging markets are the steepest of the three (chart). South Korea and Taiwan account for most of the strength. Korea's 2026 consensus earnings growth estimate has risen to 333.9% and Taiwan's to 56.9%.
III. Global Bonds
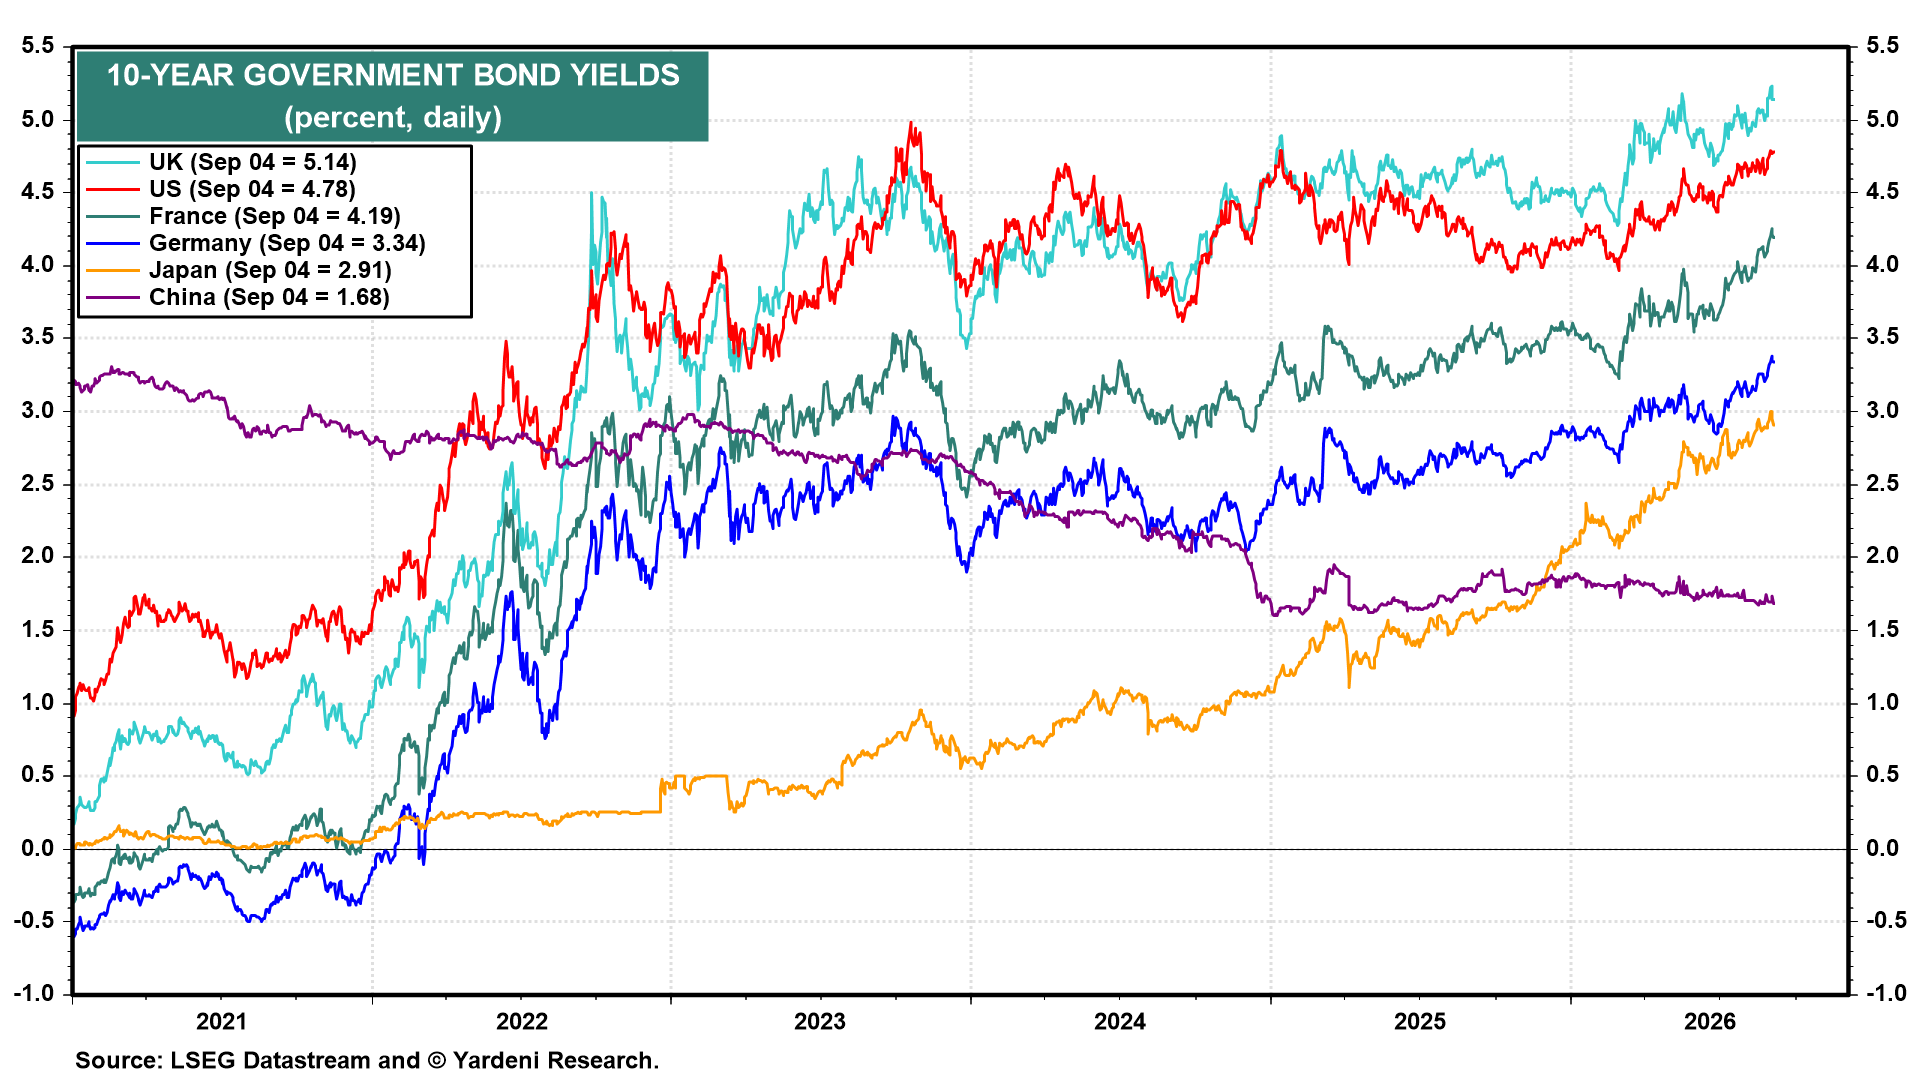
Yields are rising nearly everywhere. The UK’s 10-year government bond is at a 5.14% yield, the US’s at 4.78%, France’s at 4.19%, Germany’s at 3.34%, and Japan’s at 2.91% (chart). China is the exception, with its 10-year government bond yield at just 1.68% and continuing to decline.
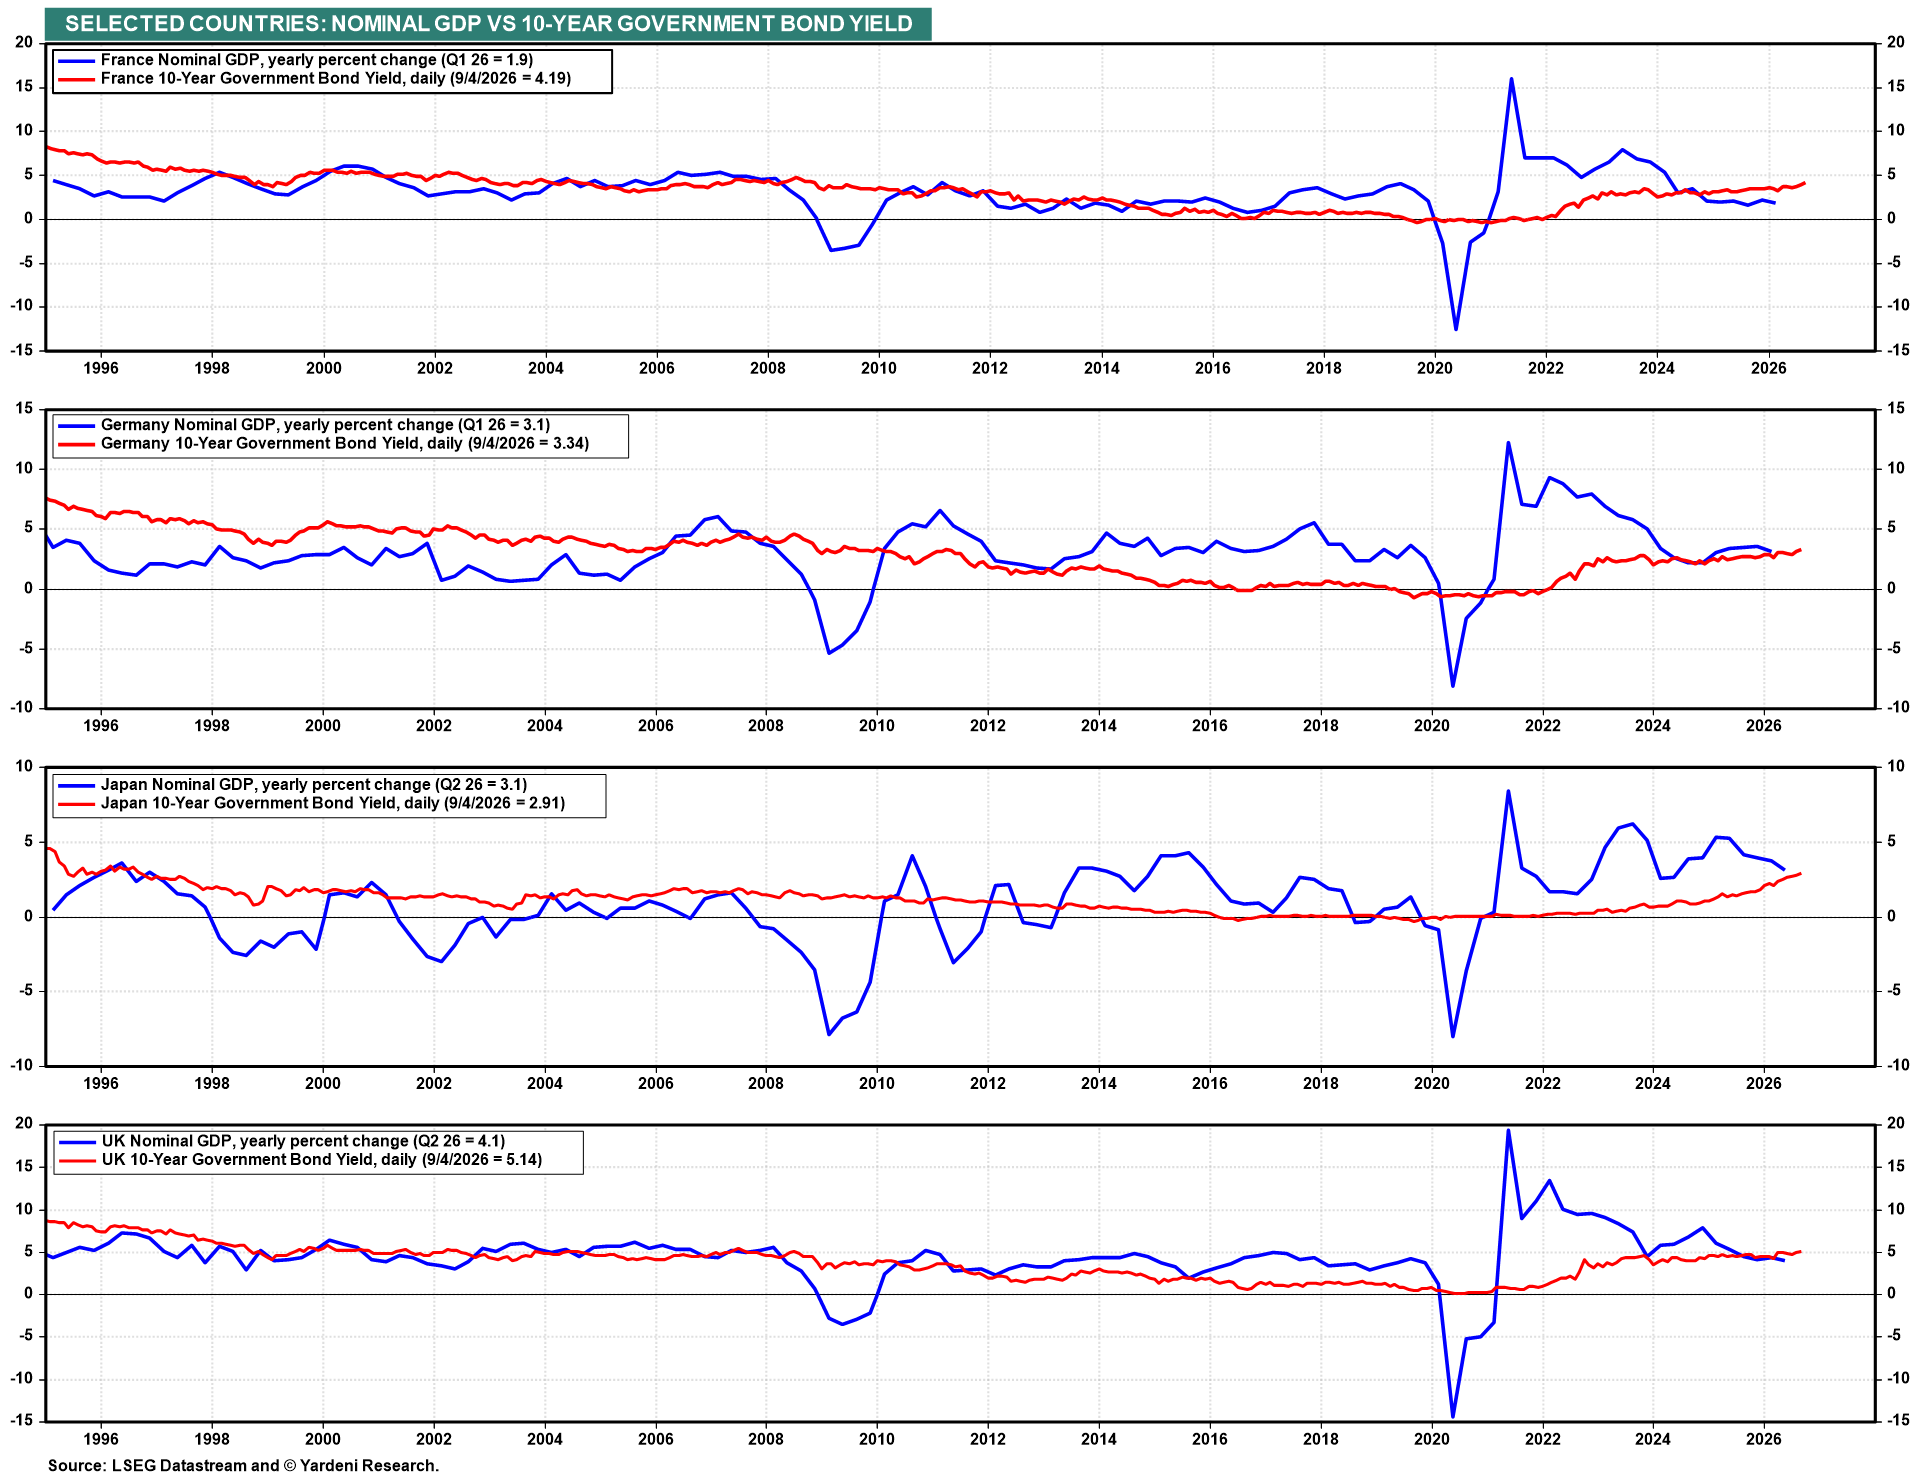
For years after the Great Financial Crisis of 2008, government bond yields ran far below nominal GDP growth; that era is over. Yields have converged with nominal GDP growth across the major economies, and they now exceed it in France and the UK (chart).
IV. Currencies
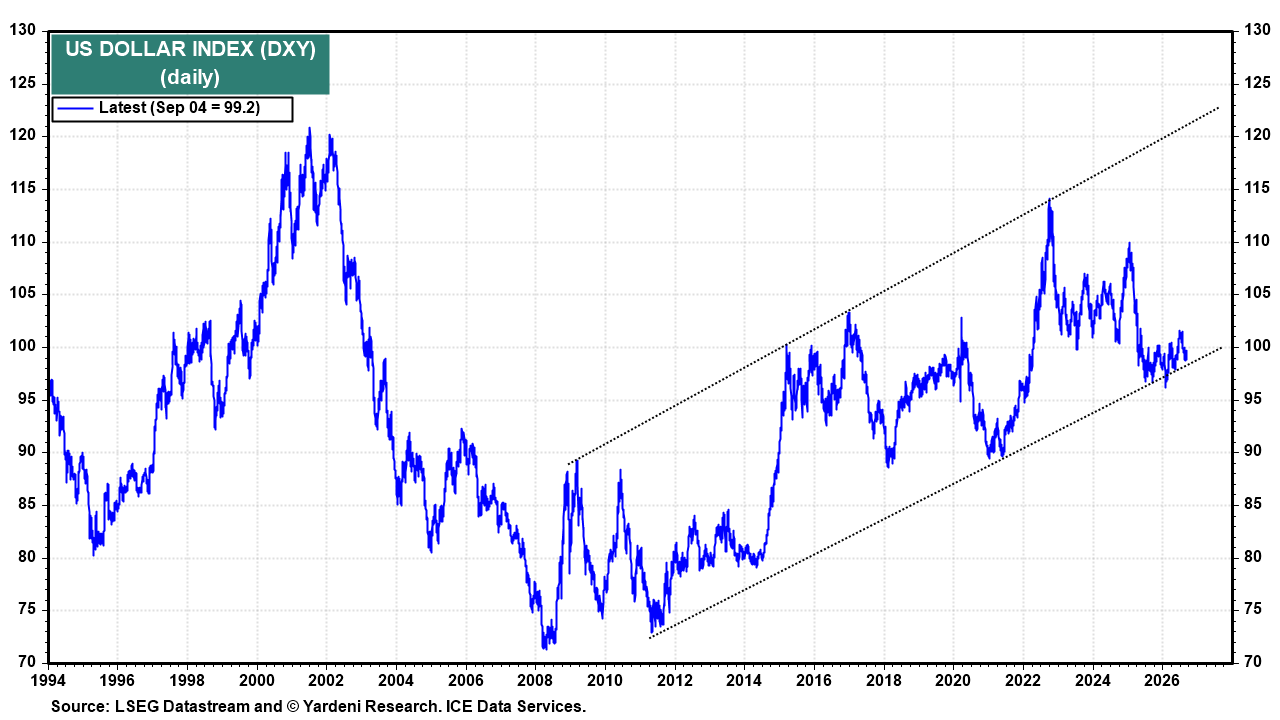
The dollar is holding up well. The DXY is at 99.2 and remains inside the uptrend channel that has contained it since 2011 (chart). The de-dollarization argument comes back every time the dollar softens. It has yet to show up in DXY.
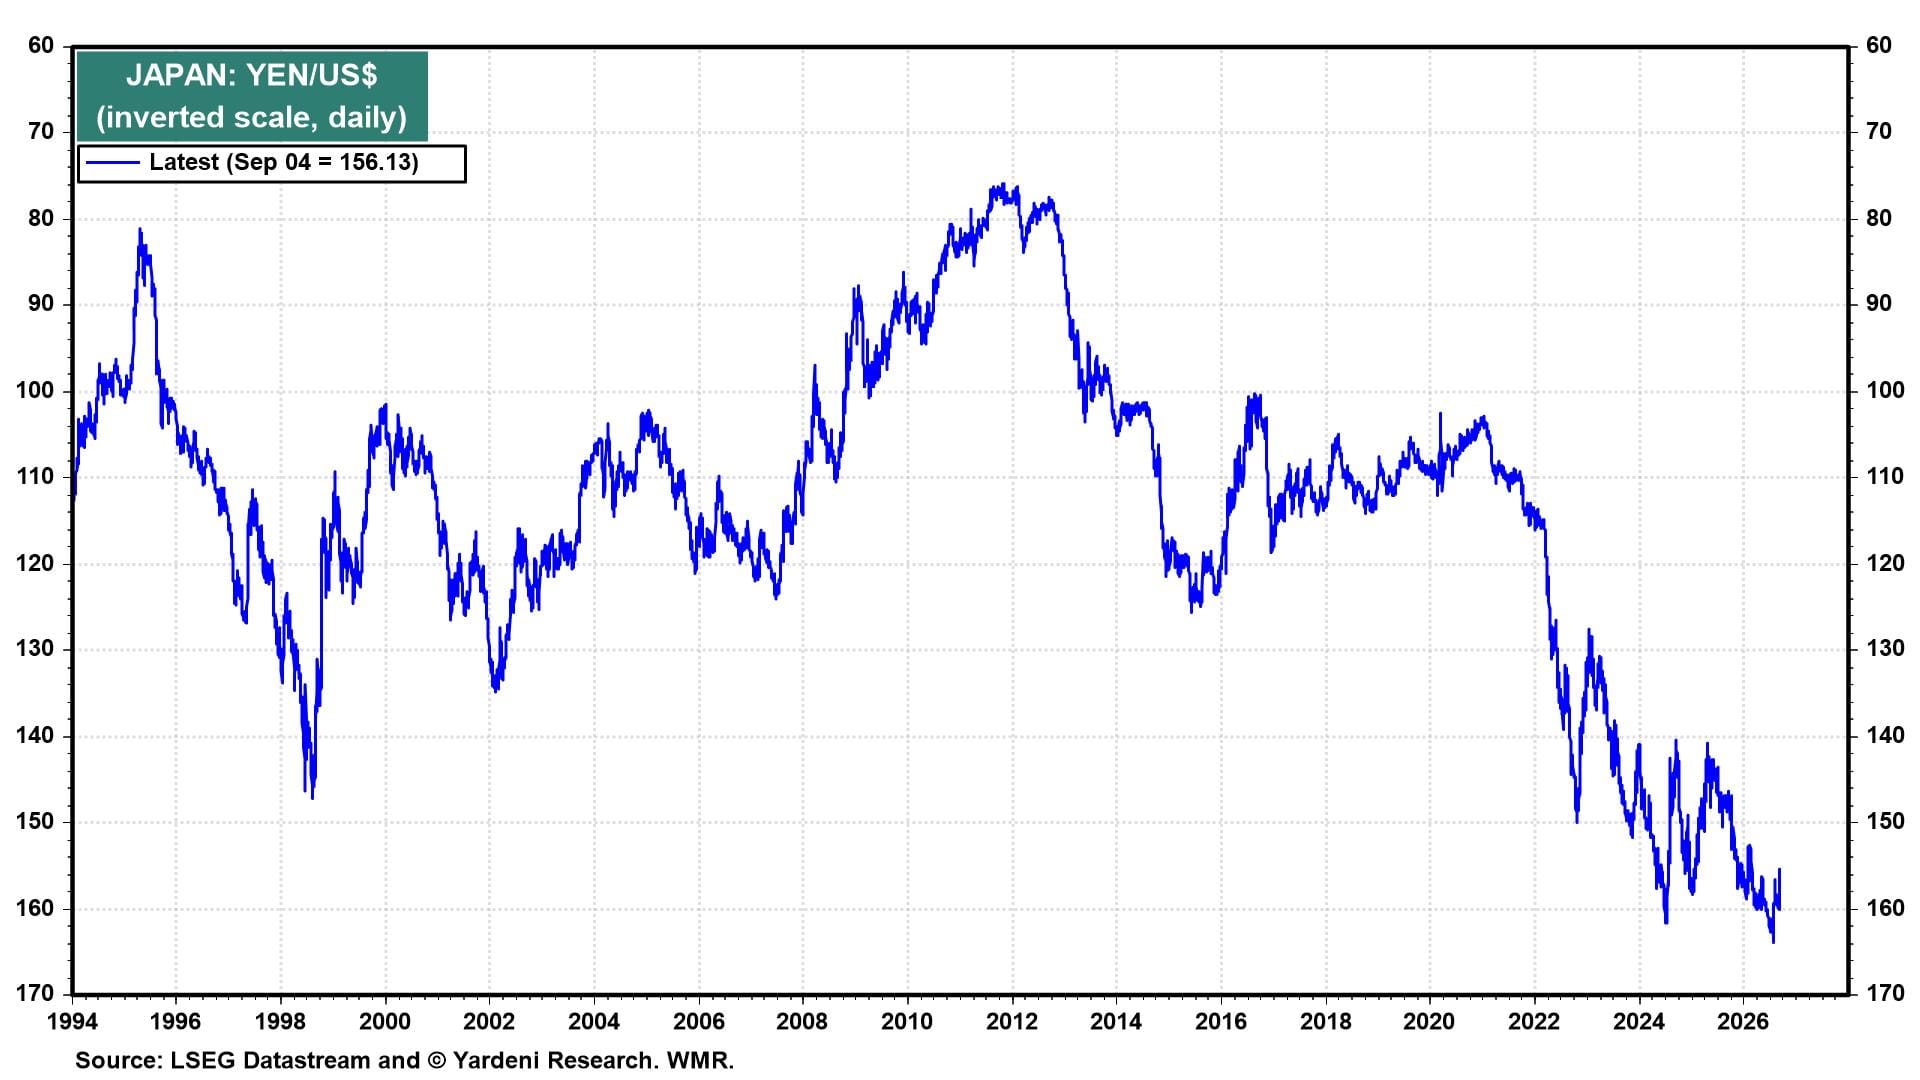
The yen strengthened materially over the past week as traders repriced not only the timing of Japanese tightening but its pace (chart).
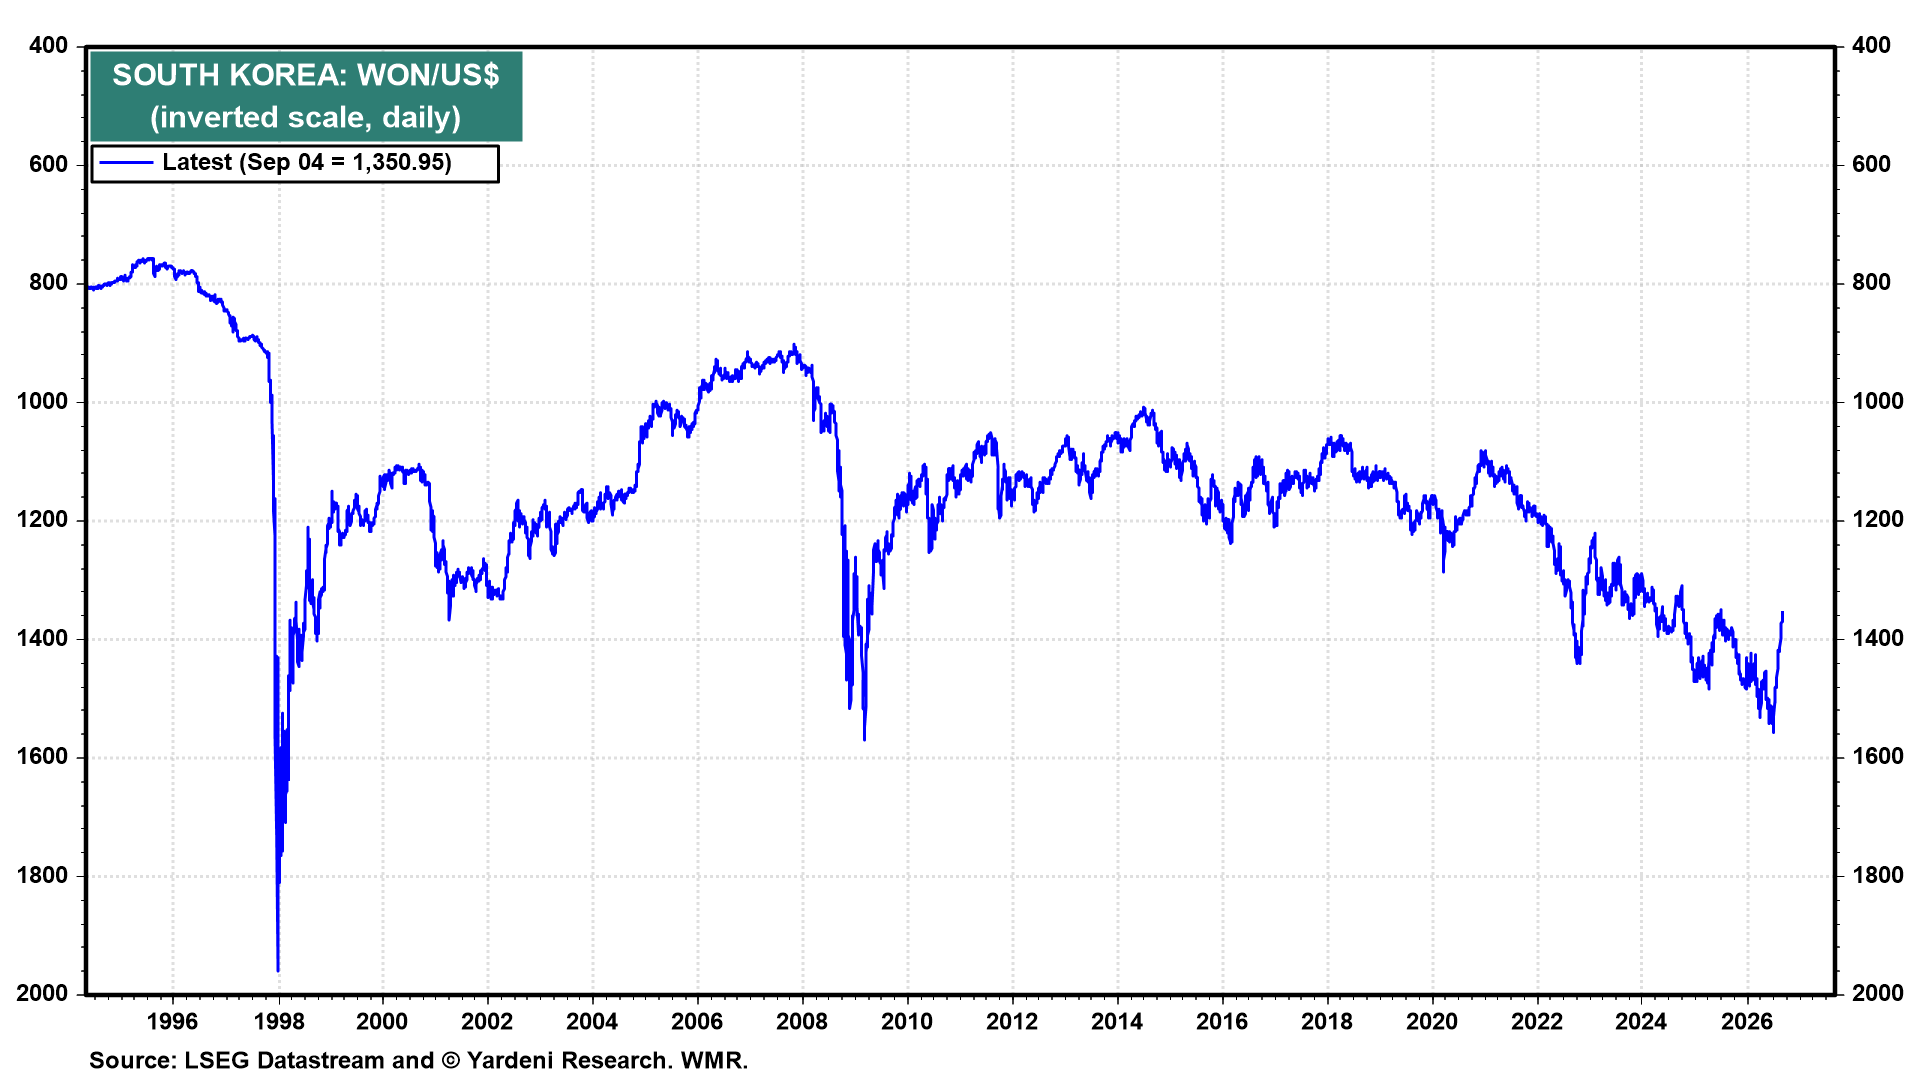
The won is at its strongest in more than a year (chart). Korean exporters have been converting dollar receipts into won against a large trade surplus, with proceeds from a major US listing adding to the inflow.
V. Commodities
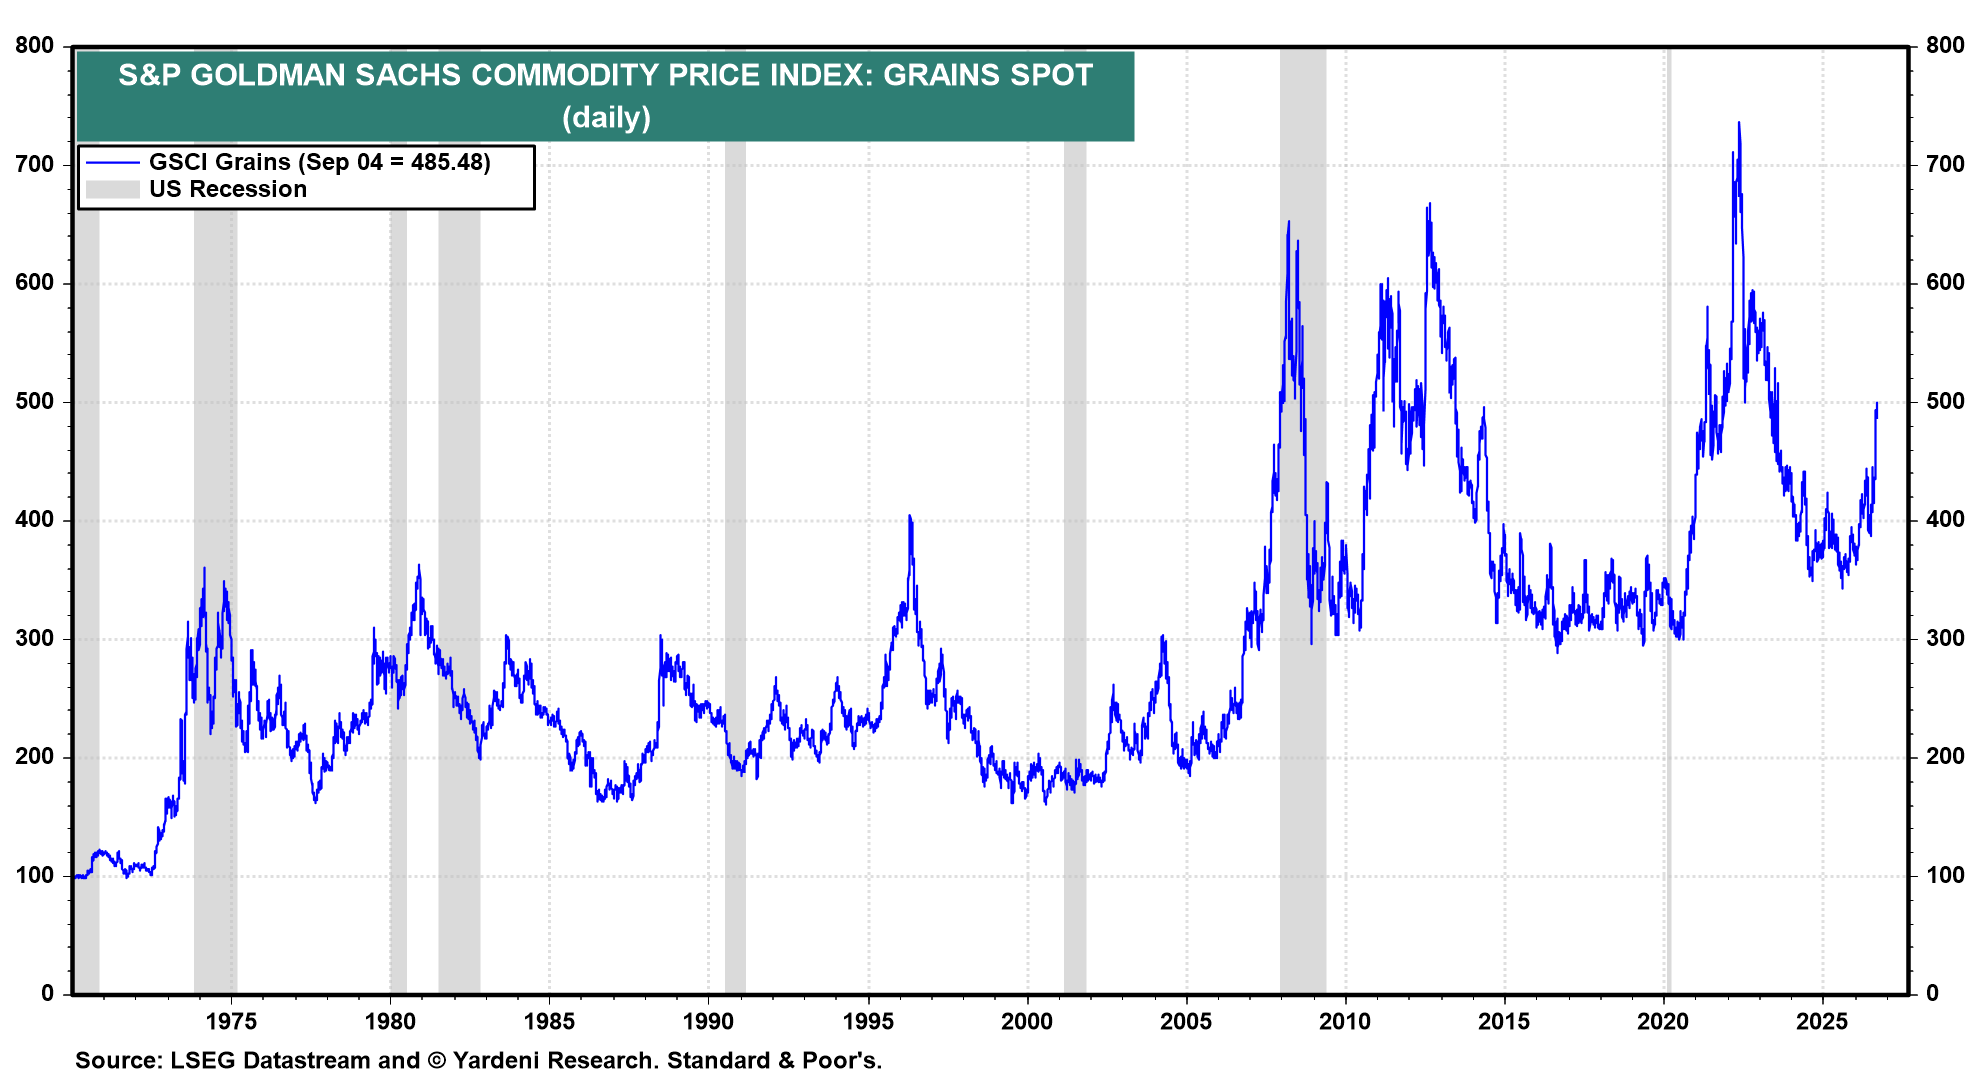
Commodity prices are turning into a source of inflation. Rising grain prices may soon show up in food inflation worldwide (chart).
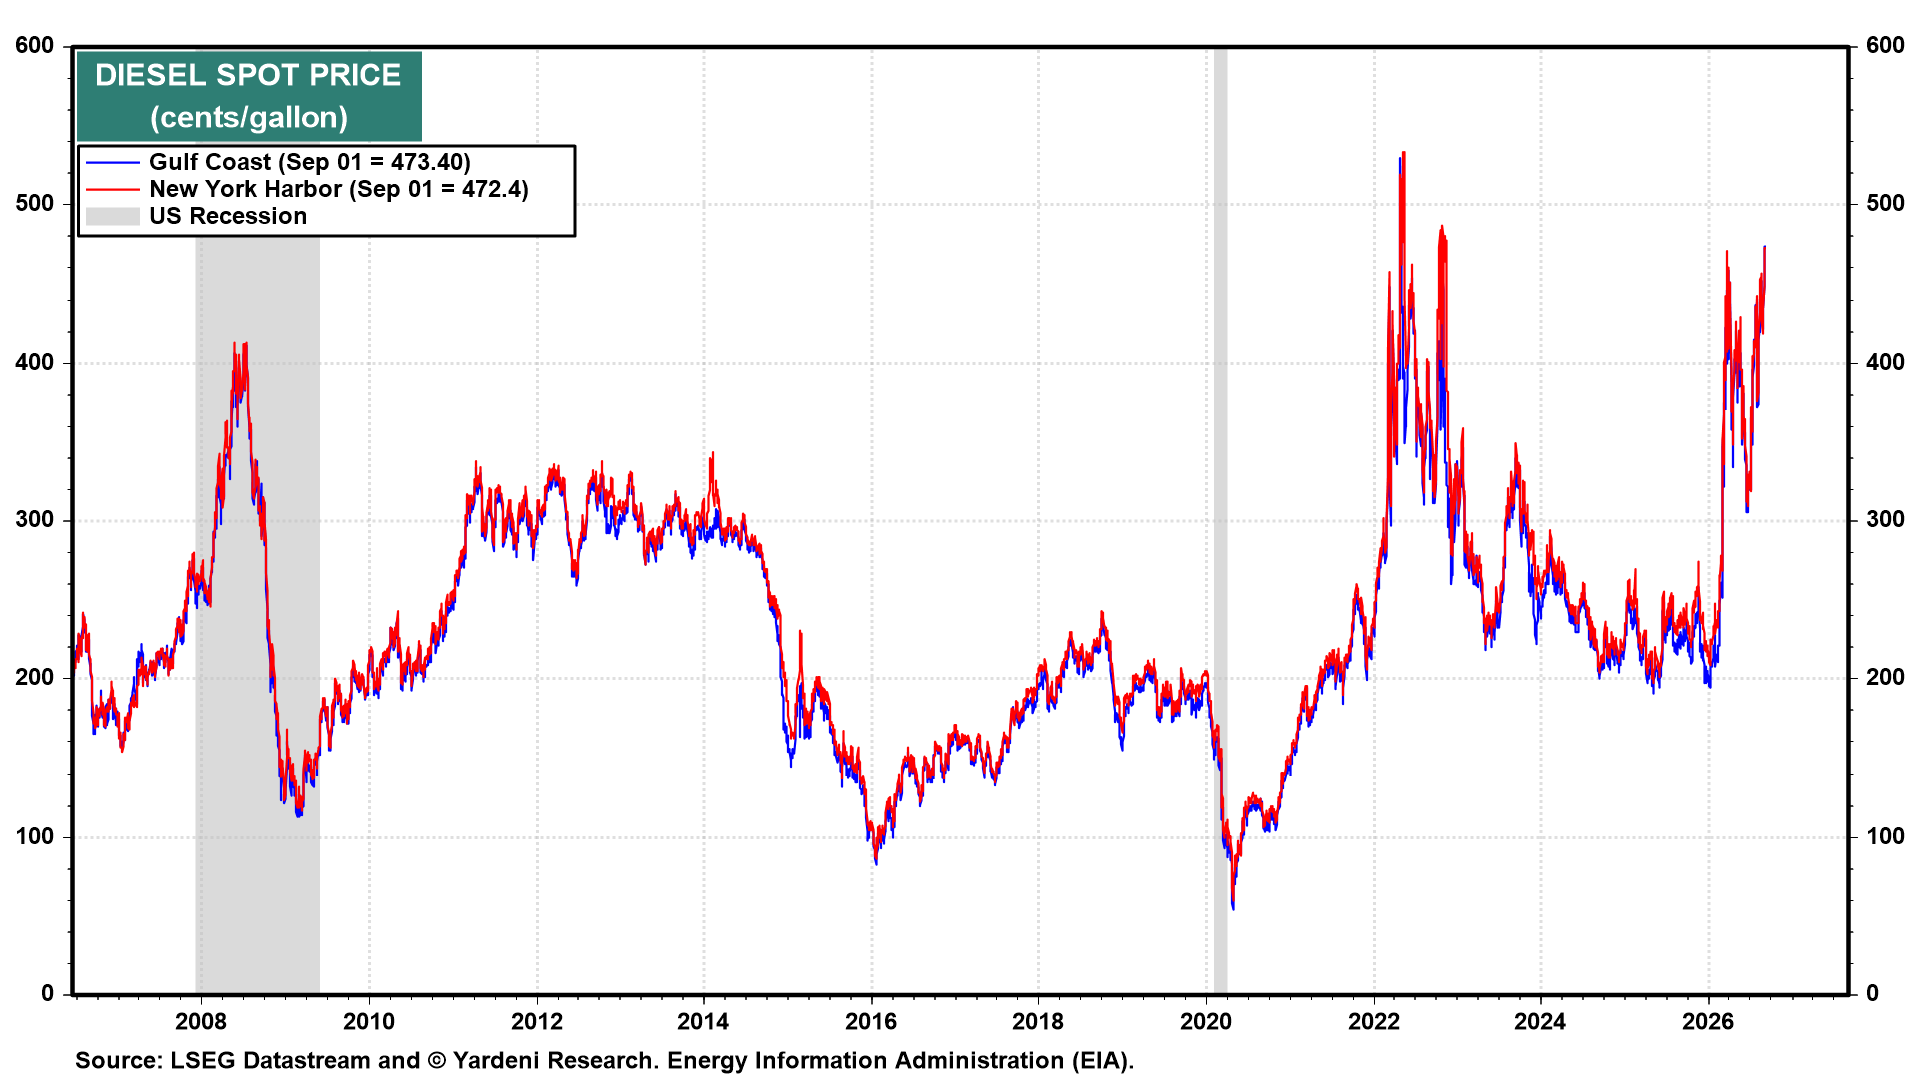
Diesel is a key input for industrials and transport names. Spot prices have been rising sharply in recent weeks (chart).