The stock market balloon is climbing higher, and the burners are firing. It isn't all hot air that is lifting stock prices. It's also earnings revisions, which are increasing for 2026 and 2027. Growth stocks and the Magnificent-7 have reasserted leadership over the past month. Small caps and the Russell 2000 are at fresh record highs too. Investor sentiment remains surprisingly lackluster, leaving plenty of upside for the balloon. Even the soft spot in private credit is showing signs of stabilizing.
The question is whether the balloon is actually a bubble. We don't think so. Consider the following:
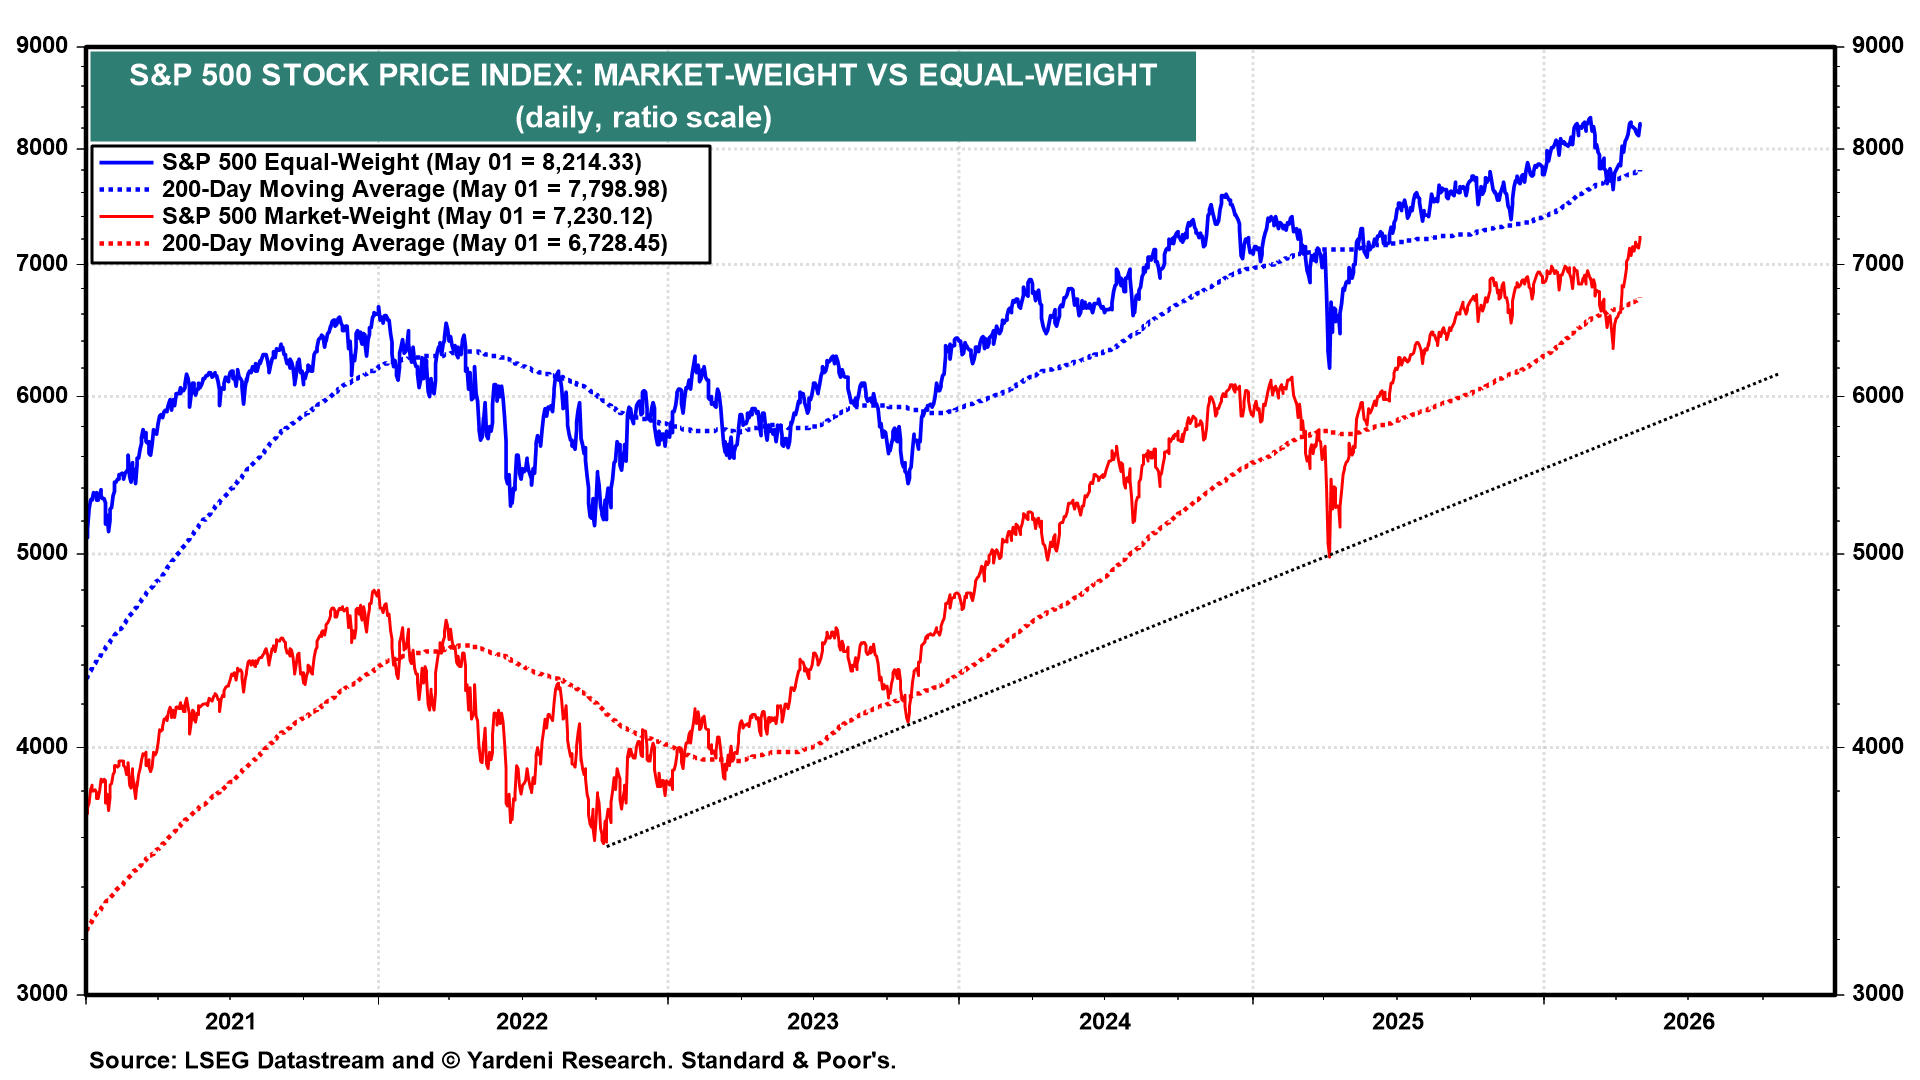
(1) Stock prices. The S&P 500 market-cap-weighted and equal-weighted indexes have rebounded significantly since they bottomed on March 30 (chart). The former has risen to a record high, and we expect the latter to follow suit. Both of their 200-day moving averages (dma) are trending higher.
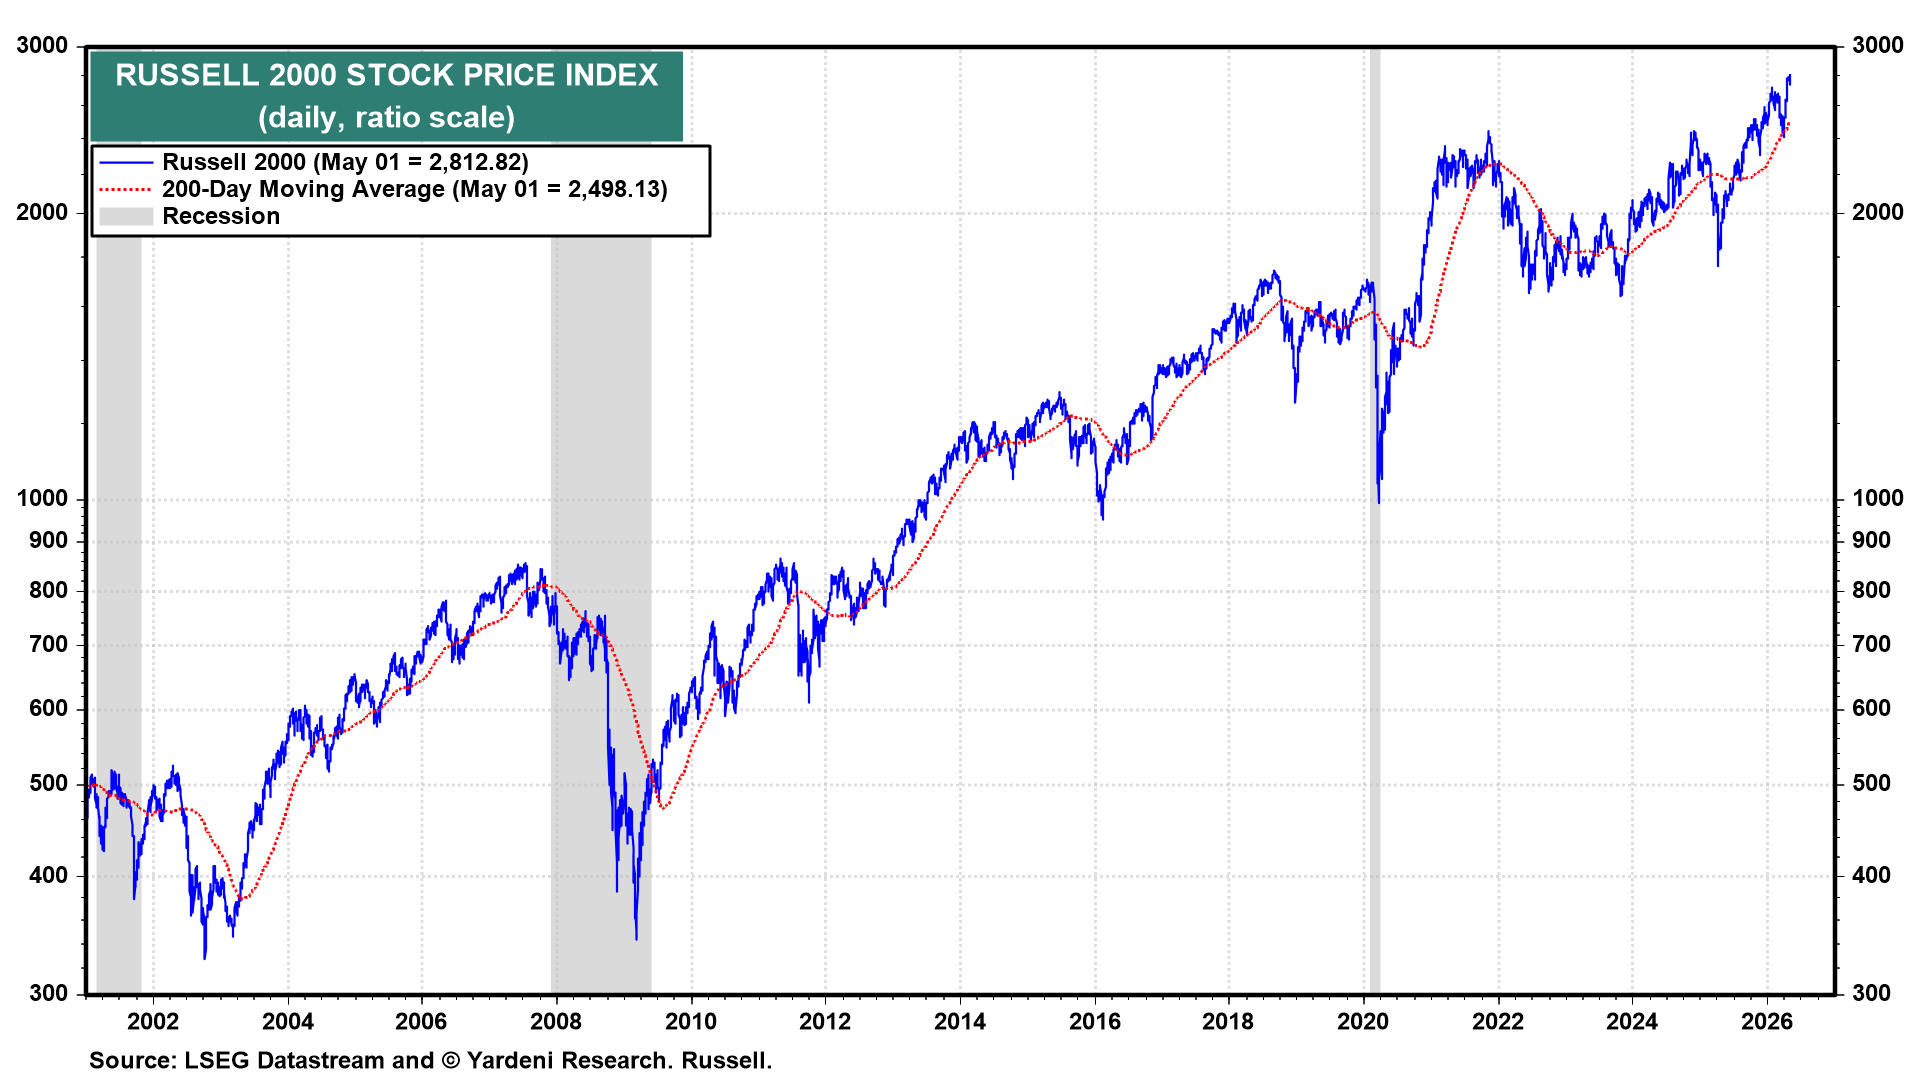
The Russell 2000 closed at a fresh record high on Friday, and its 200-dma is trending higher (chart). Small-cap stocks’ participation in the new-high record-setting is a positive confirmation of the sustainability of the rally.
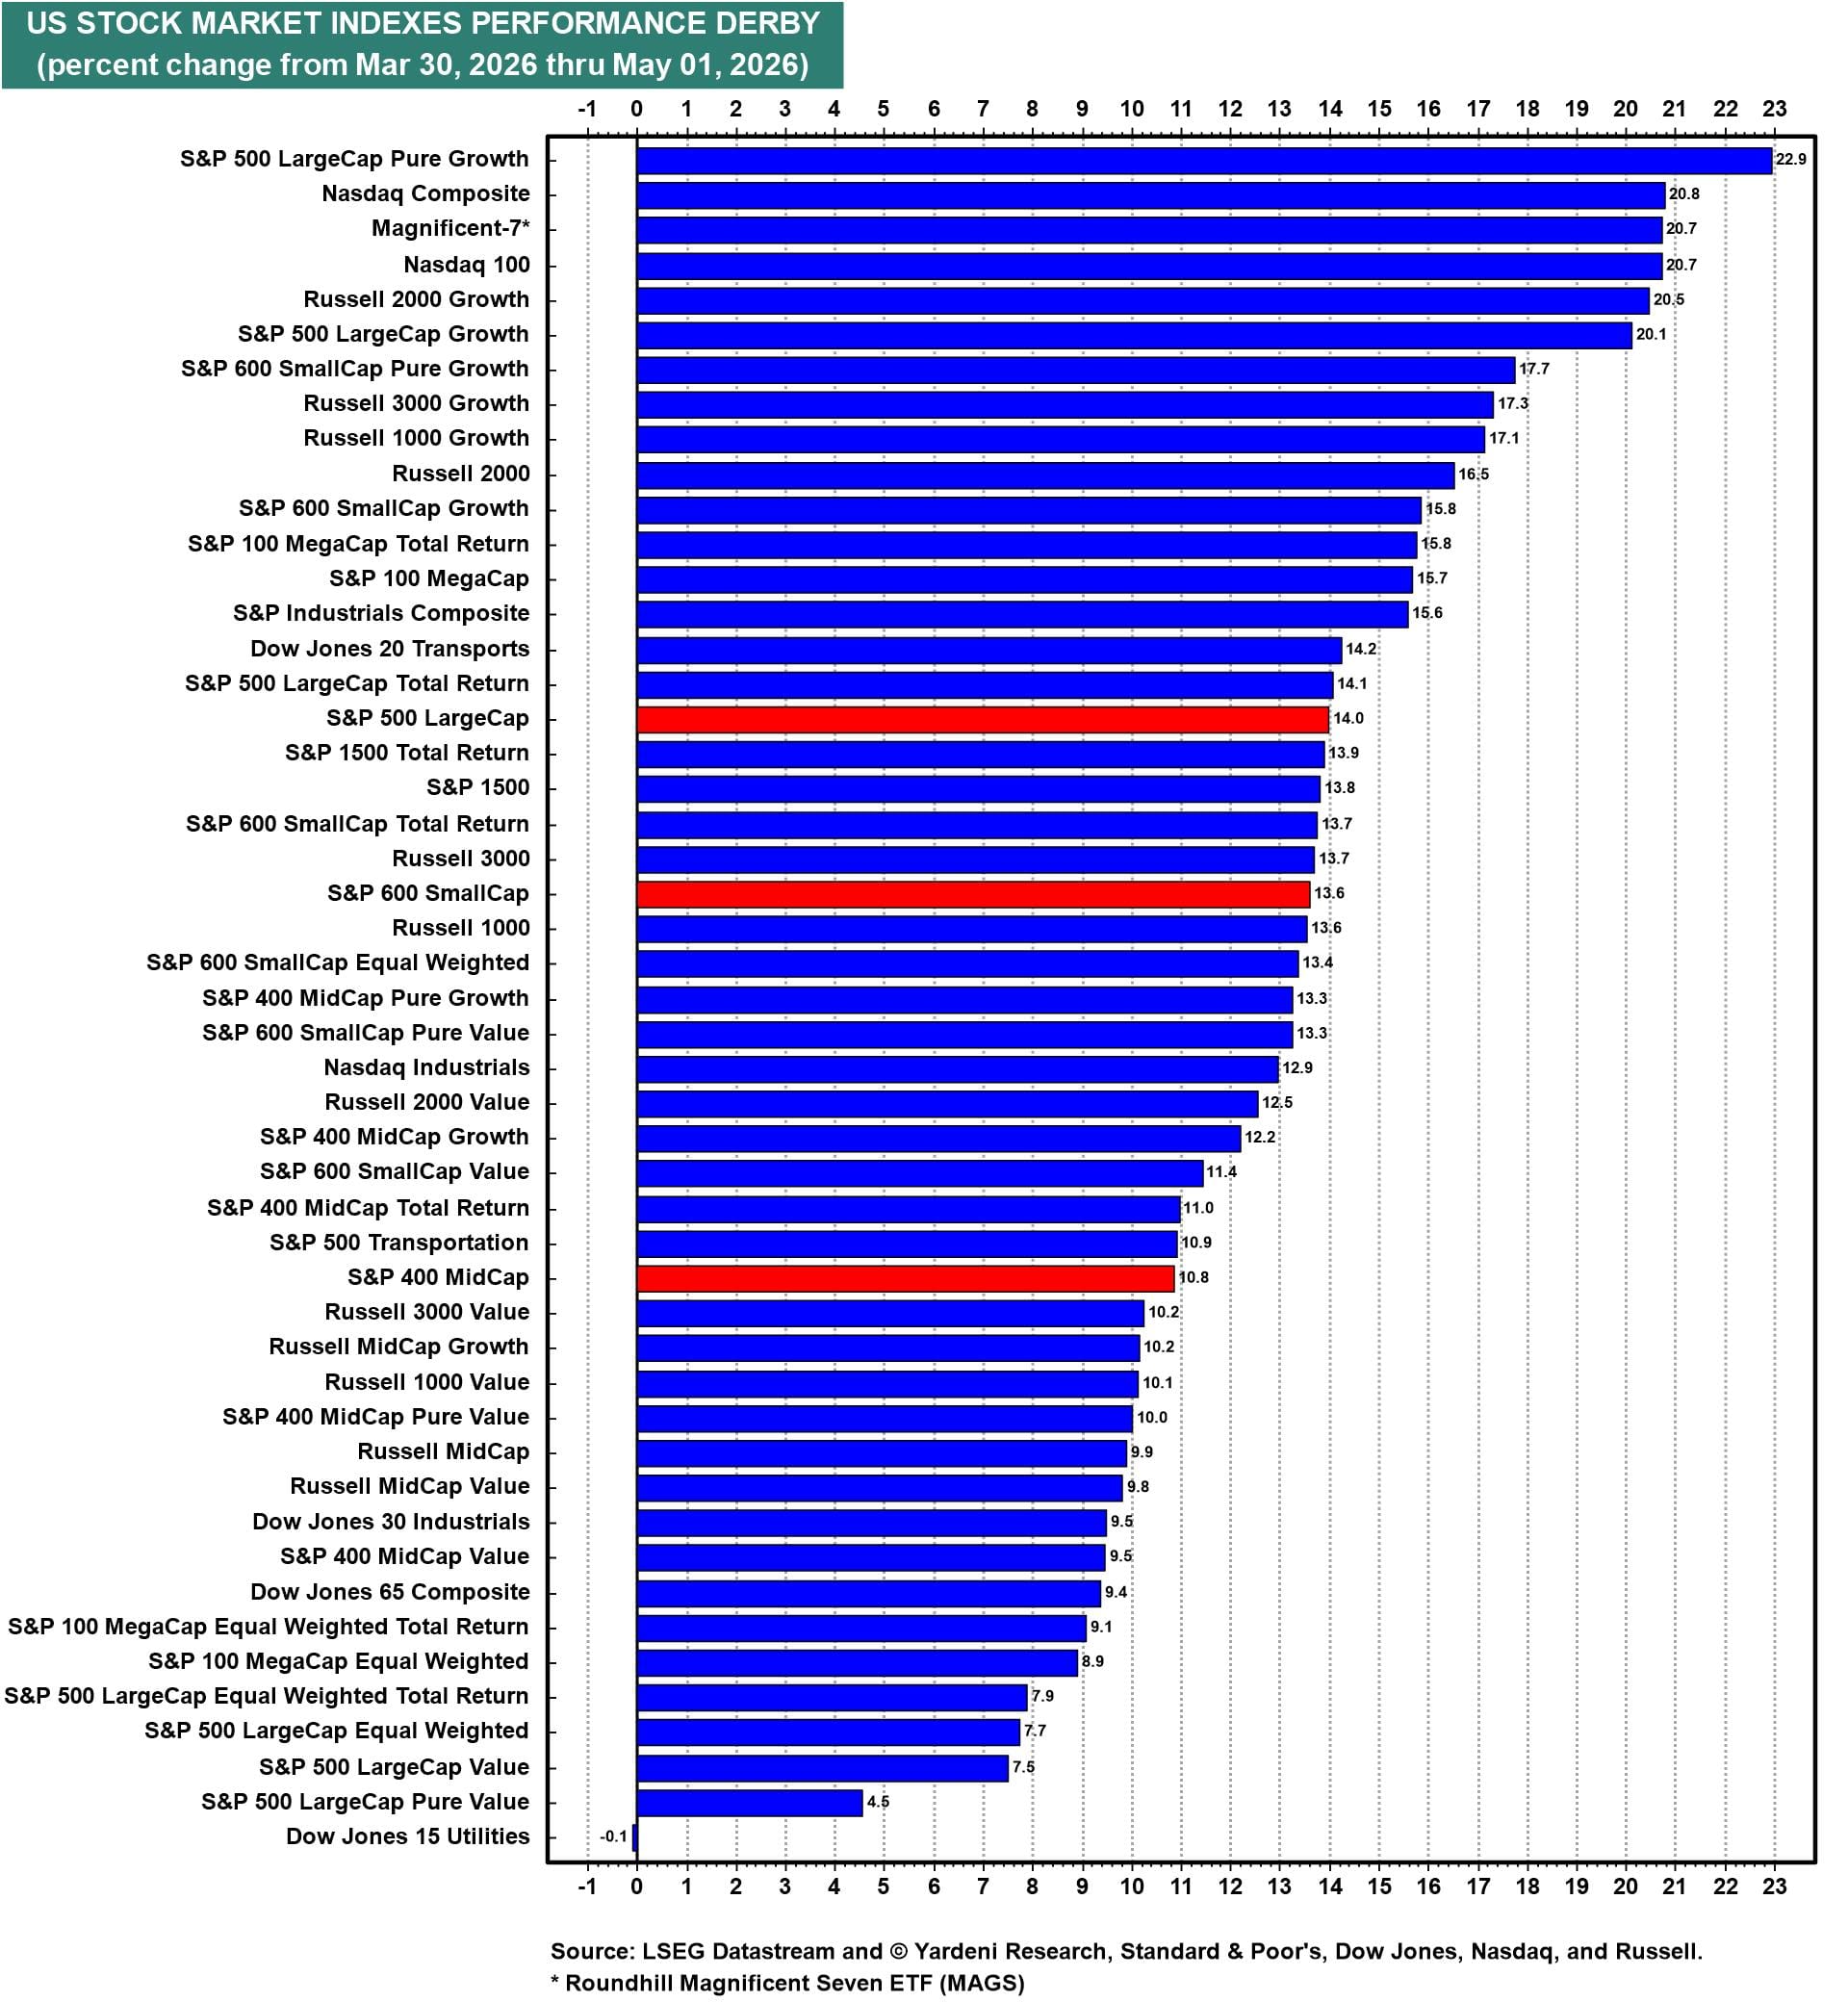
The performance derby shows the leaders and laggards since the March 30 low in the S&P 500 (chart). Value's early-year bounce has faded as Growth has decisively reasserted itself, driven by renewed conviction in the AI theme.
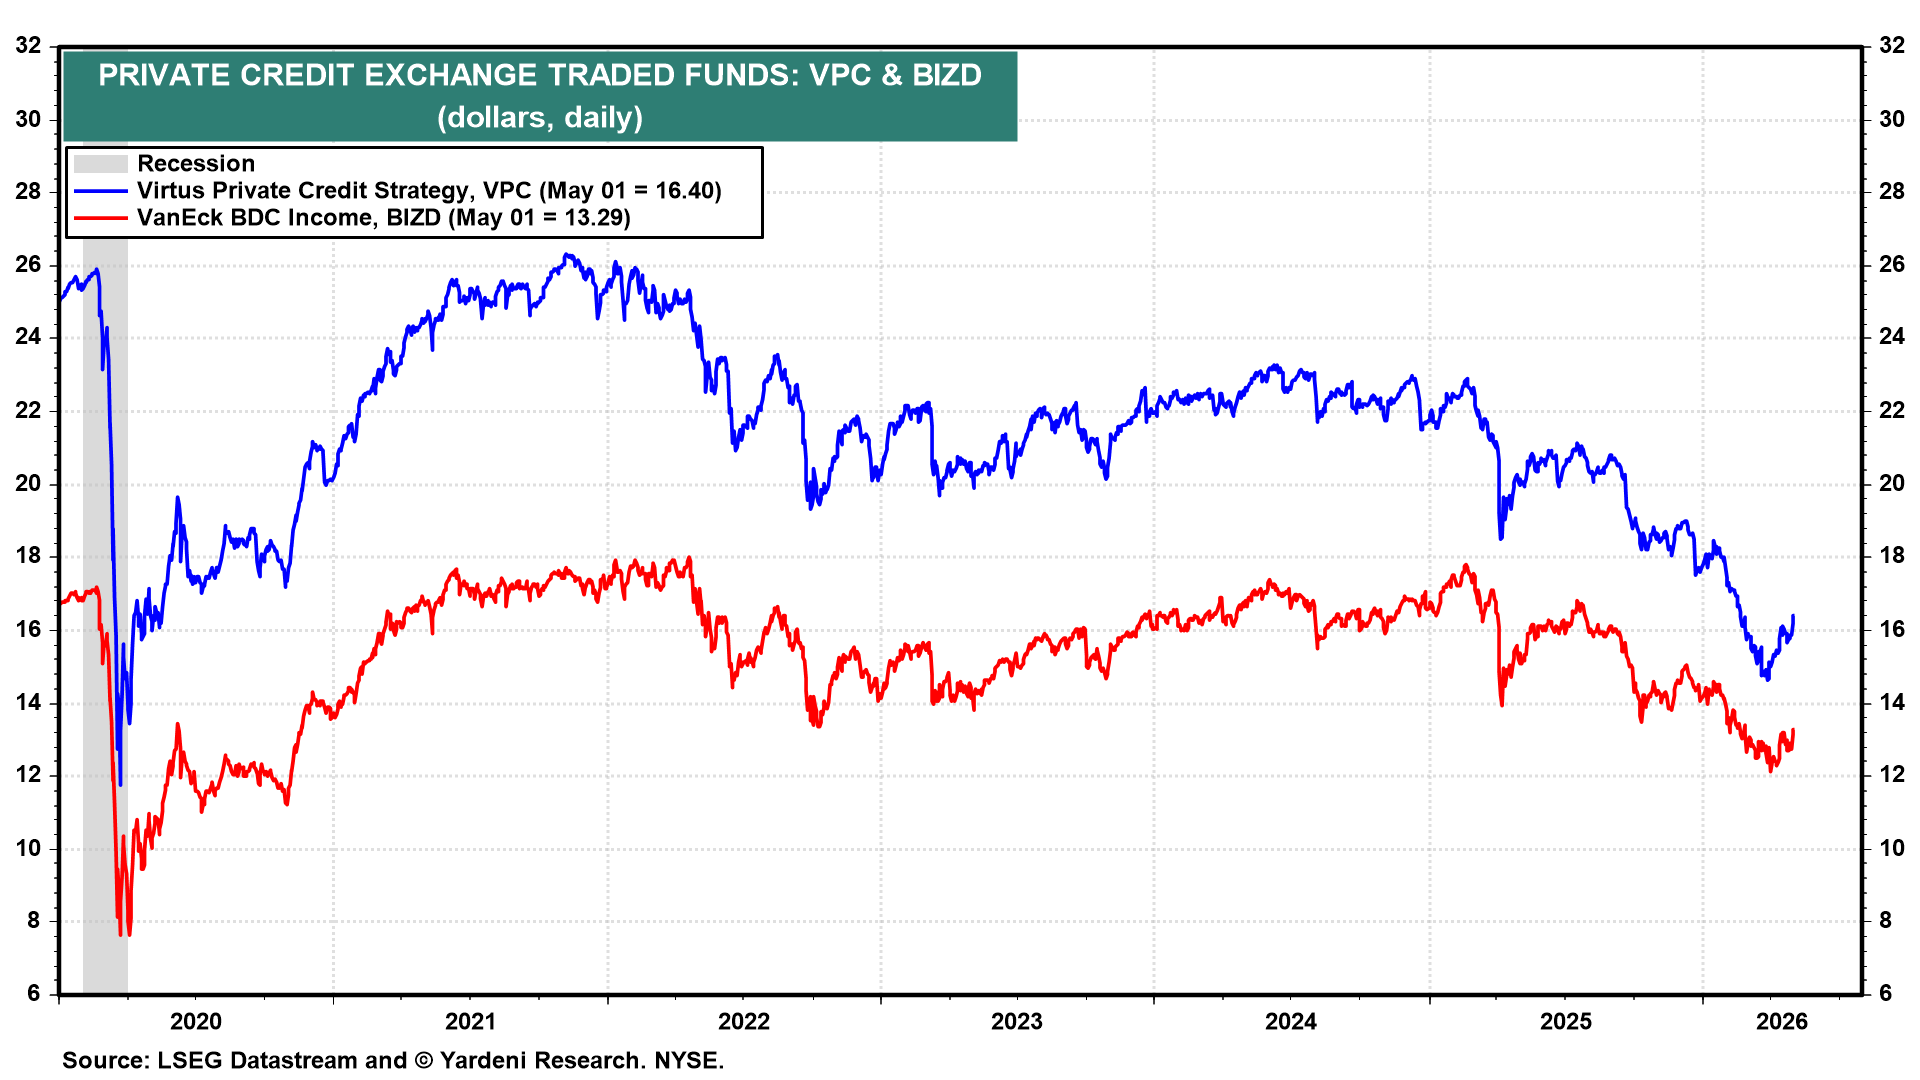
Investors are starting to nibble on private credit ETFs (chart). The Virtus Private Credit ETF (VPC) and VanEck BDC Income ETF (BIZD) both have rebounded off their recent lows (chart). Commercial bank loans and leases continue to rise, reinforcing our Financials thesis that the stress in the credit market is localized rather than systemic.
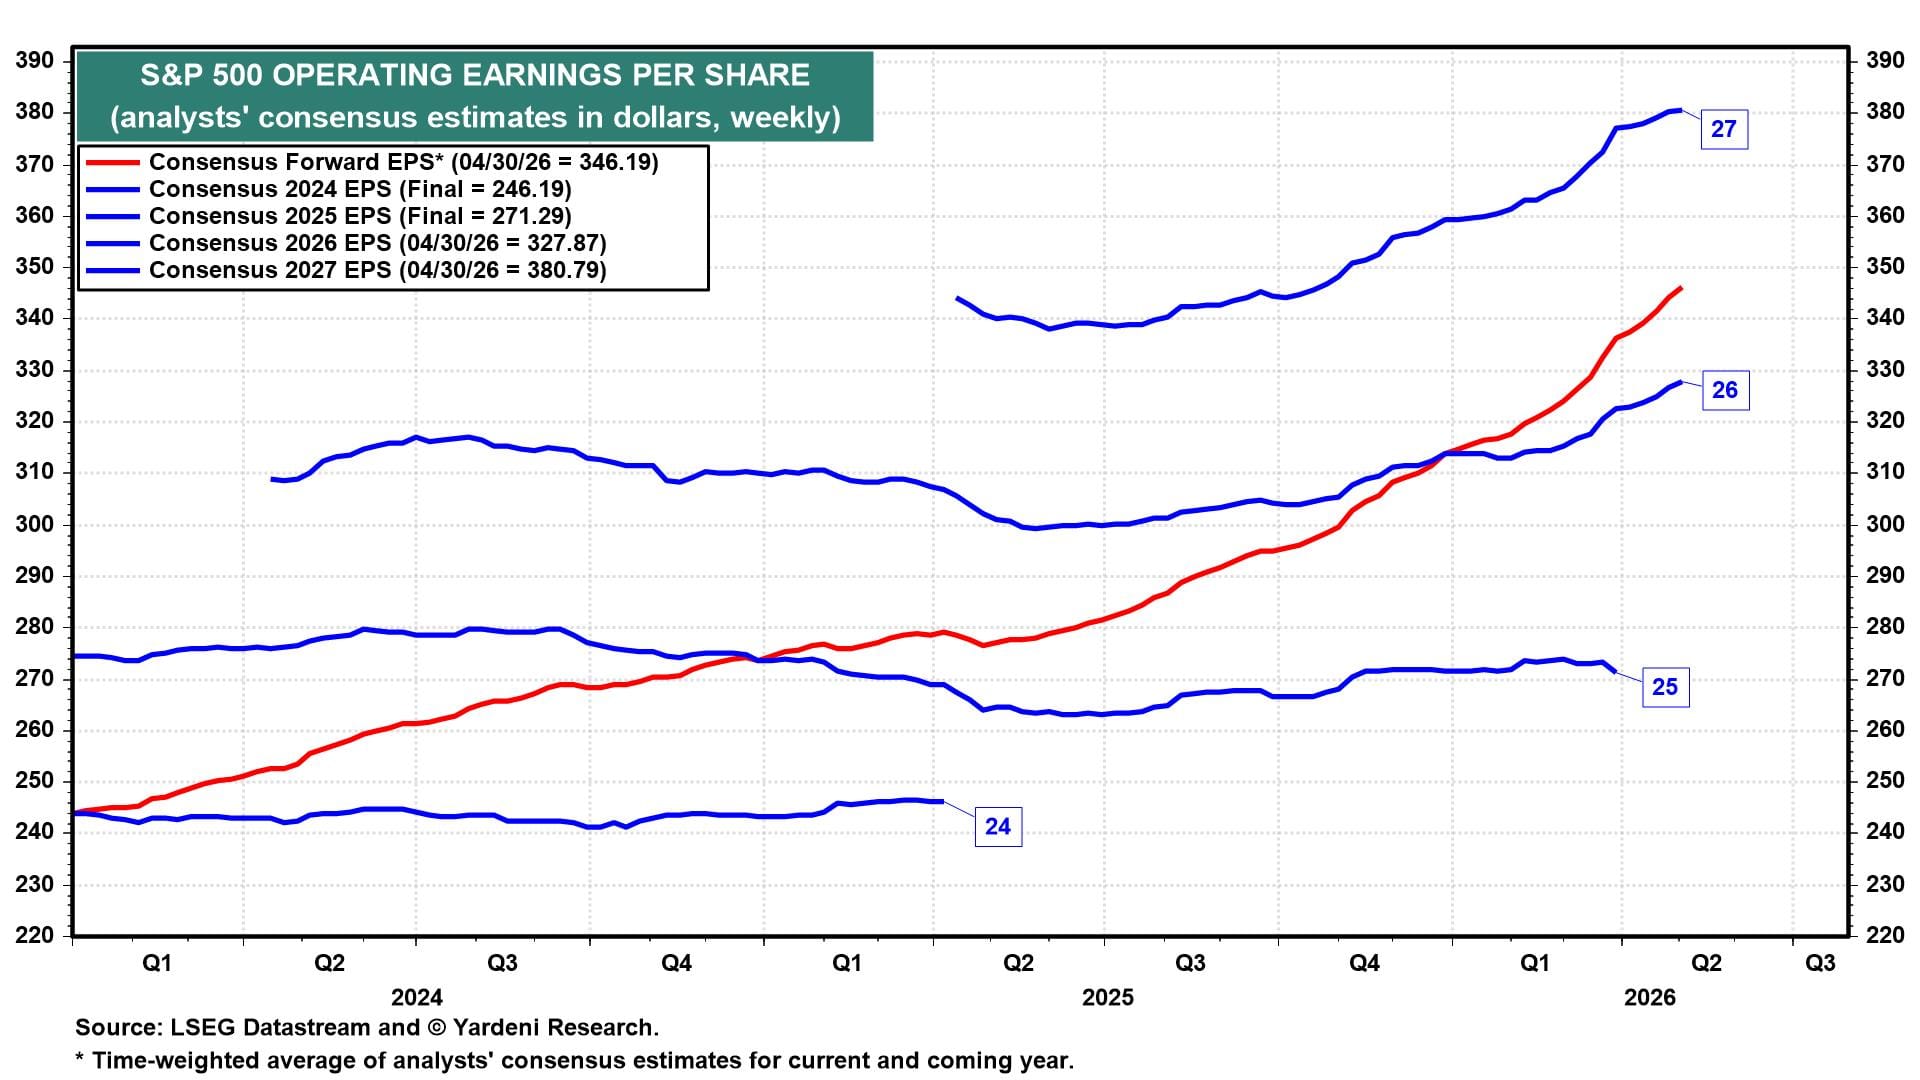
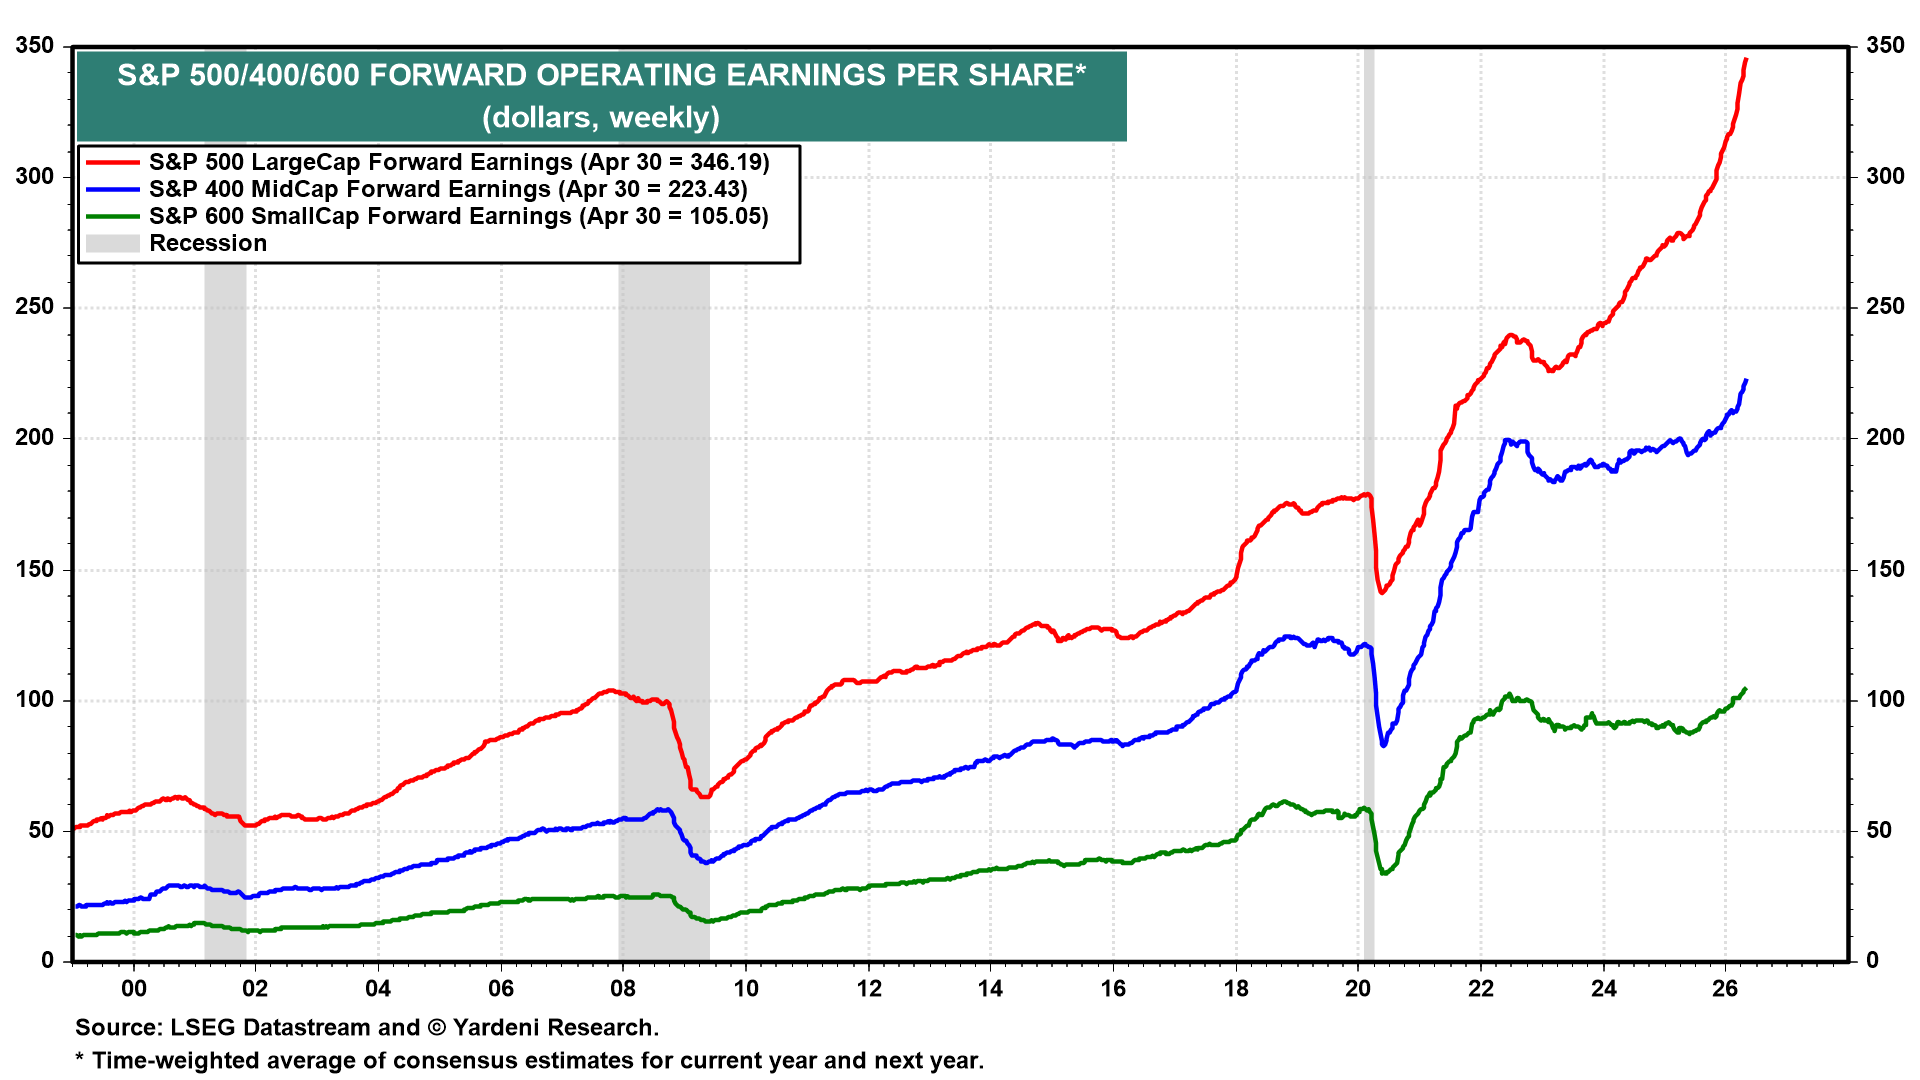
(2) Earnings. S&P 500 forward operating earnings has hit a fresh record high of $346.19 per share (chart). Consensus EPS estimates now stand at $327.87 for 2026 and $380.79 for 2027, and both appear still to be rising. Forward earnings is the single best leading indicator of stock prices, and it continues to point higher.
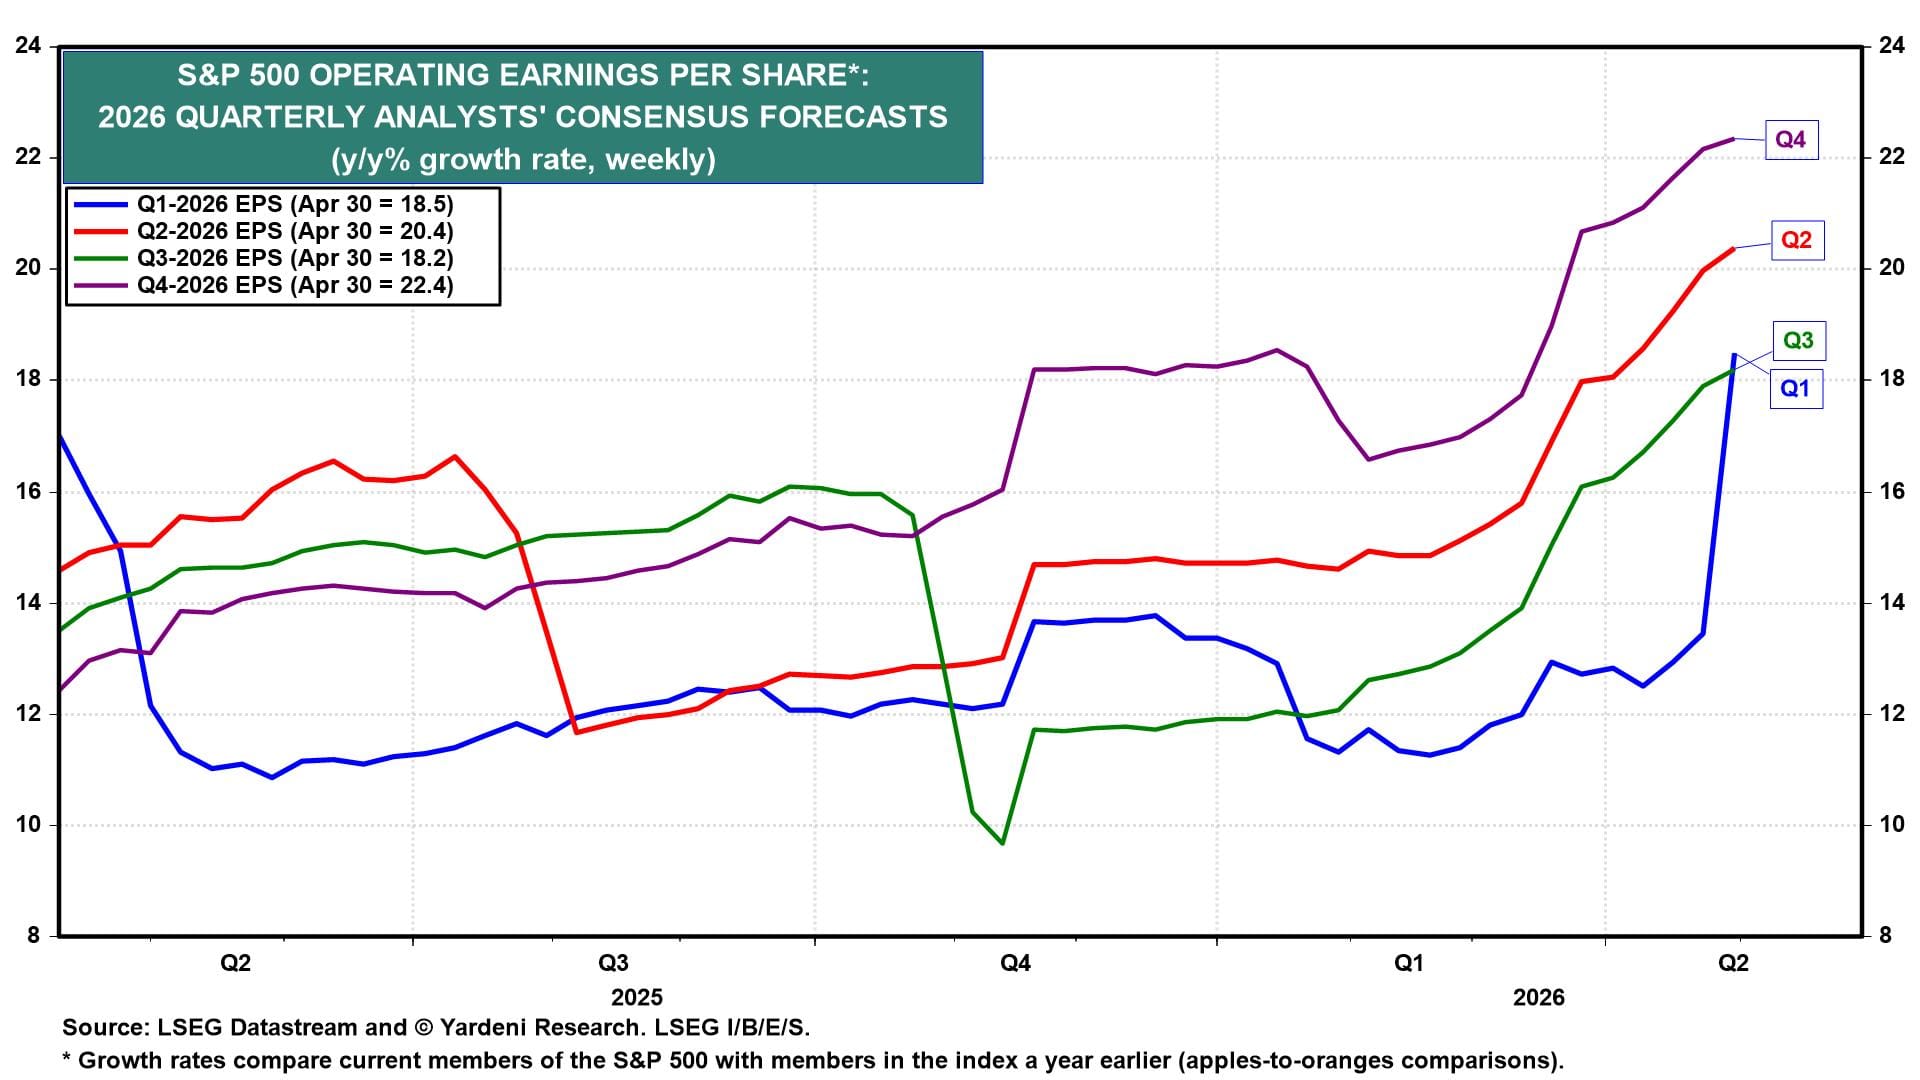
Q1's blended EPS growth rate jumped to 18.5% during the week of April 30 from 13.4% just a week earlier, with roughly 44% of S&P 500 companies reporting last week and broadly beating expectations (chart). This "earnings hook" is truly remarkable because analysts didn't turn as pessimistic about the quarter as they often have in the past just before earnings seasons, setting the stage for frequent upside hooks.
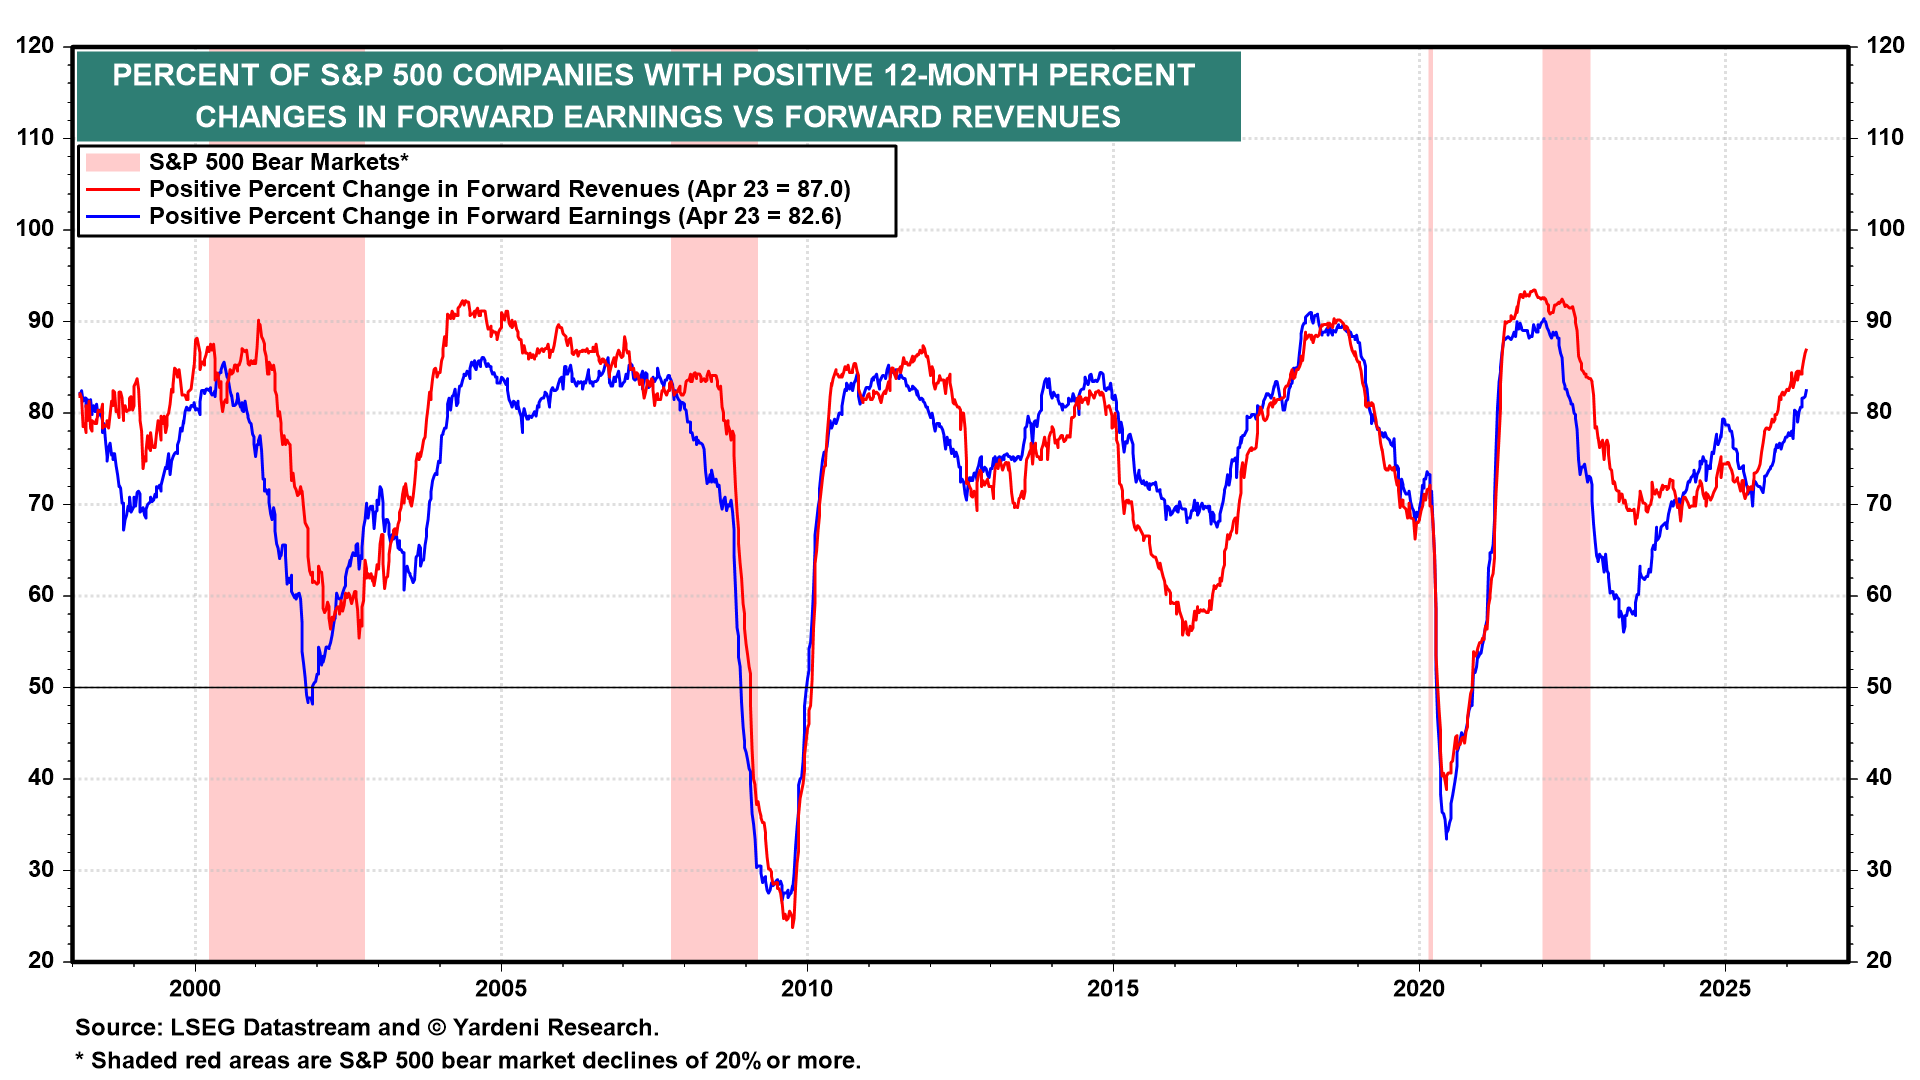
Revenue breadth is leading earnings breadth higher at 87.0% versus 82.6% (chart). There is still more upside for both.
The S&P 500 LargeCap index is doing the heavy lifting in terms of absolute forward earnings, but the forward earnings of the S&P 400 MidCap and S&P 600 SmallCap indexes are also at record highs (chart). The earnings tailwind is broadening down the cap stack.
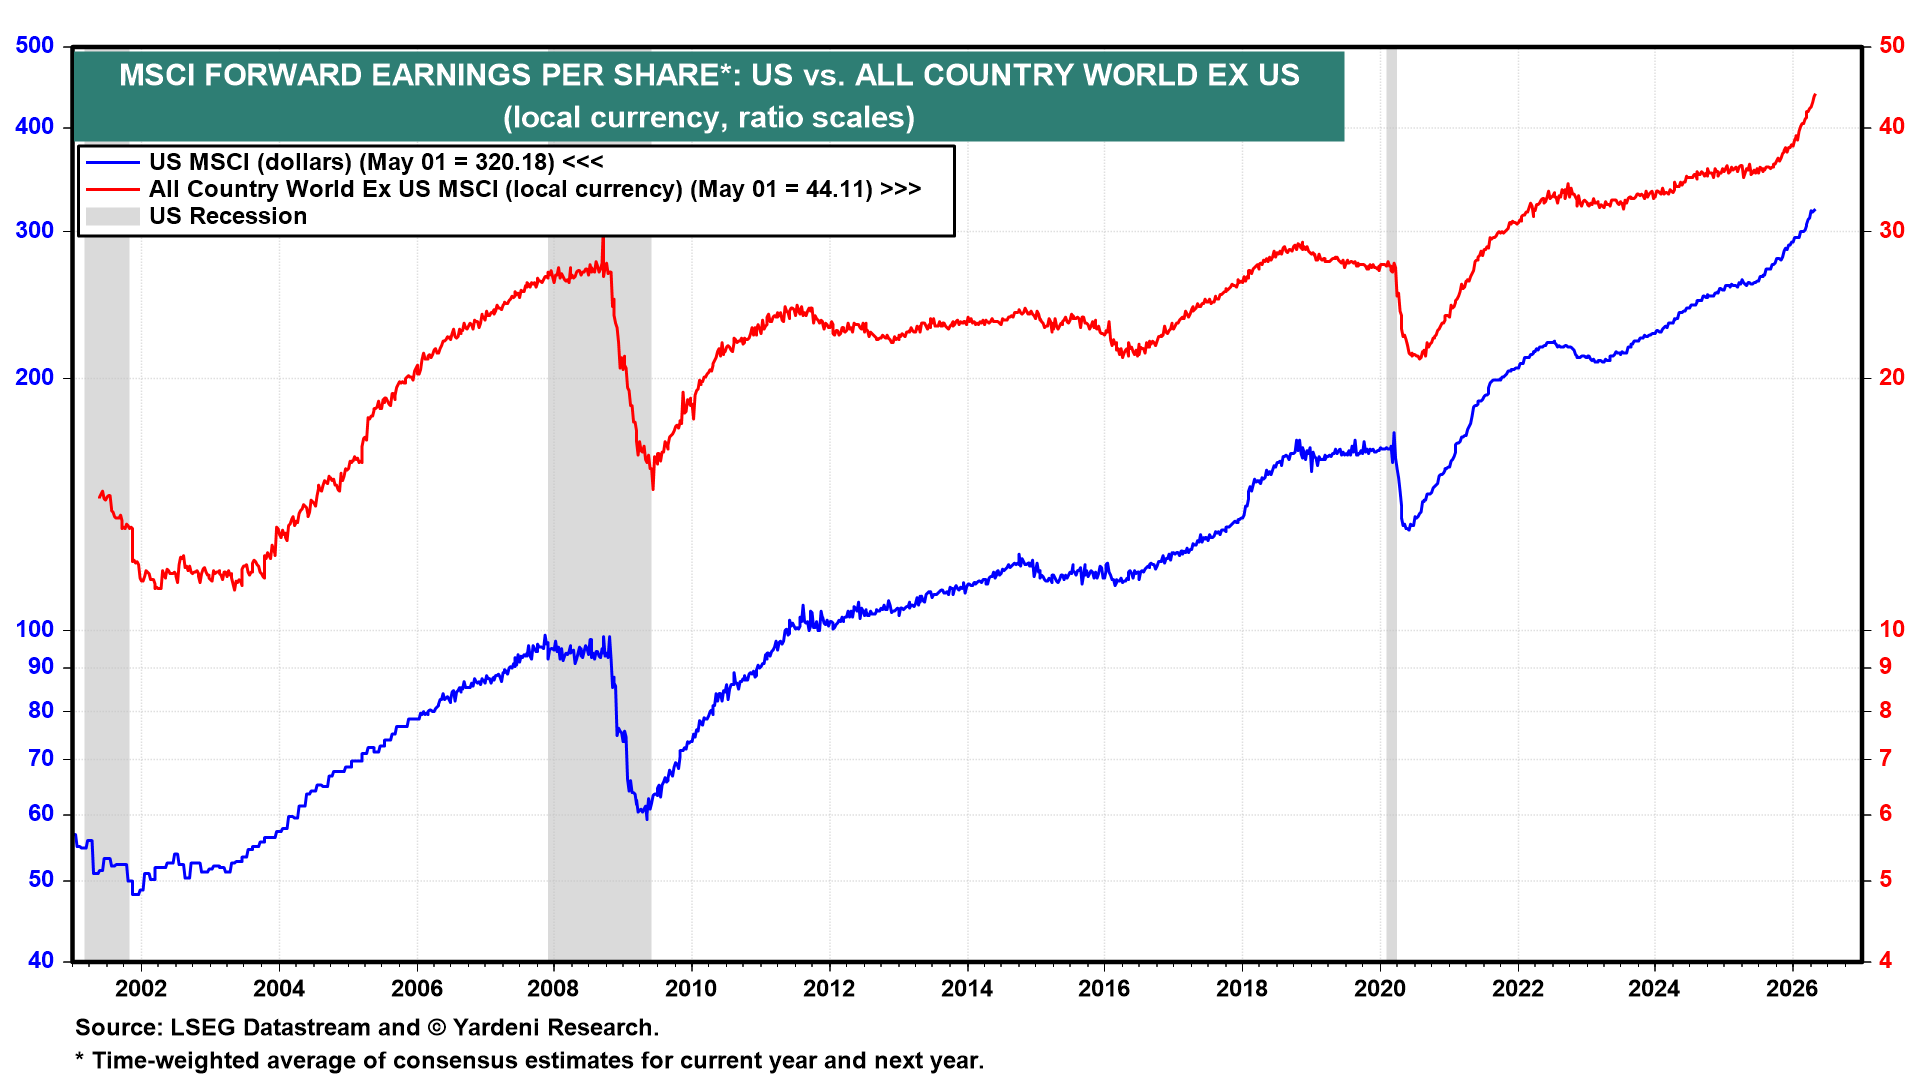
The global bull market in stocks continues to be fueled by the record-setting forward earnings of the All Country World ex US MSCI and of the US MSCI (chart).
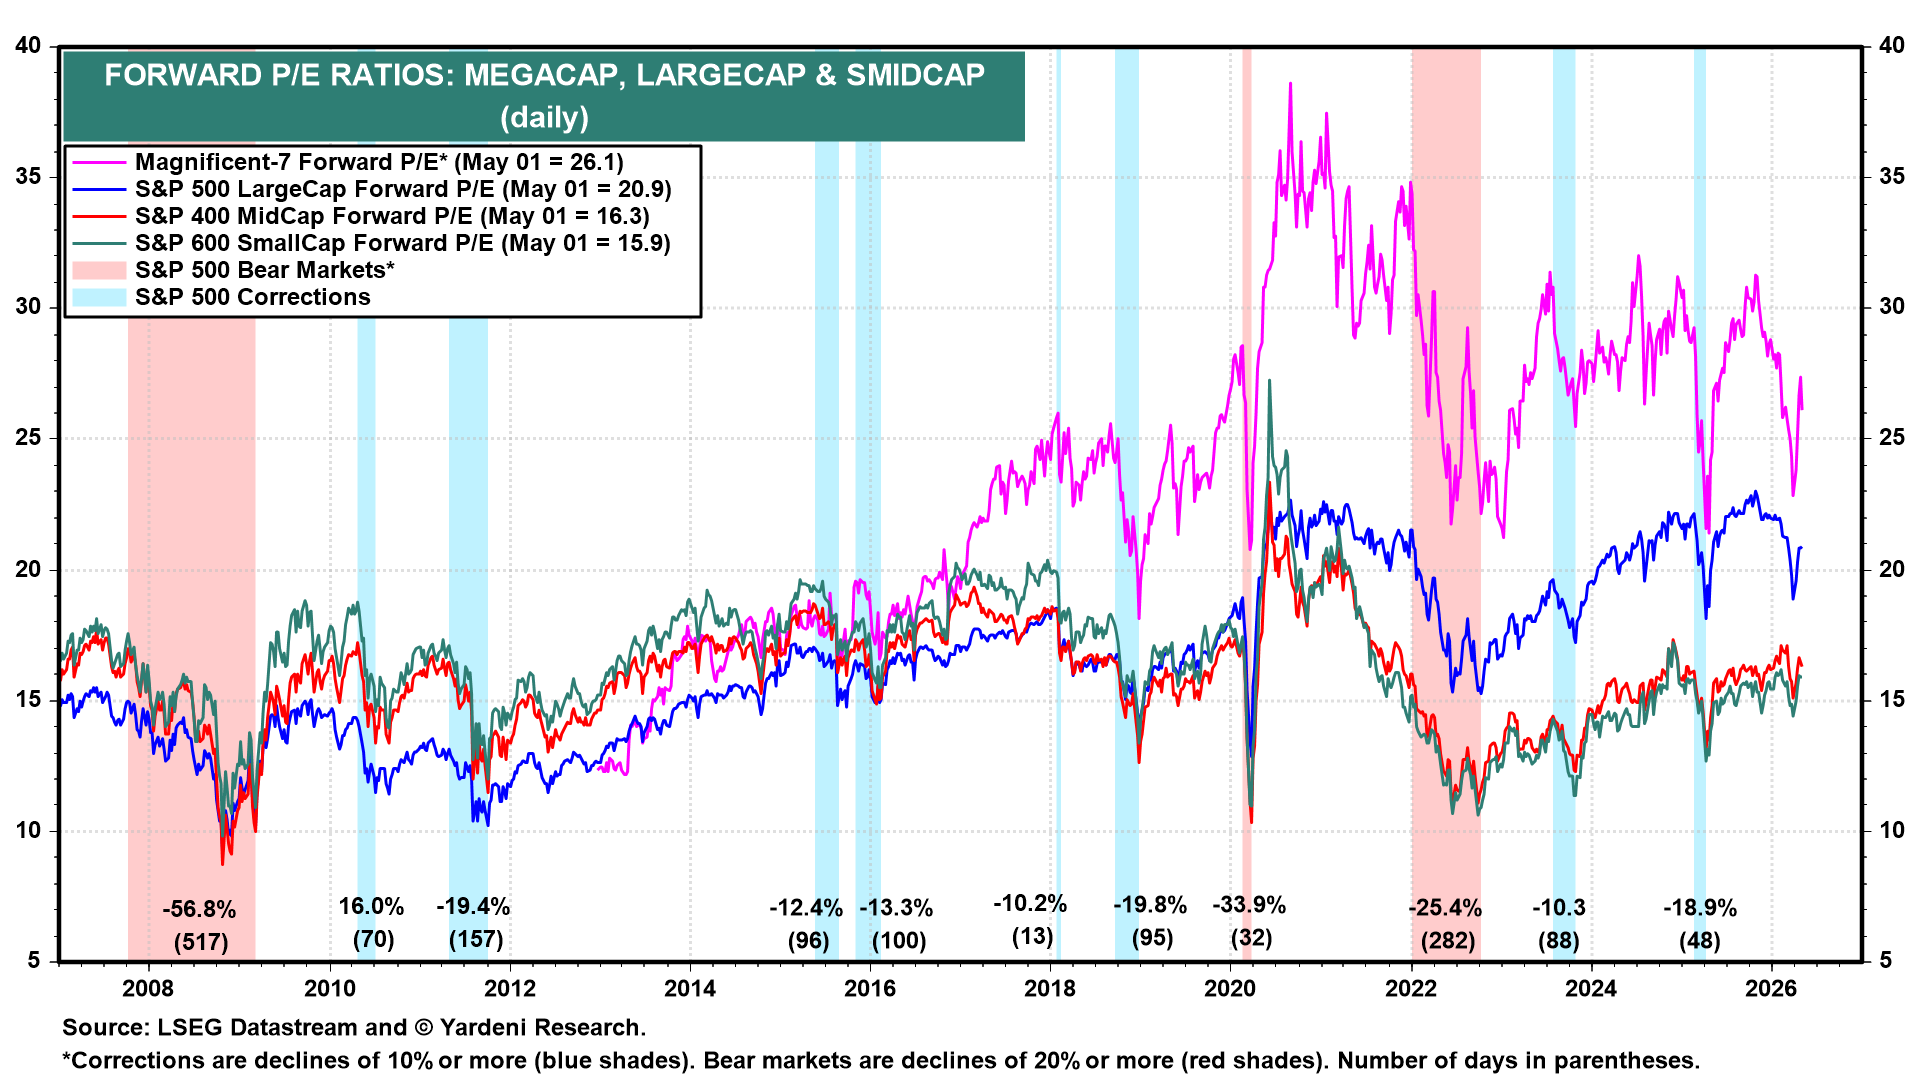
(3) Valuation. US stocks are still cheaper than they were at the end of last year. The forward P/E of the S&P 500 is at 20.9, well below the 23.0 peak at year-end 2025. MidCap’s forward P/E is at 16.3, and SmallCap’s is at 15.9. Both are still cheap relative to their own histories. Even the Magnificent-7’s forward P/E of 26.1 is well off its peak of last October (chart).
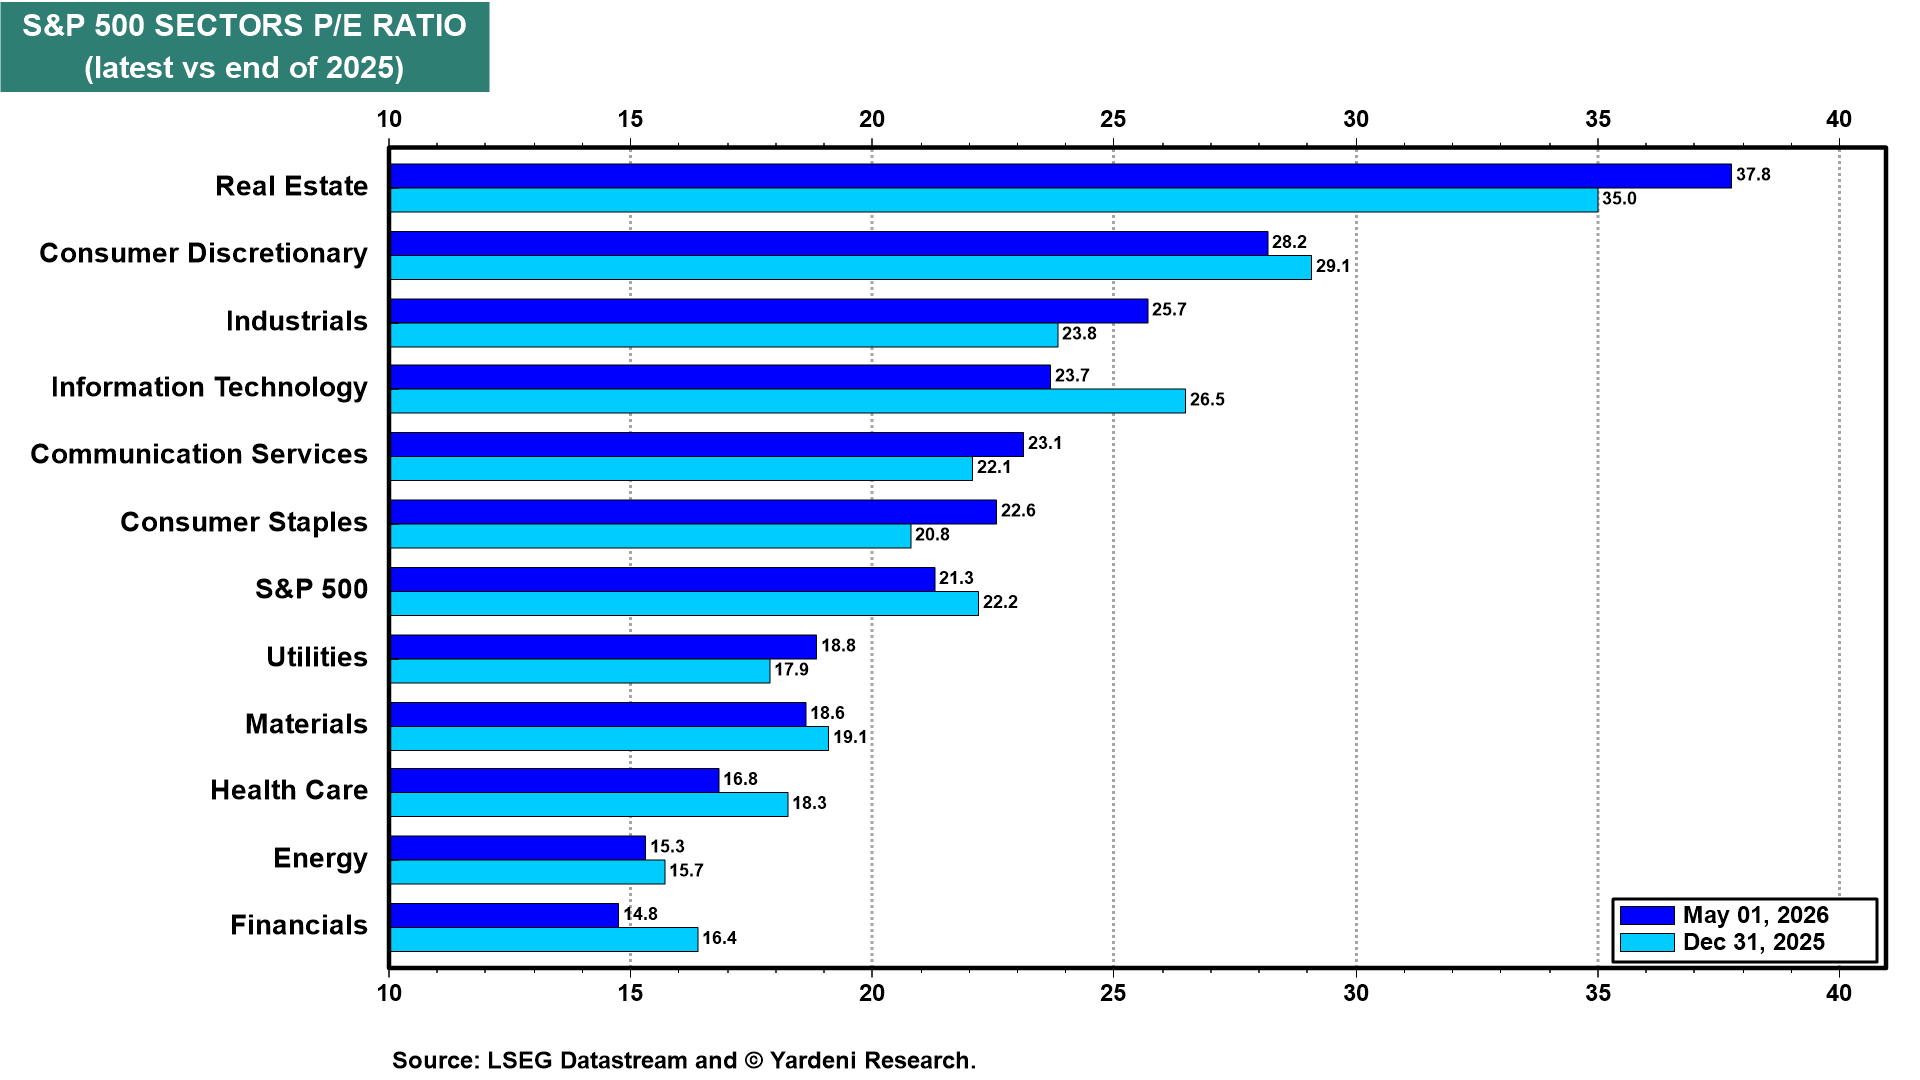
Sector multiples confirm the valuation compression. Information Technology’s forward P/E has de-rated from 26.5 to 23.7 since year-end 2025, with Financials’ down from 16.4 to 14.8 (chart). Real Estate at 37.8 and Consumer Discretionary at 28.2 are relatively expensive. Financials and Energy at 14.8 and 15.3 remain relatively cheap.
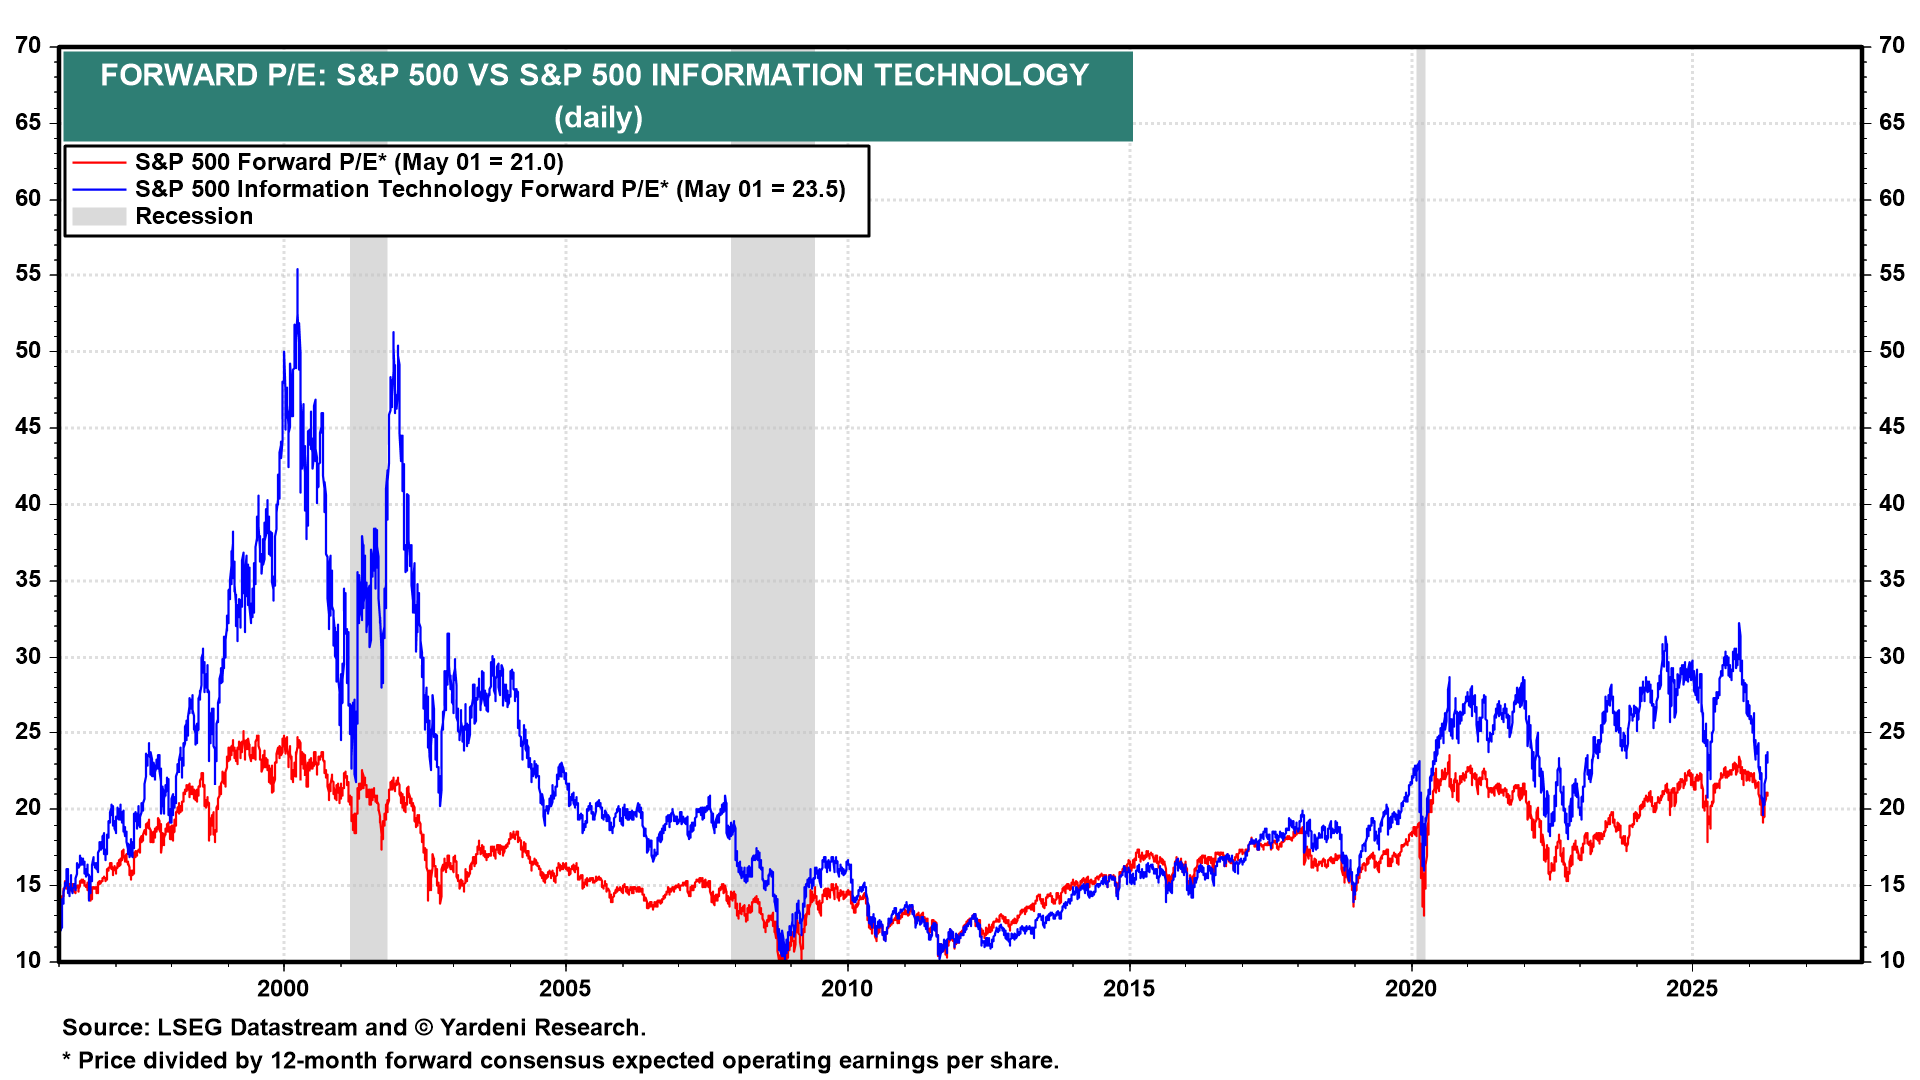
The IT sector’s forward P/E remains a long way from dot-com-era territory. The S&P 500 IT sector trades at 23.5 versus the S&P 500’s 21.0, a modest 2.5pt premium (chart). Investors are pricing the AI thesis with discipline that was absent during the tech bubble of the late 1990s.
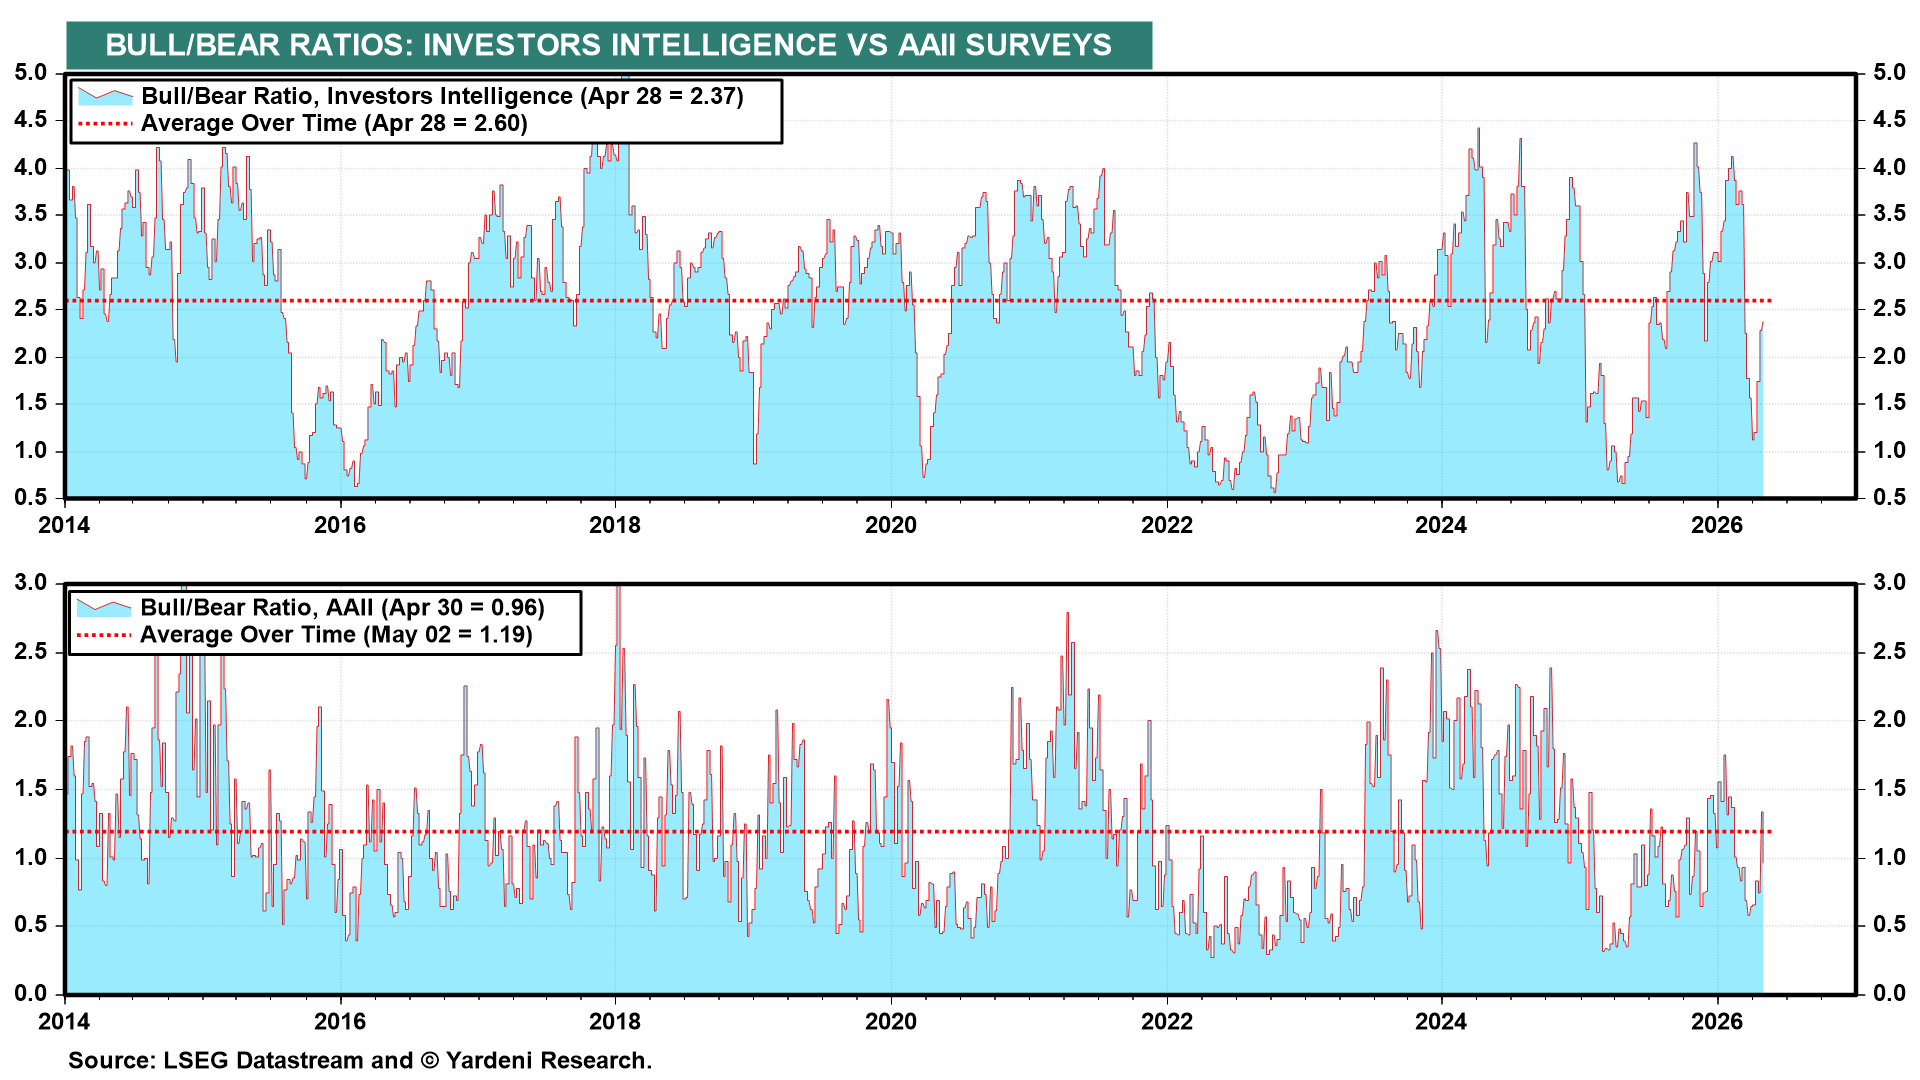
(4) Sentiment. Our two favorite Bull/Bear Ratios (BBR) have recovered sharply from the depressed readings that informed our March 30 bottom call the evening of March 31 (chart). Investors Intelligence’s BBR is at 2.37 versus its 2.60 long-term average, and AAII’s is at 0.96 versus 1.19. Both have lifted well off the lows, but neither is anywhere near readings that would flash a contrarian sentiment top. Rising-but-still-below-average sentiment is exactly the profile of a bull market with room to run.