On Tuesday night, we suggested that the S&P 500 might have bottomed on Monday, with a pullback of 9.1% (i.e., just under a 10% correction) from its January 27 record high. Tuesday's strong equity rally was triggered by reports that the US had found an exit ramp from its war with Iran. Wednesday night, President Donald Trump confirmed that the US would exit in two to three weeks.
Stocks opened lower today as oil prices rose on fears that the US would exit the war without opening the Strait of Hormuz. Stocks then recovered during the day on reports that Iran and Oman are in the "final stages" of drafting a new joint protocol for the Strait of Hormuz. However, this is not an agreement to "open" the waterway in the traditional sense; rather, it is a move to formalize a new, restrictive navigation regime. Apparently, traders interpreted the "protocol" as a sign that a framework for managed transit is at least being discussed.
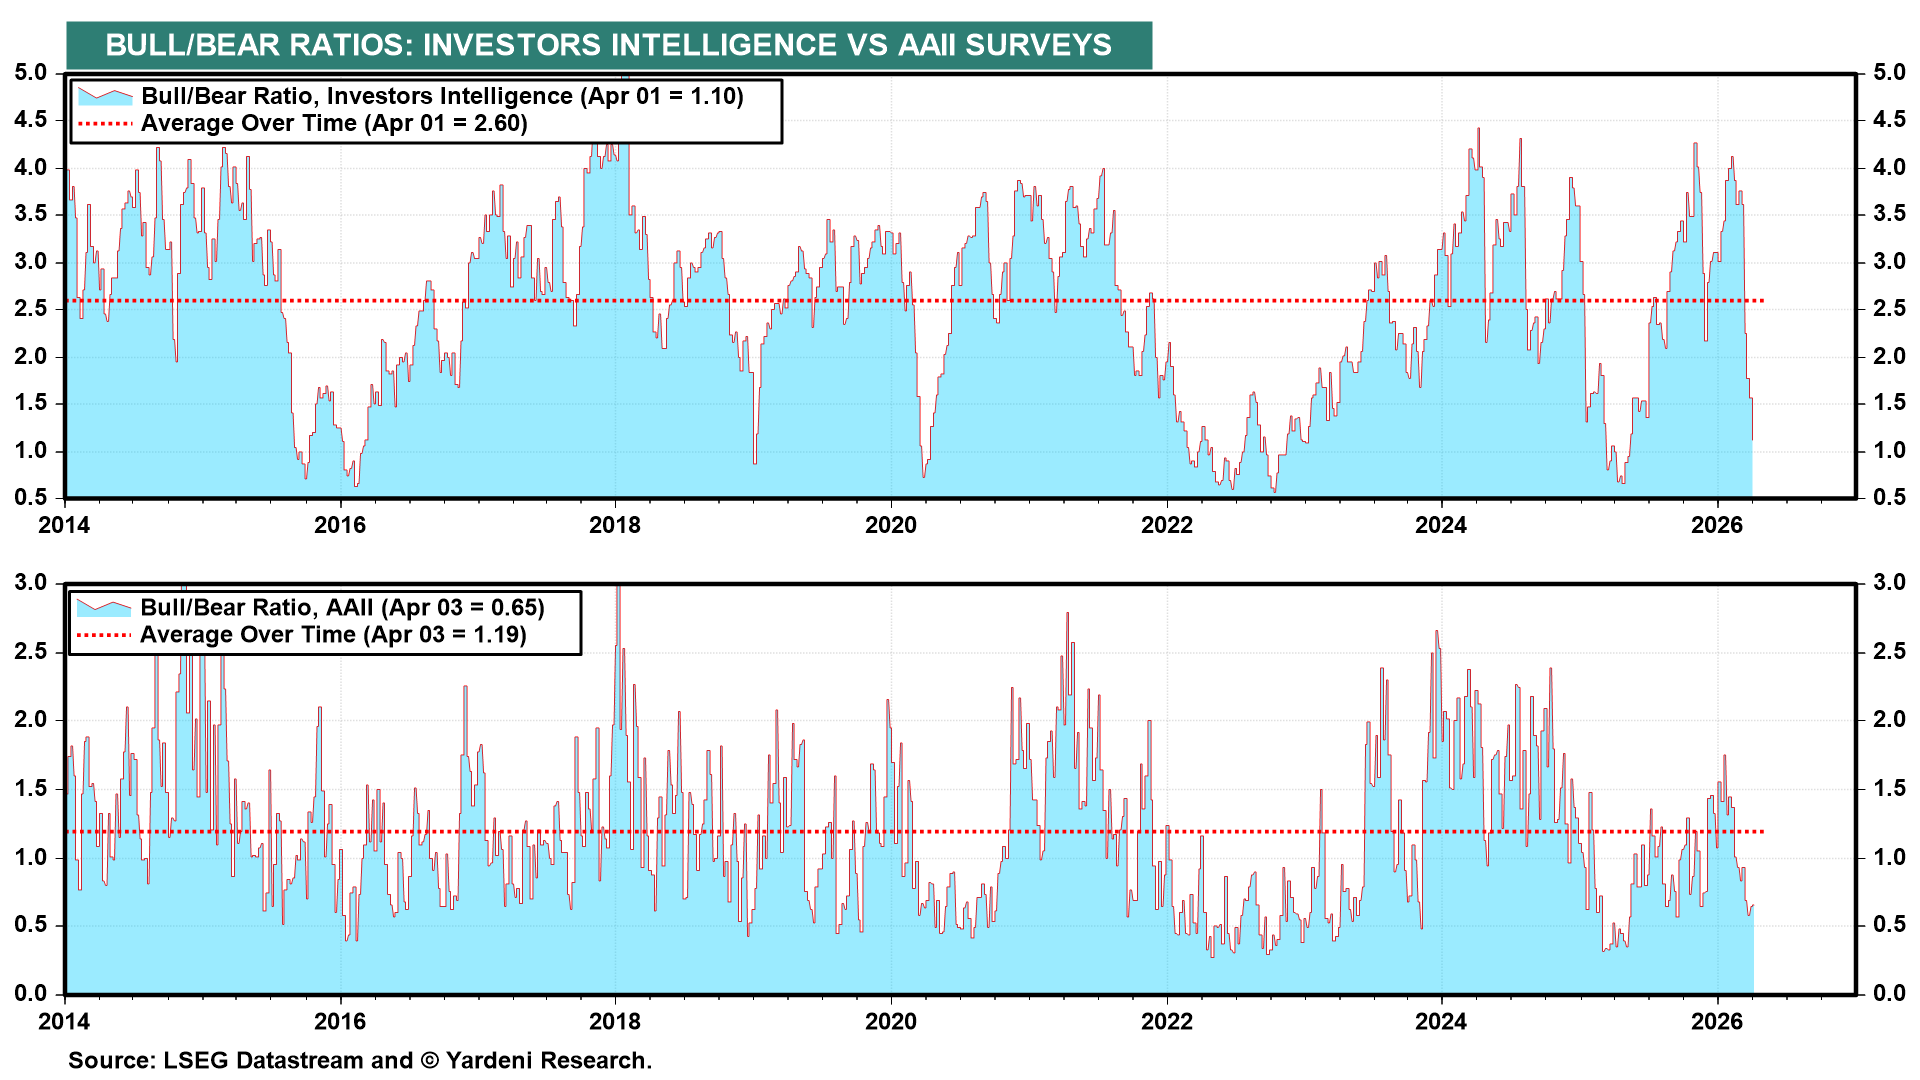
Our stock market bottom call is also based on the sharp declines in our two favorite sentiment indicators (chart). Their low readings tend to provide buy signals from a contrarian perspective. They worked like a charm last year when the market bottomed on April 8. In fact, in our April 7, 2025 QuickTakes titled, "Looking For A Stock Market Bottom In Fundamentals & Technicals," we wrote: "The latest reading of the AAII Bull/Bear Ratio, at 0.35, is as depressed as during previous bear markets. The same can be said about the Investors Intelligence Bull/Bear Ratio, which was 1.00 during the April 1 week. From a contrarian perspective, that's bullish."
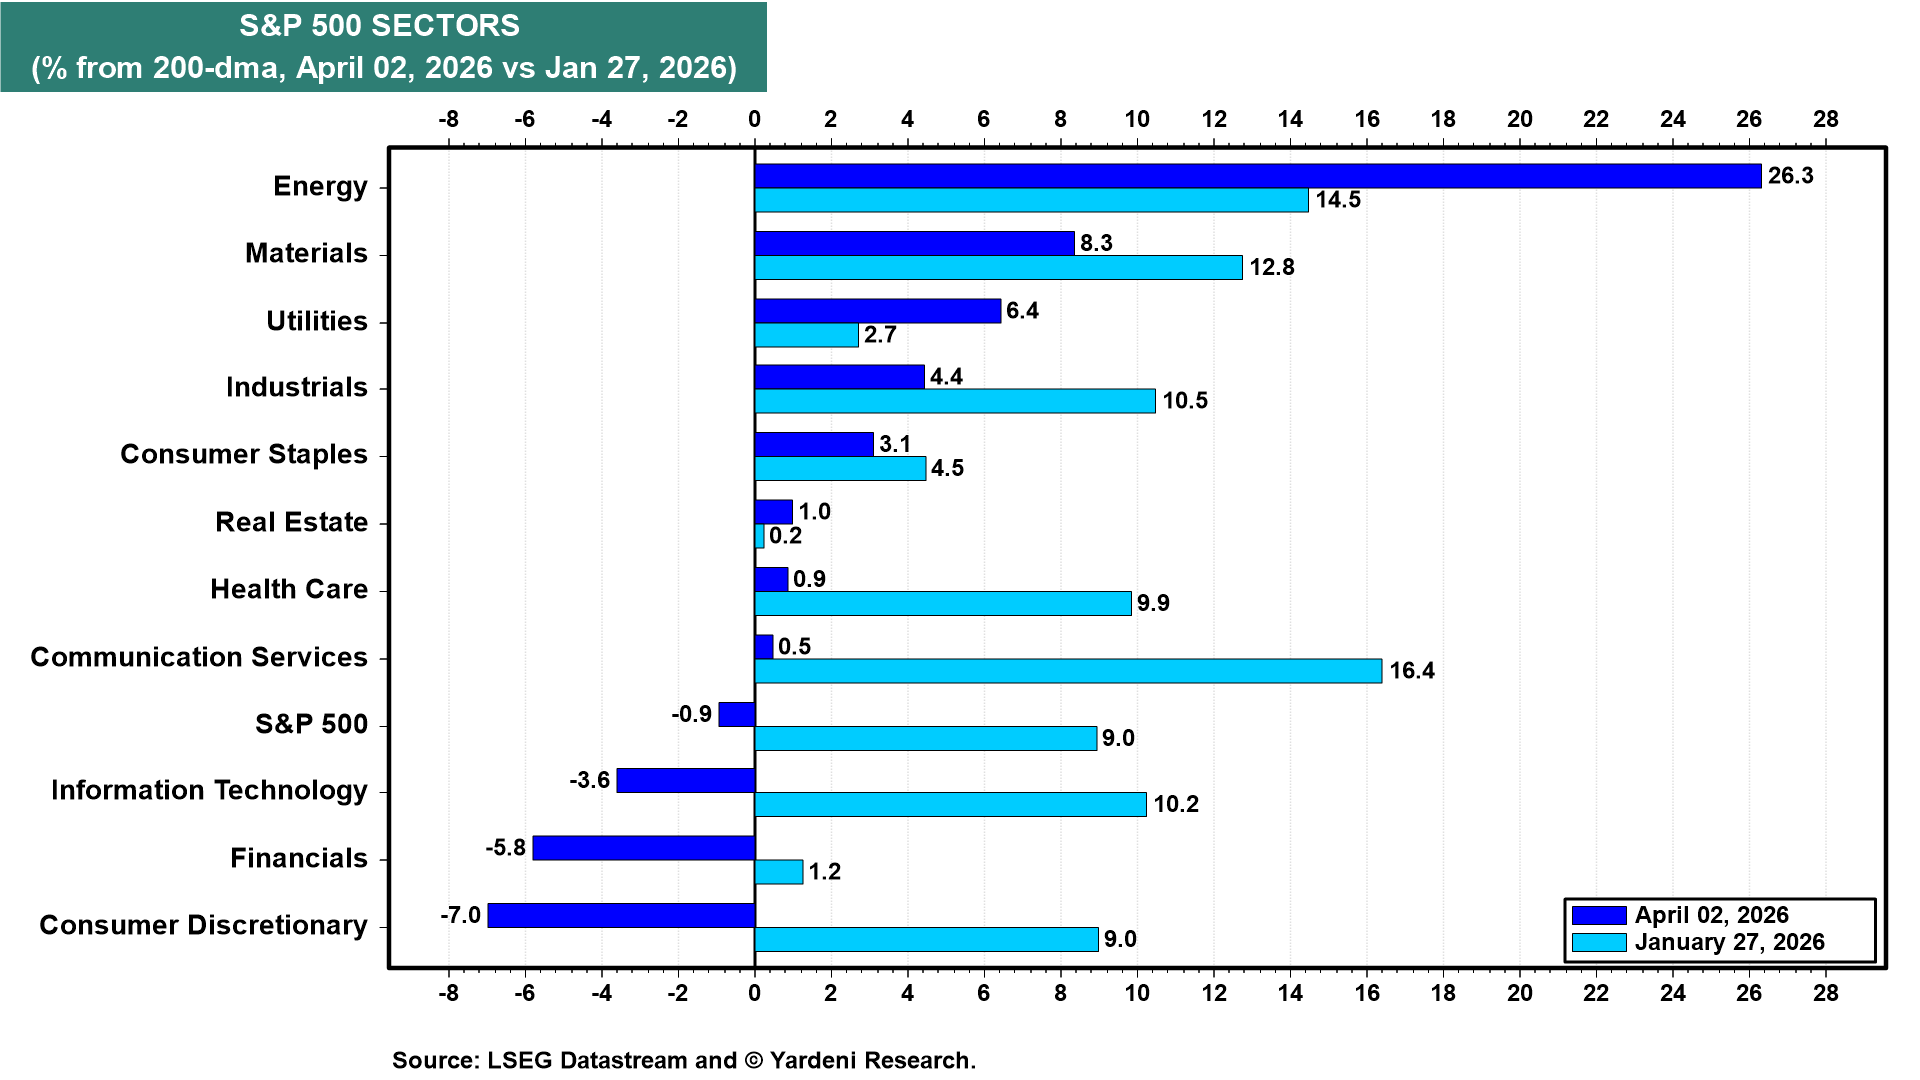
The S&P 500 was 9.0% overbought relative to its 200-dma on January 27, when the index rose to a record high (chart). It is now 0.9% below its average. More importantly, three of the largest sectors of the S&P 500 are selling well below their 200-dma: Consumer Discretionary (-7.0%), Financials (-5.8%), and Information Technology (-3.6%). These three have led the rebound from Monday's low and should continue to do so.