On Tuesday night, we suggested that the S&P 500 might have bottomed on Monday, with a pullback of 9.1% (i.e., just under a 10% correction) from its January 27 record high. Tuesday's strong equity rally was triggered by reports that the US had found an exit ramp from its war with Iran. Wednesday night, President Donald Trump confirmed that the US would exit in two to three weeks.
Stocks opened lower today as oil prices rose on fears that the US would exit the war without opening the Strait of Hormuz. Stocks then recovered during the day on reports that Iran and Oman are in the "final stages" of drafting a new joint protocol for the Strait of Hormuz. However, this is not an agreement to "open" the waterway in the traditional sense; rather, it is a move to formalize a new, restrictive navigation regime. Apparently, traders interpreted the "protocol" as a sign that a framework for managed transit is at least being discussed.
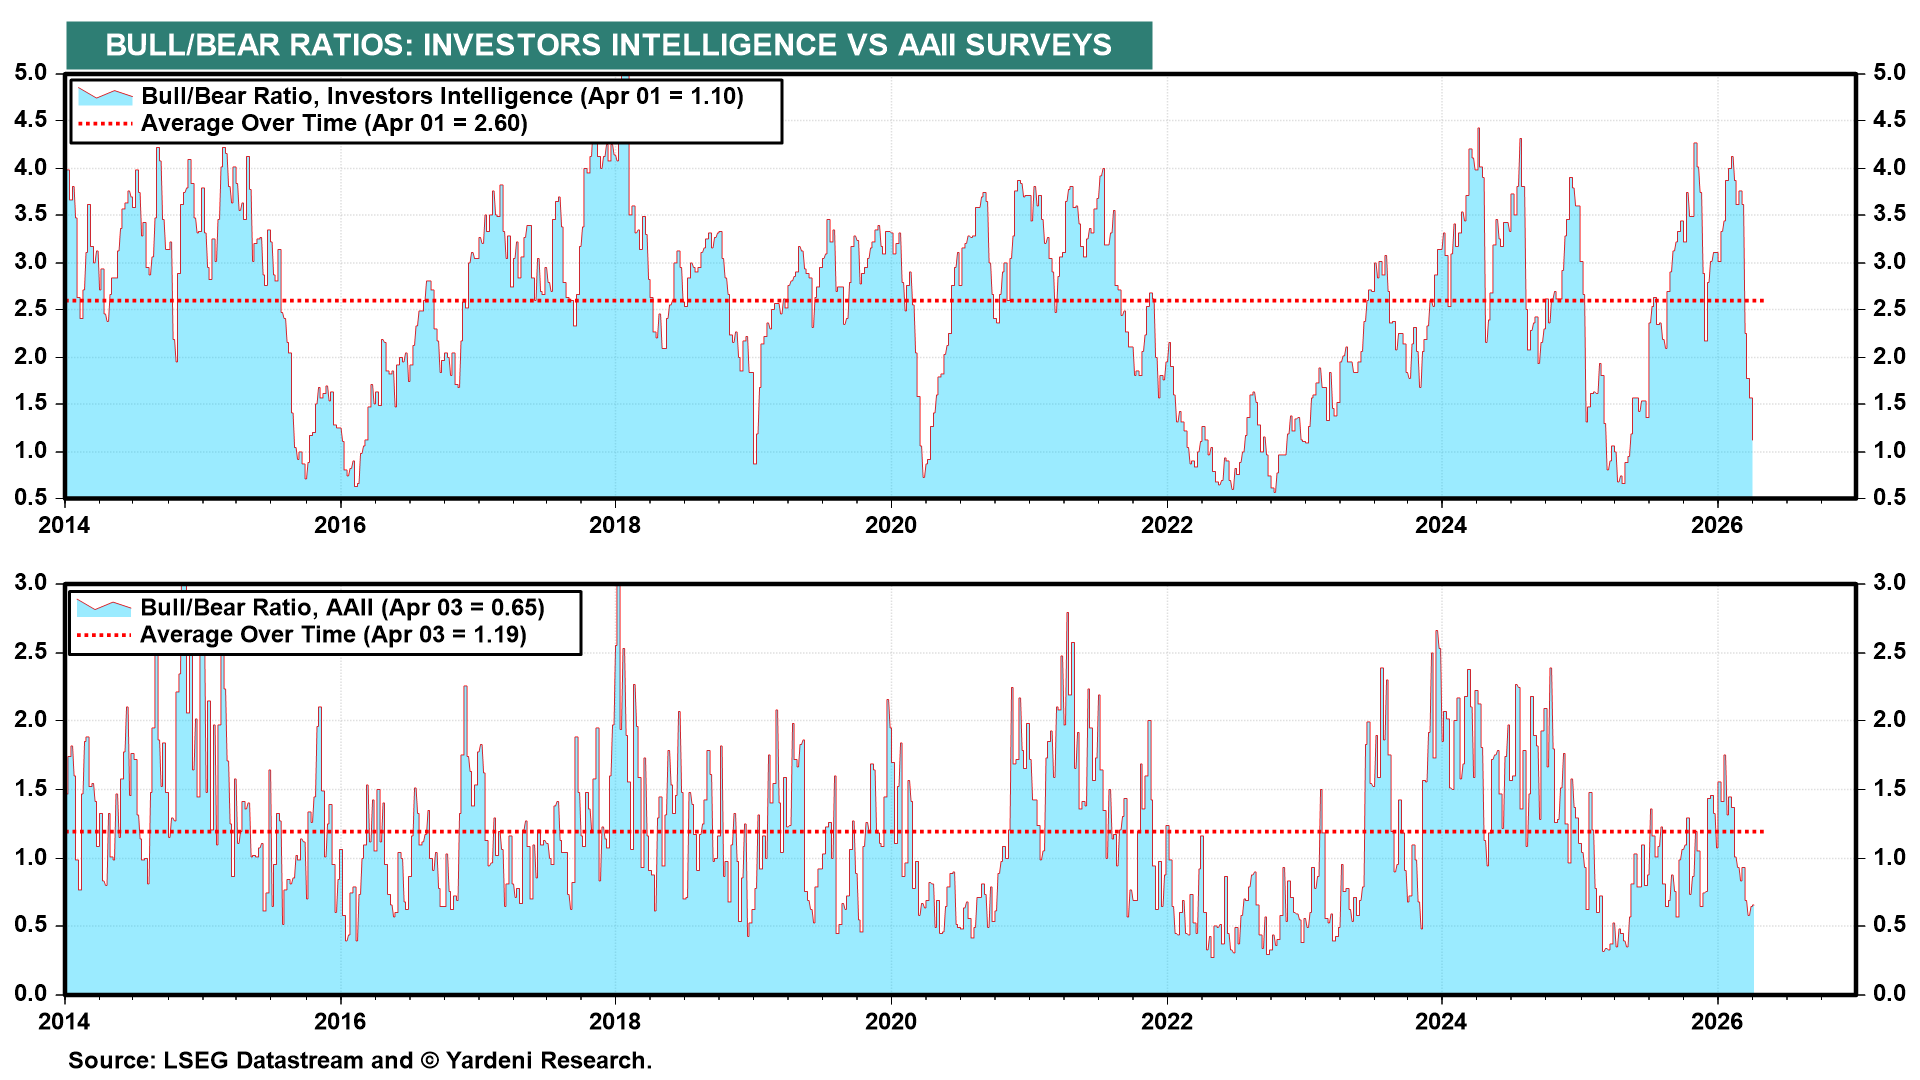
Our stock market bottom call is also based on the sharp declines in our two favorite sentiment indicators (chart). Their low readings tend to provide buy signals from a contrarian perspective. They worked like a charm last year when the market bottomed on April 8. In fact, in our April 7, 2025 QuickTakes titled, "Looking For A Stock Market Bottom In Fundamentals & Technicals," we wrote: "The latest reading of the AAII Bull/Bear Ratio, at 0.35, is as depressed as during previous bear markets. The same can be said about the Investors Intelligence Bull/Bear Ratio, which was 1.00 during the April 1 week. From a contrarian perspective, that's bullish."
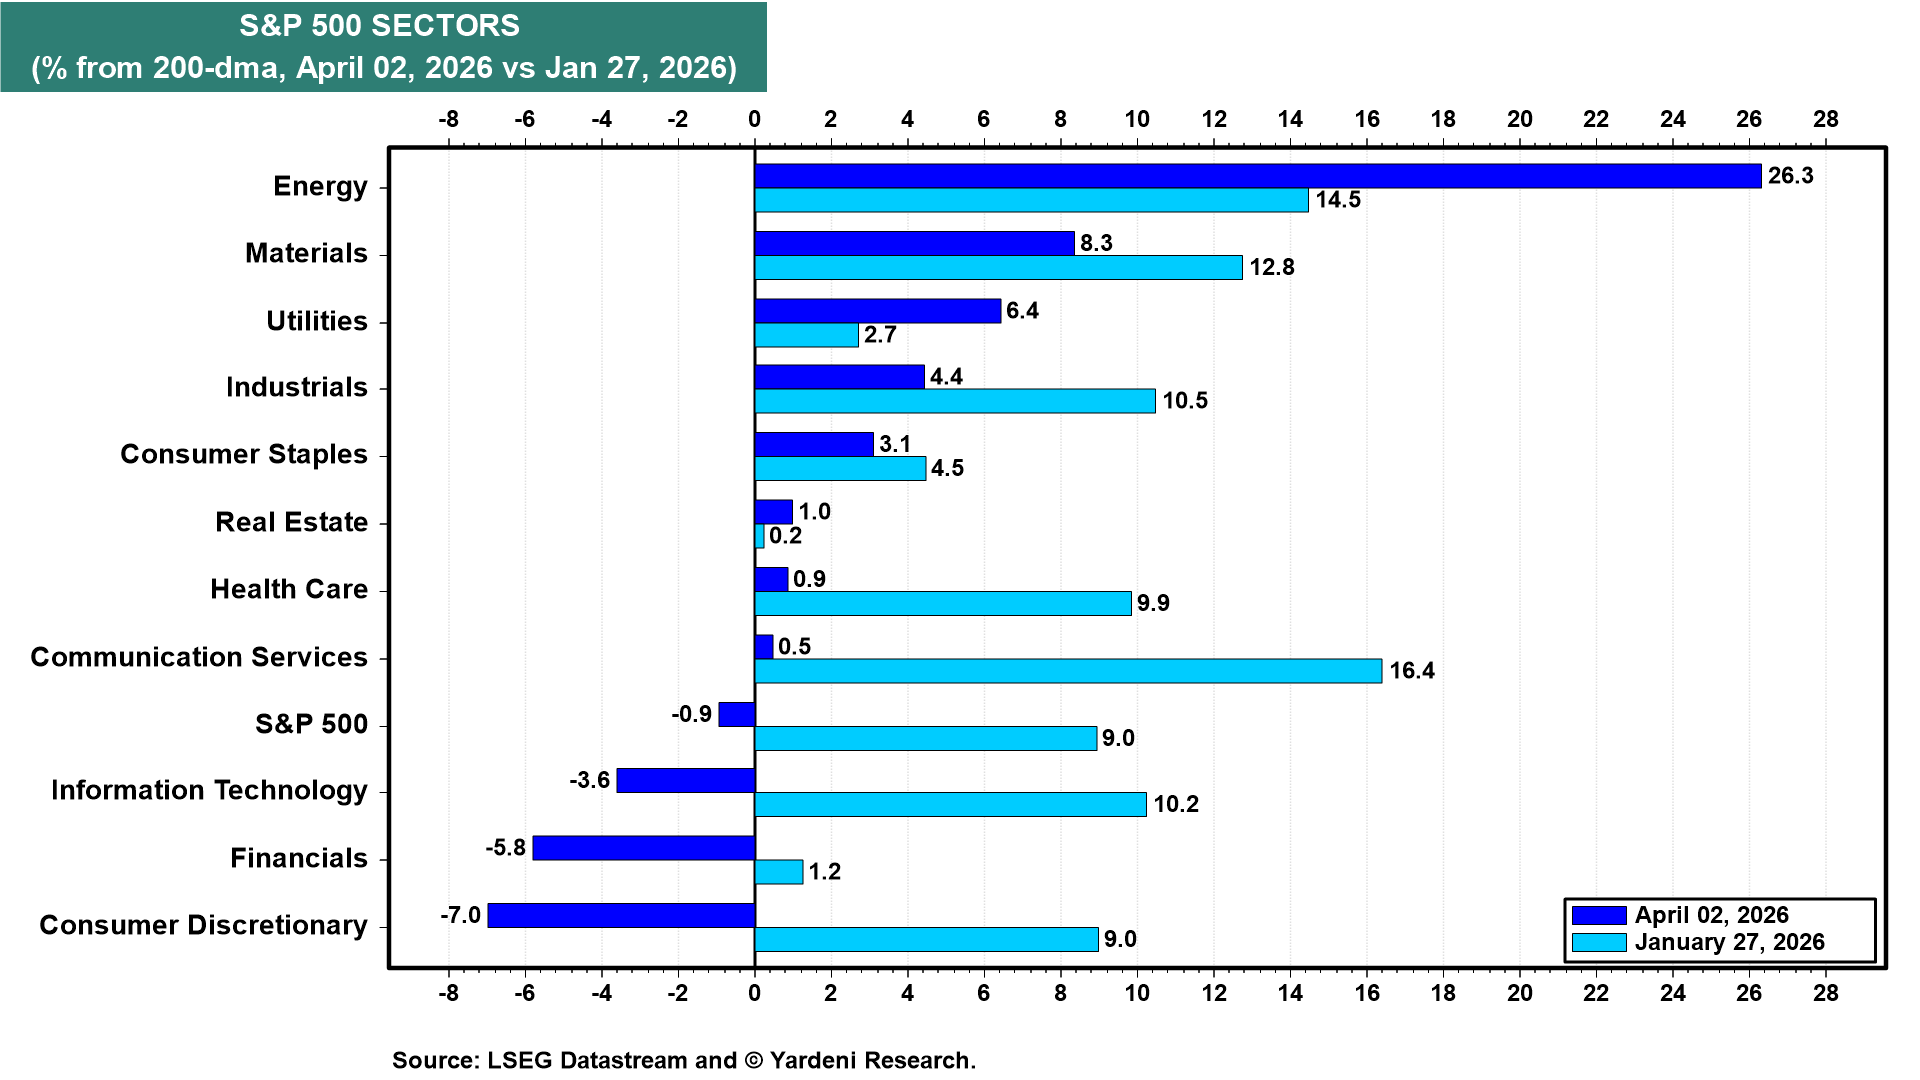
The S&P 500 was 9.0% overbought relative to its 200-dma on January 27, when the index rose to a record high (chart). It is now 0.9% below its average. More importantly, three of the largest sectors of the S&P 500 are selling well below their 200-dma: Consumer Discretionary (-7.0%), Financials (-5.8%), and Information Technology (-3.6%). These three have led the rebound from Monday's low and should continue to do so.
The Middle East conflict is the latest test of the US economy's resilience. If the war wraps up within the President's 2-3-week timeline, the economy should pass its latest test.
Consider the recent batch of upbeat economic data:
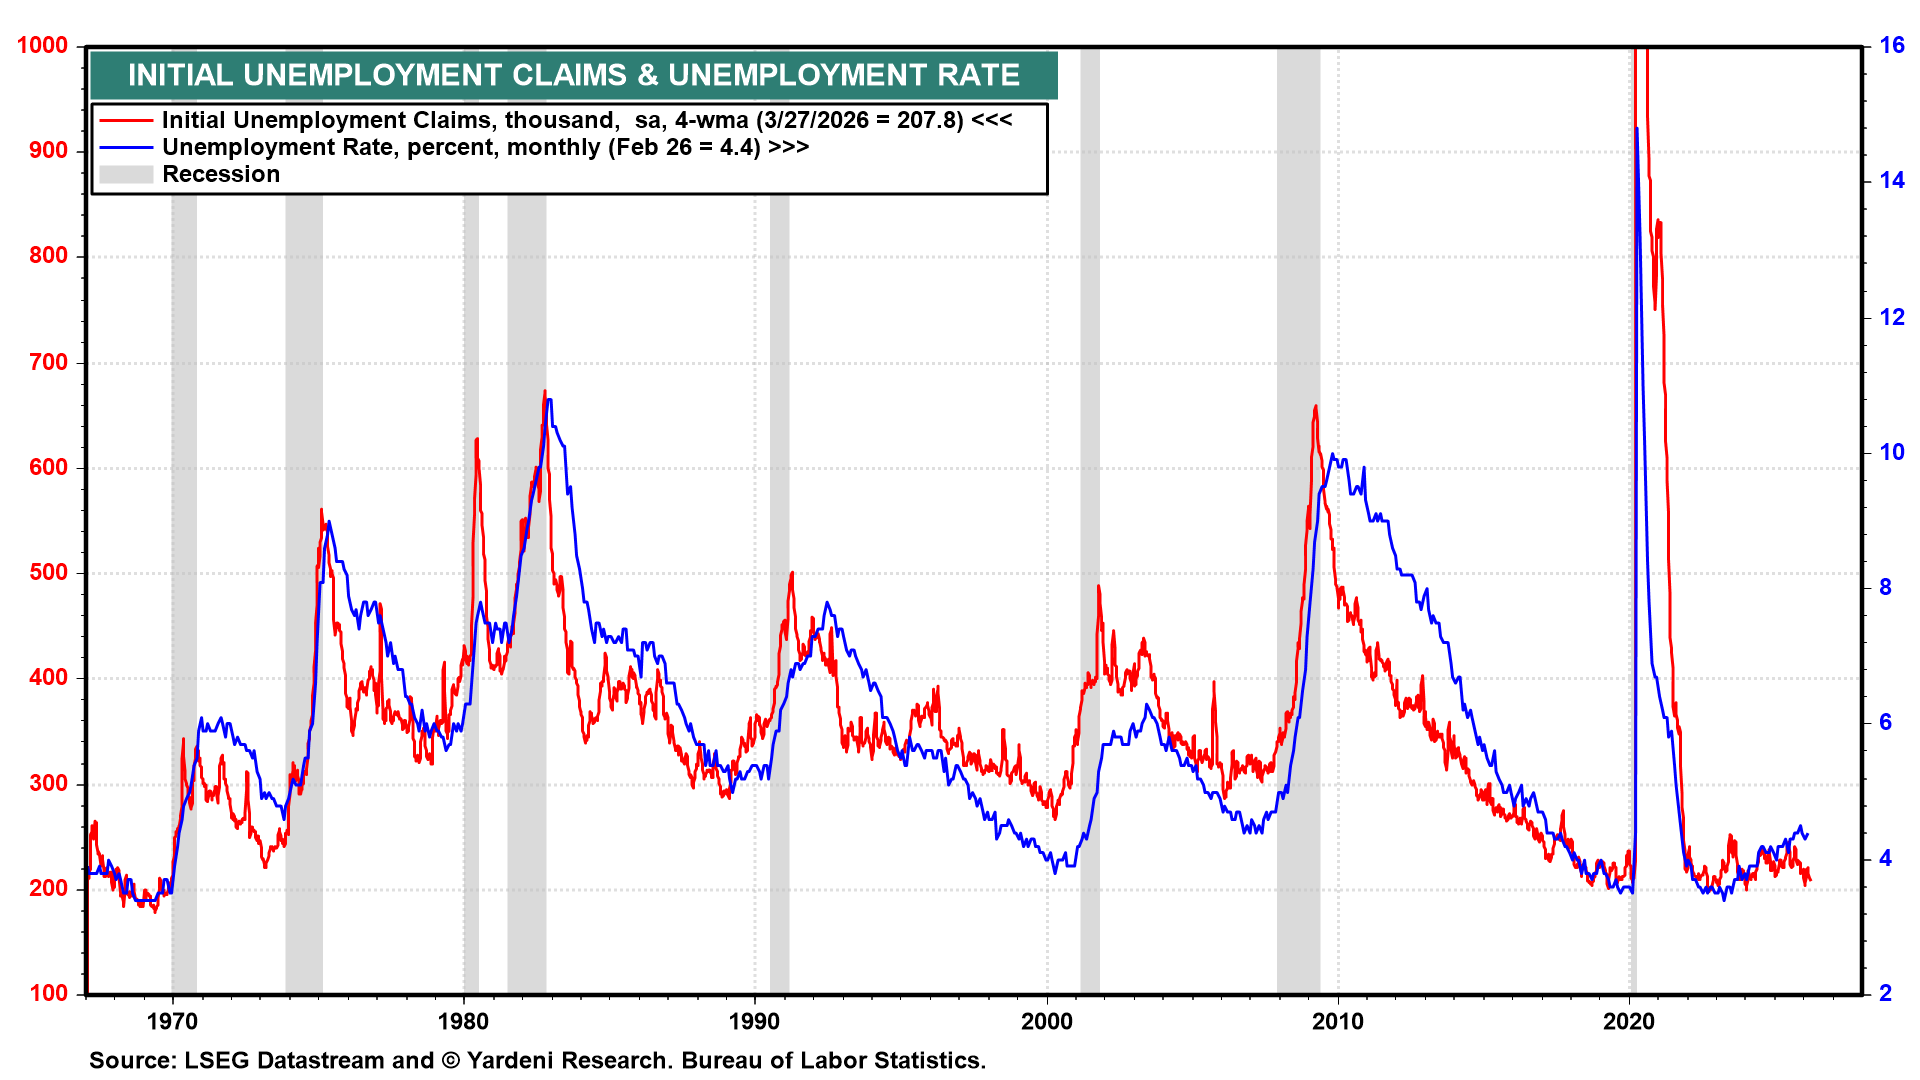
(1) Initial unemployment claims dropped last week to 202,000, confirming that layoff activity remains at historically low levels (chart). The four-week moving average fell to its lowest reading since the start of the year. Continuing claims edged higher, but the four-week moving average declined to the lowest since September 2024.
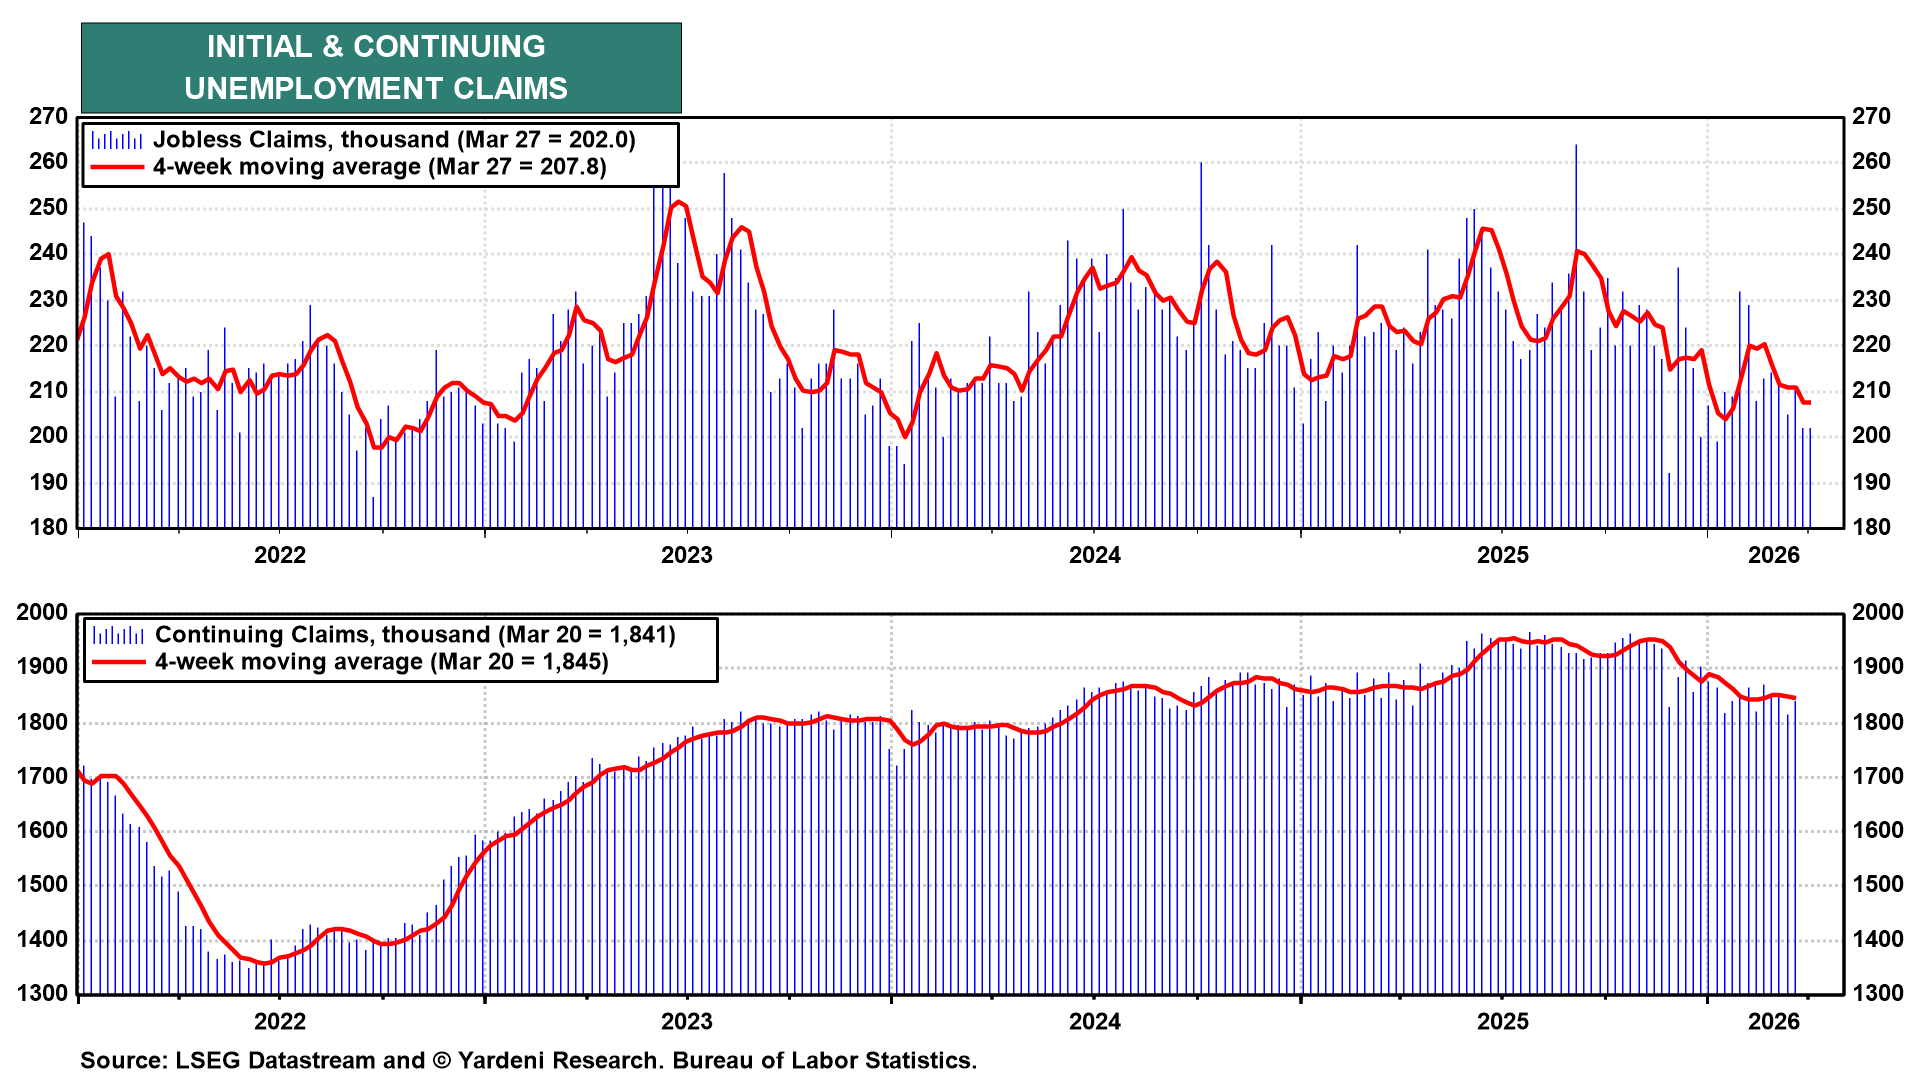
The 4-week moving average of jobless claims suggests that the unemployment rate might have dropped during March from February's 4.4% (chart).
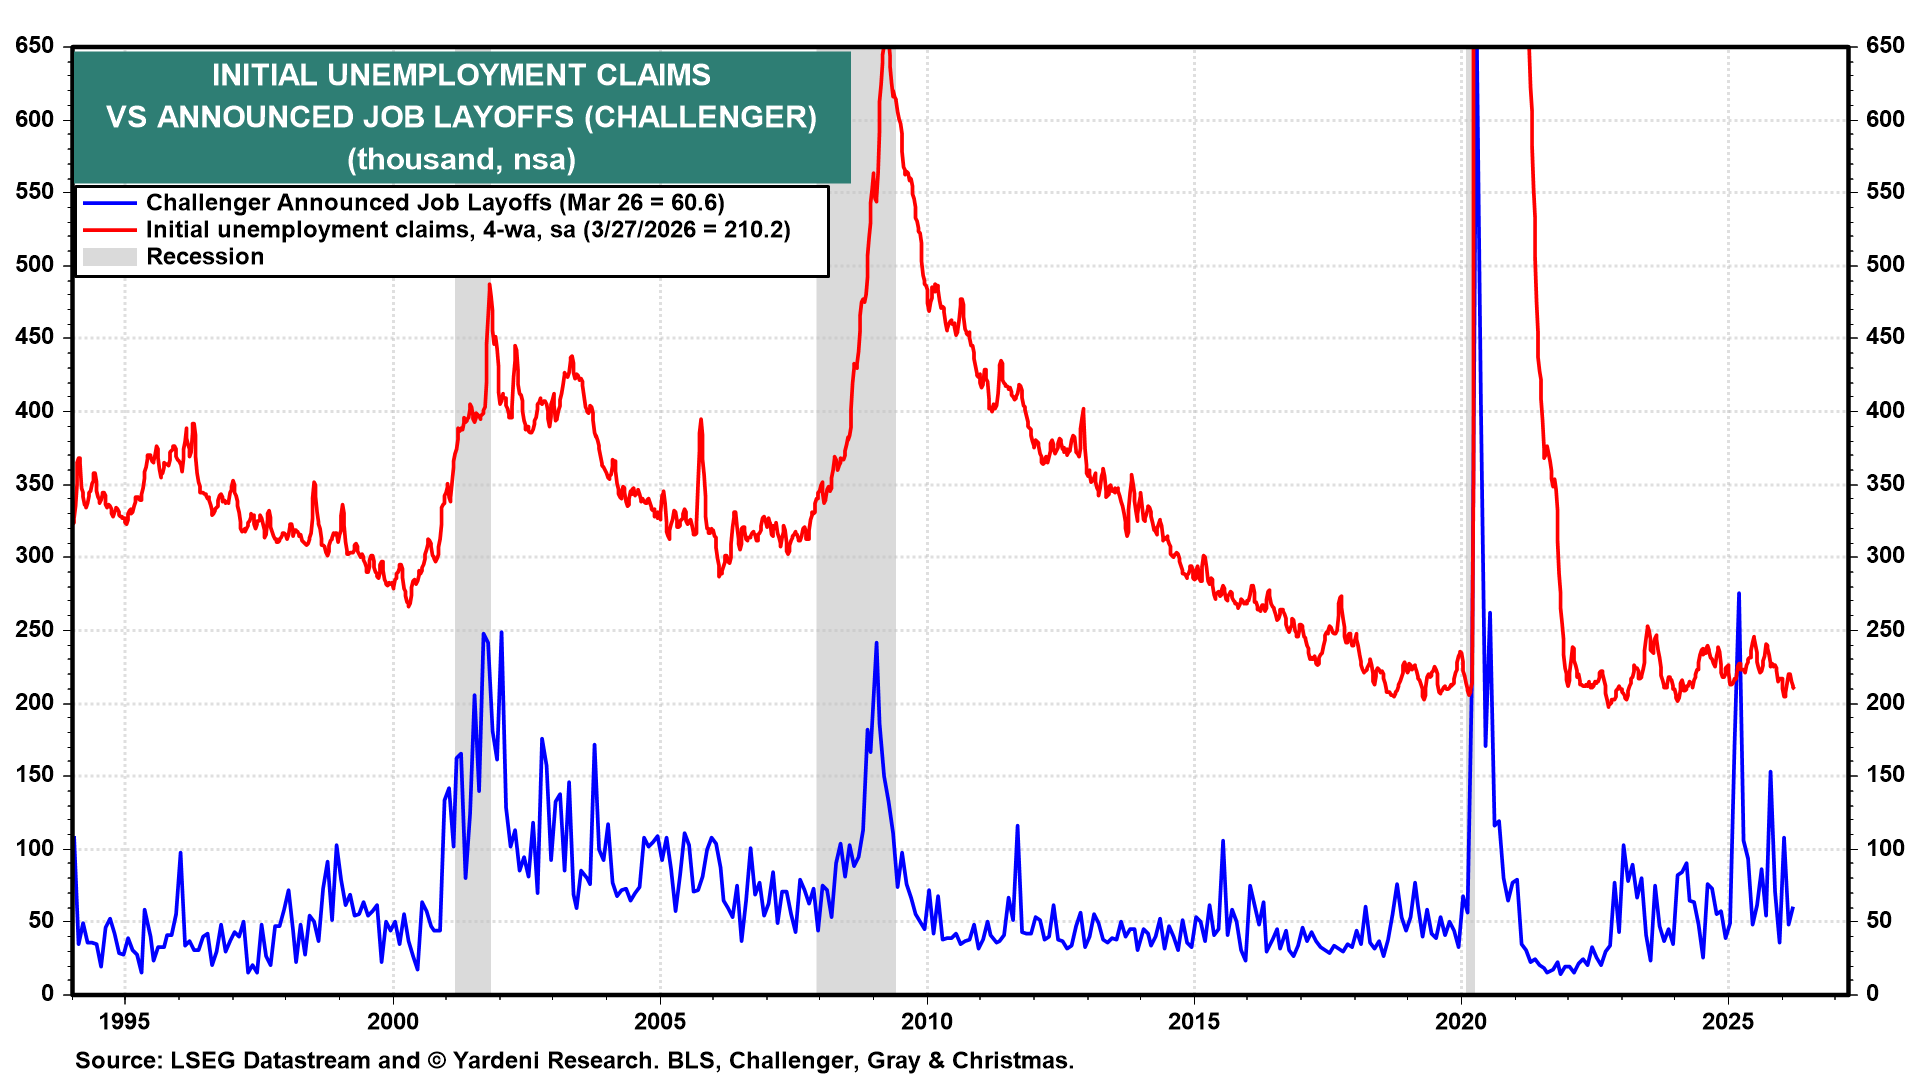
(2) According to the Challenger layoffs report, US employers announced 60,620 planned job cuts in March, up from 48,307 in February but down a striking 78% from the 275,240 recorded a year ago (chart). Of the announced planned cuts, 25% cited artificial intelligence as the reason, up sharply from just 7% in January.
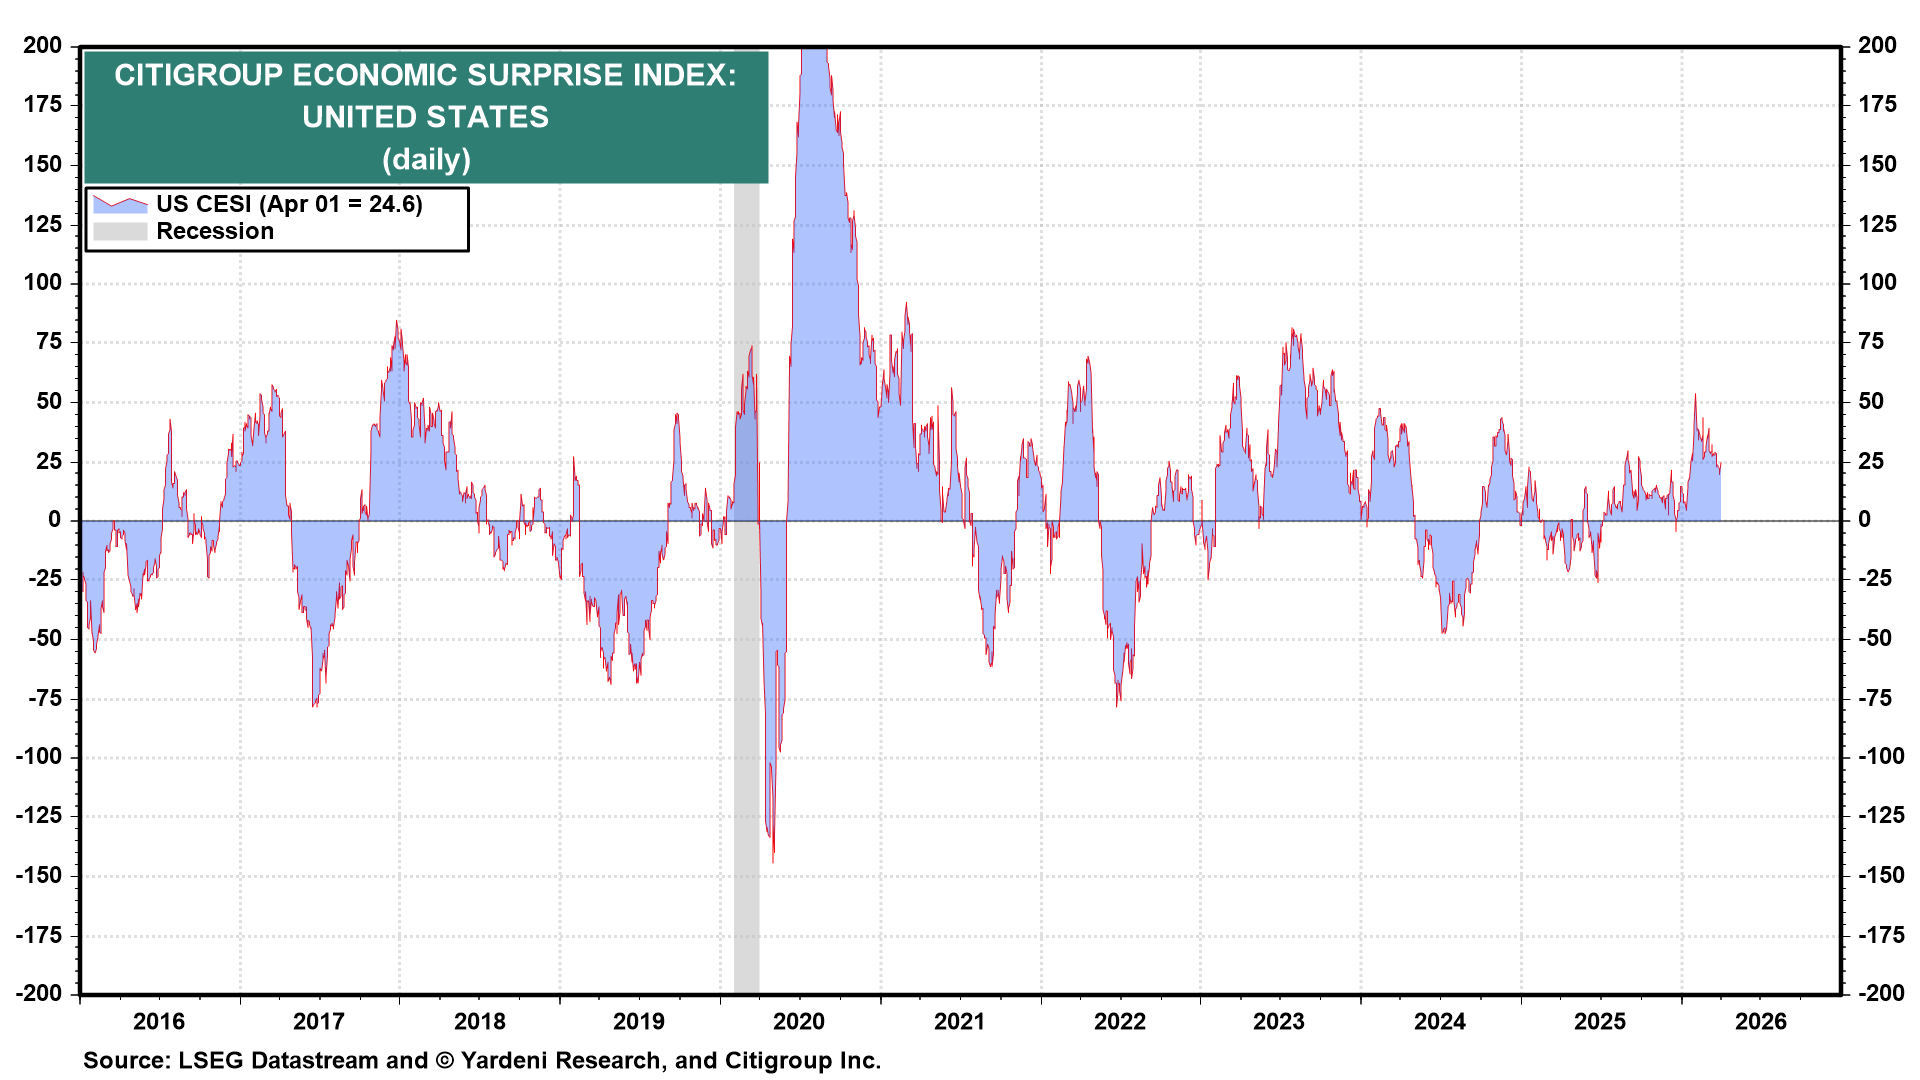
(3) The recent streak of better-than-expected economic indicators has pushed the Citigroup Economic Surprise Index into solidly positive territory since the start of this year. Economic activity was strengthening, not weakening, when the war began.
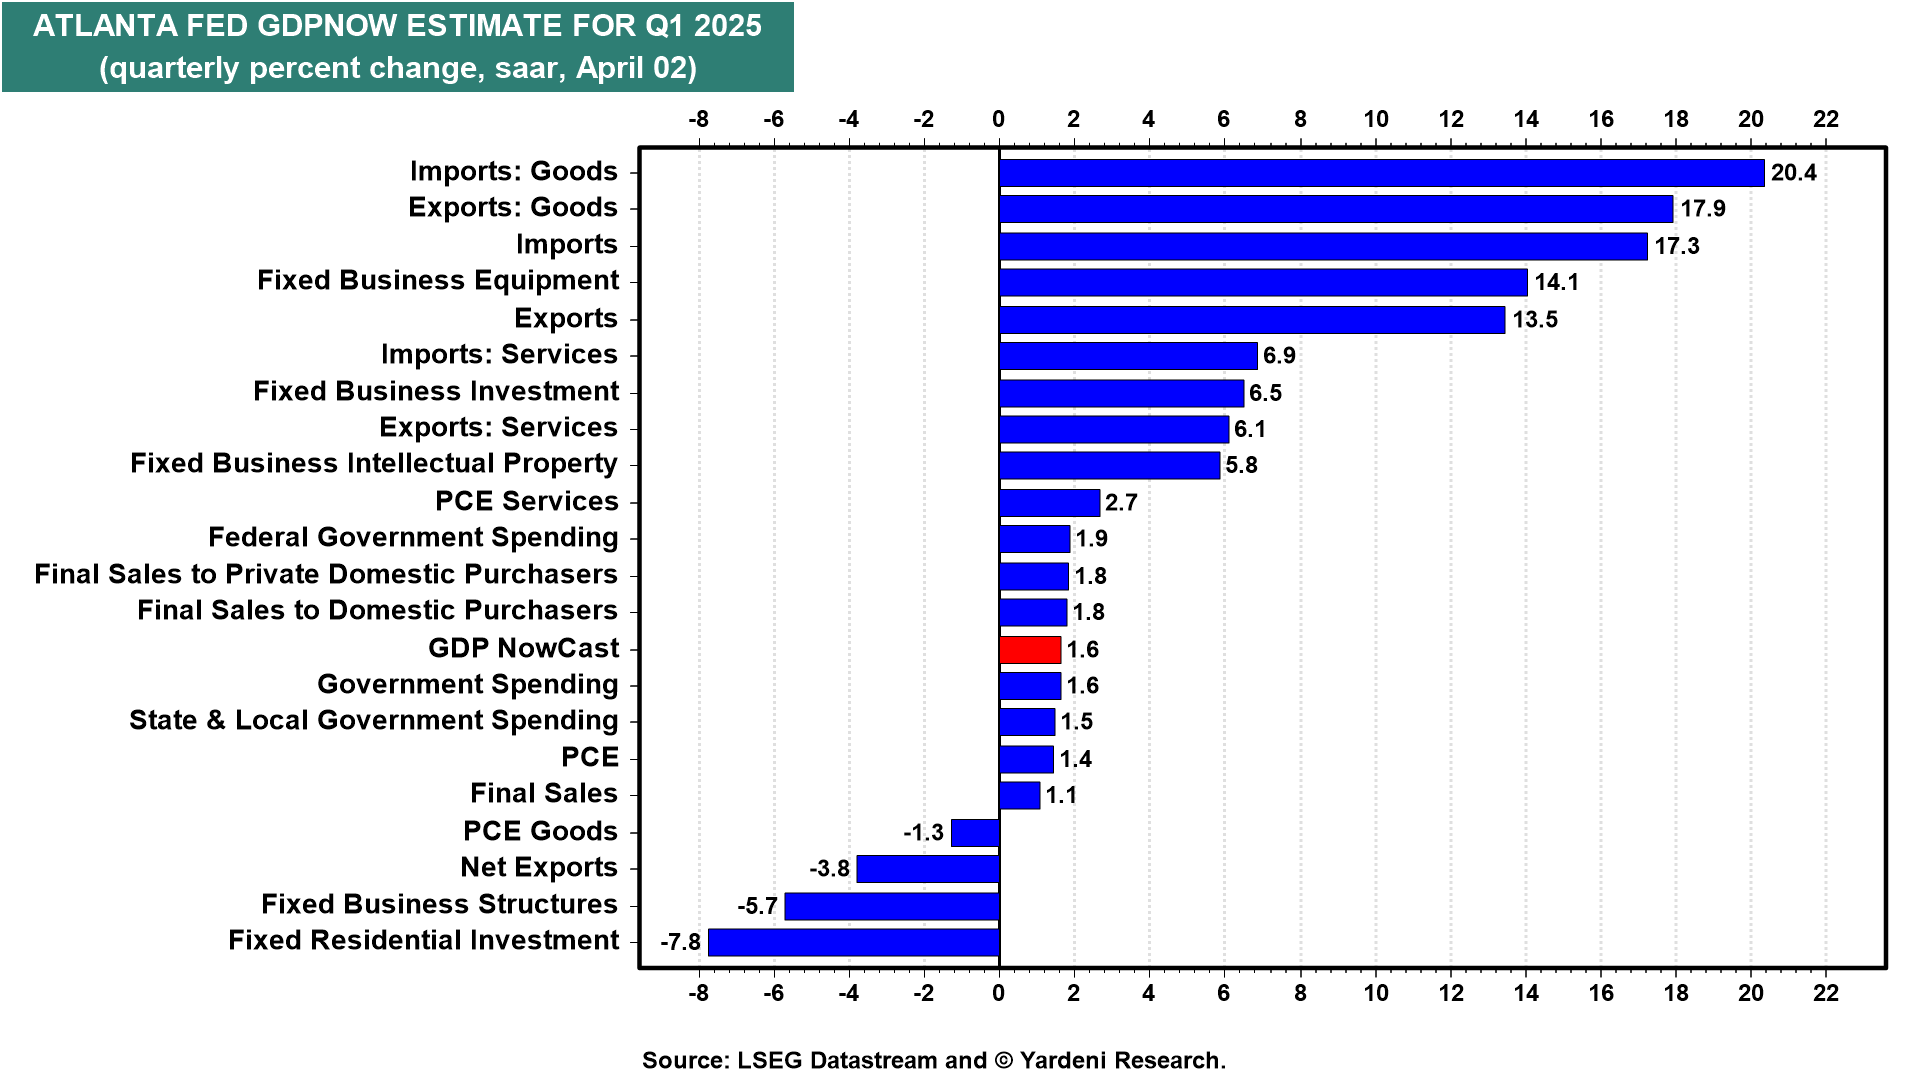
(4) But what about the Atlanta Fed's latest downward revision in Q1's real GDP growth rate to only 1.6% (chart)? We blame it on the weather. February 2026 was arguably the worst February we’ve seen in at least a decade.