Why is the stock market continuing to make new highs? It's doing so because corporate earnings are doing the same, as the economy continues to speed along without stopping for a recession. The latest batch of data certainly drove the stock market higher today, confirming that we are still riding the rails on the Roaring 2020s Express. Nothing seems to stop or derail this train.
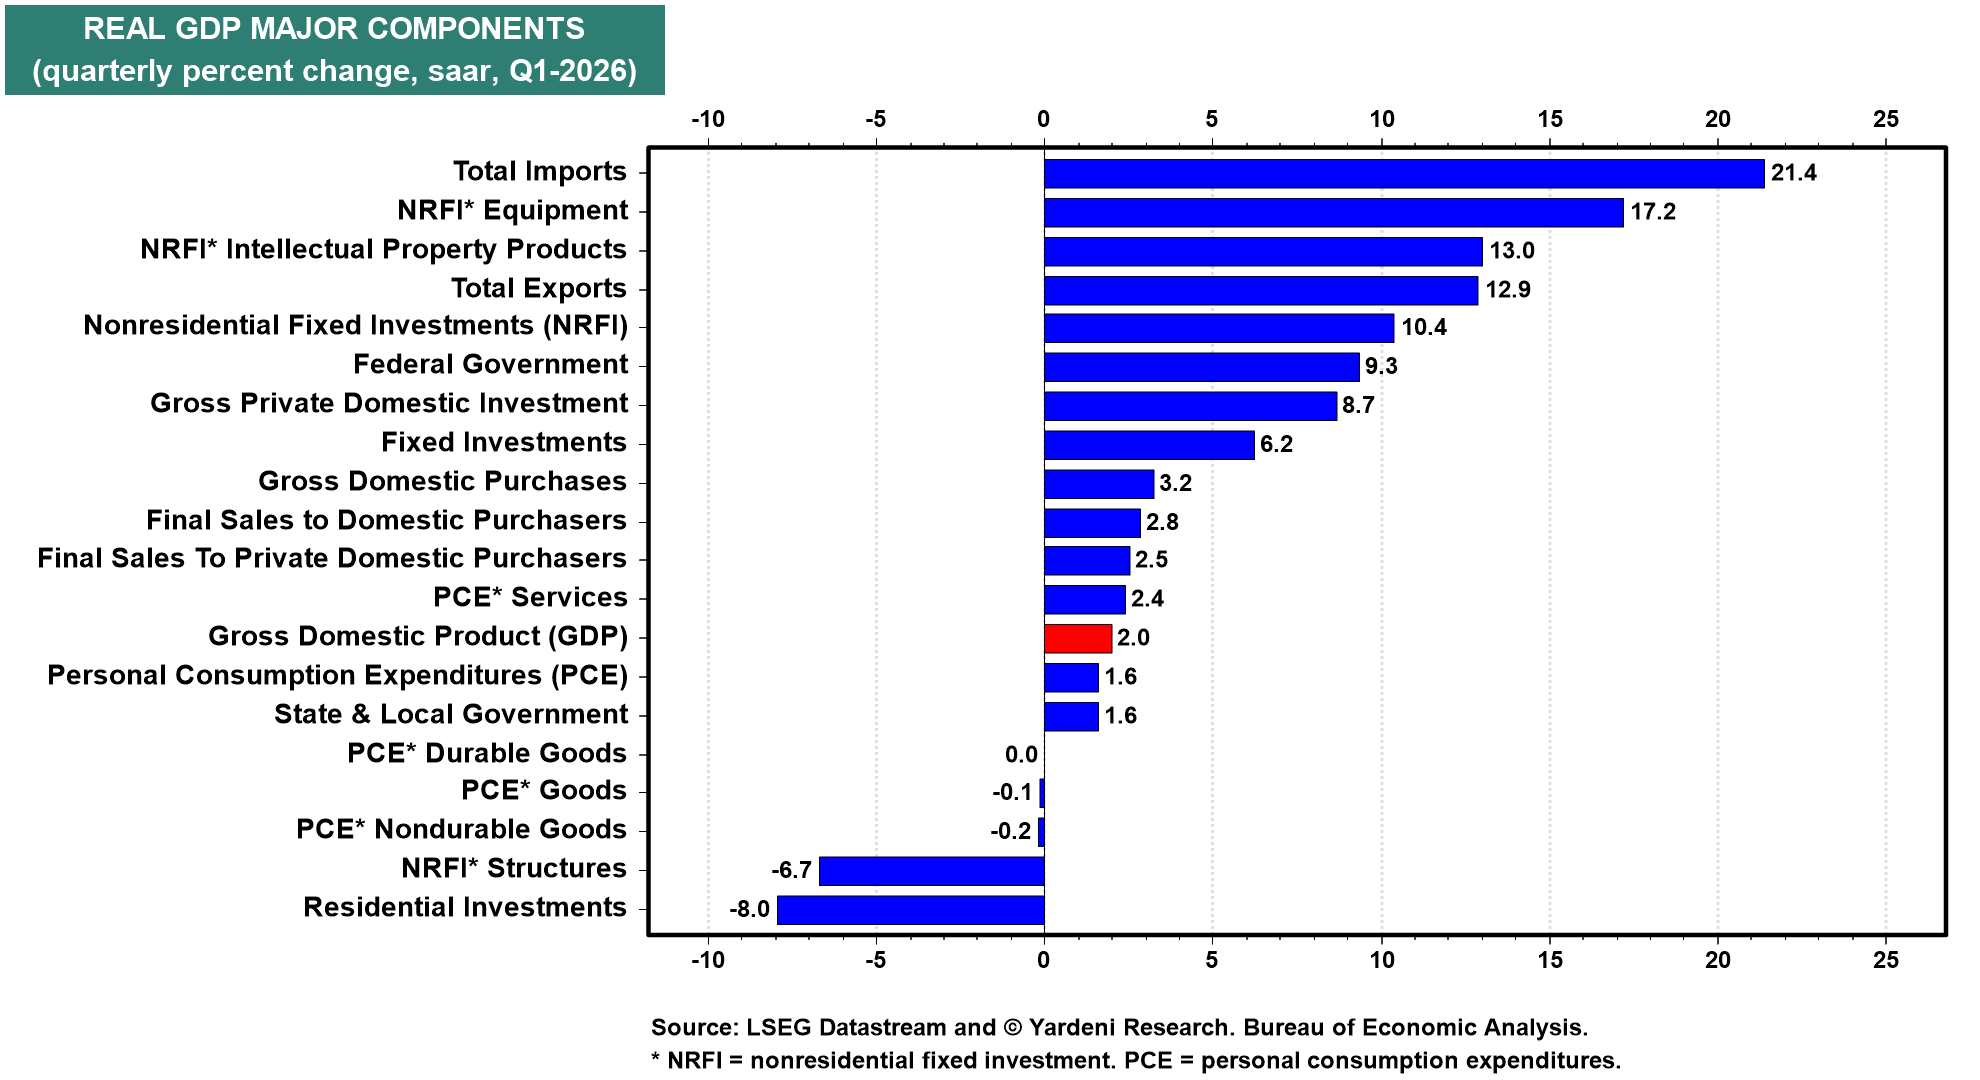
(1) GDP. The US economy grew at an inflation-adjusted annual rate of 2.0% in Q1 (chart). Final sales to private domestic purchasers, the cleanest read on underlying demand, came in at a solid 2.5%. Business investment surged at its fastest pace in nearly three years, driven by spending on AI-related equipment and software. Exports jumped sharply. Consumer spending was up only 1.6%, probably because the weather was very bad during January and February. It should grow faster in Q2. The big drag was imports.
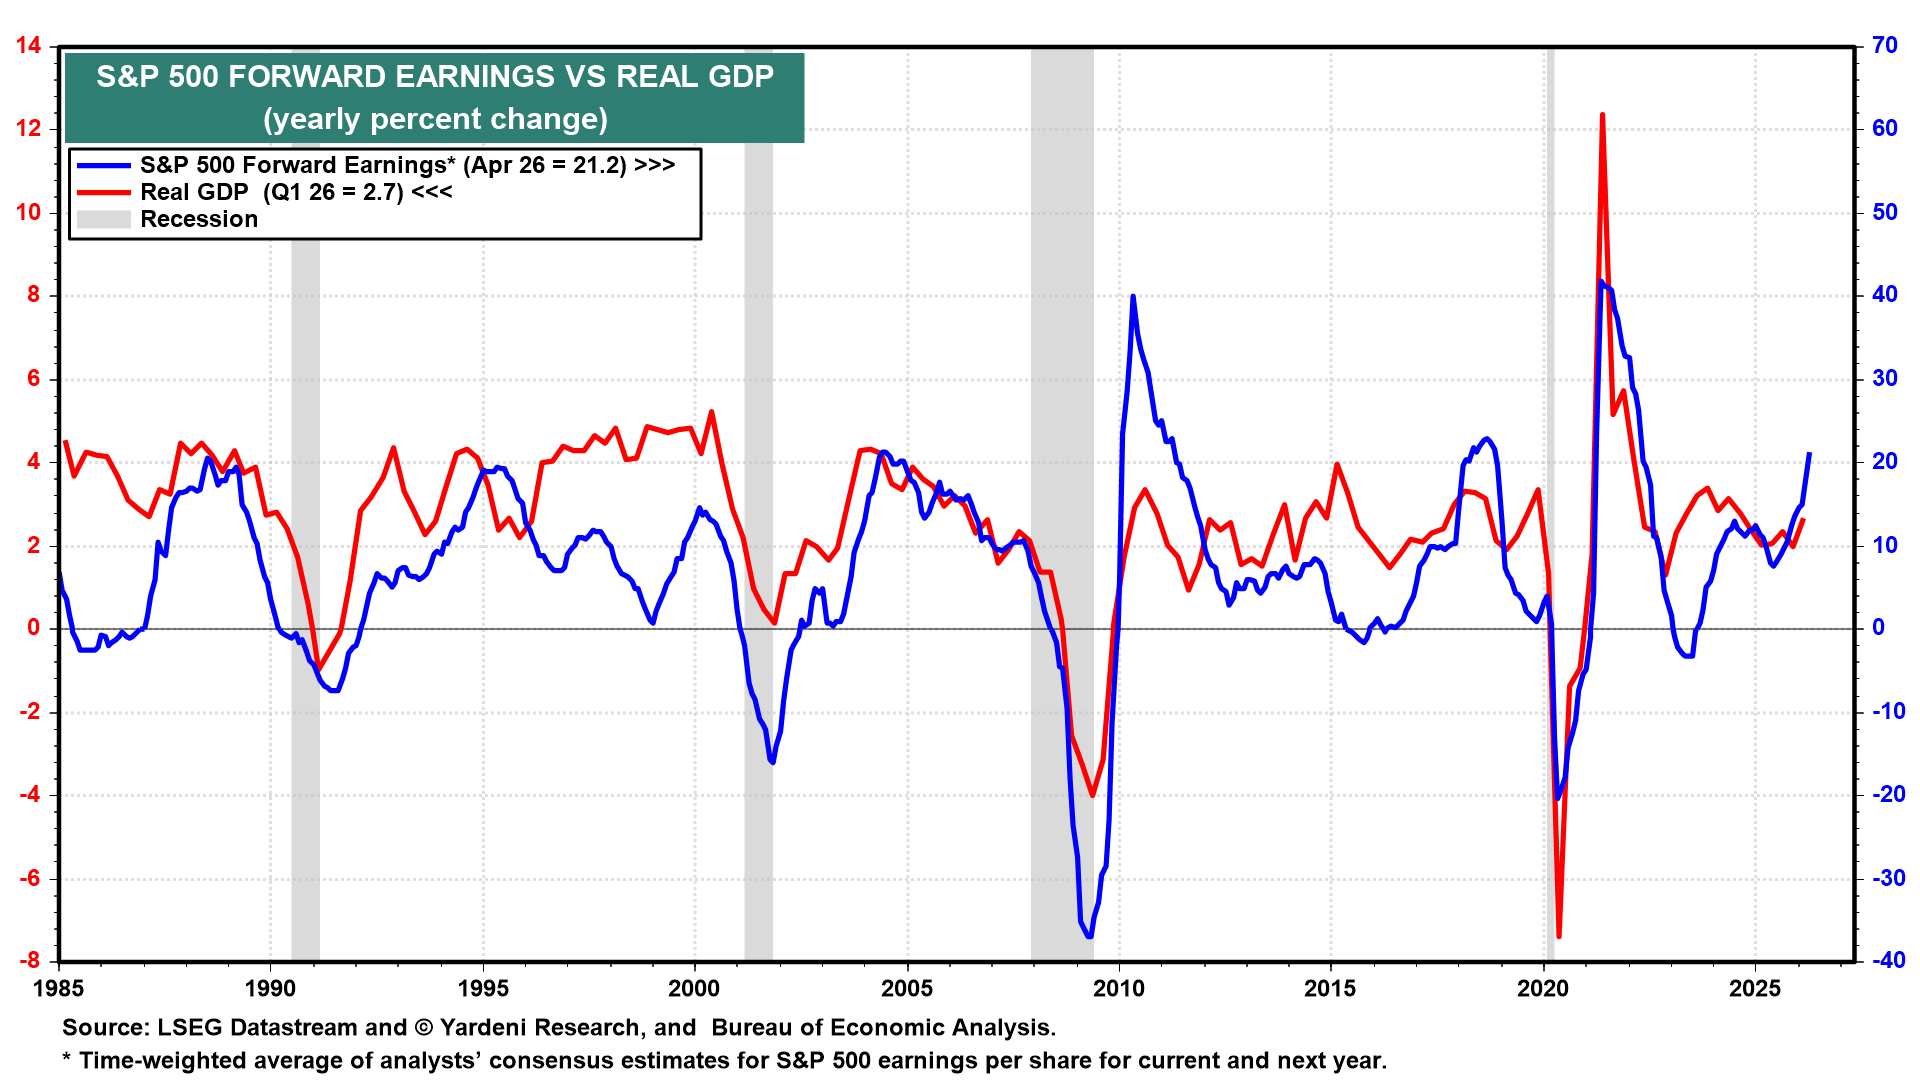
Our homemade real GDP growth model suggests that the pace of economic activity picked up in March and April, along with the growth rate of S&P 500 forward earnings (chart).
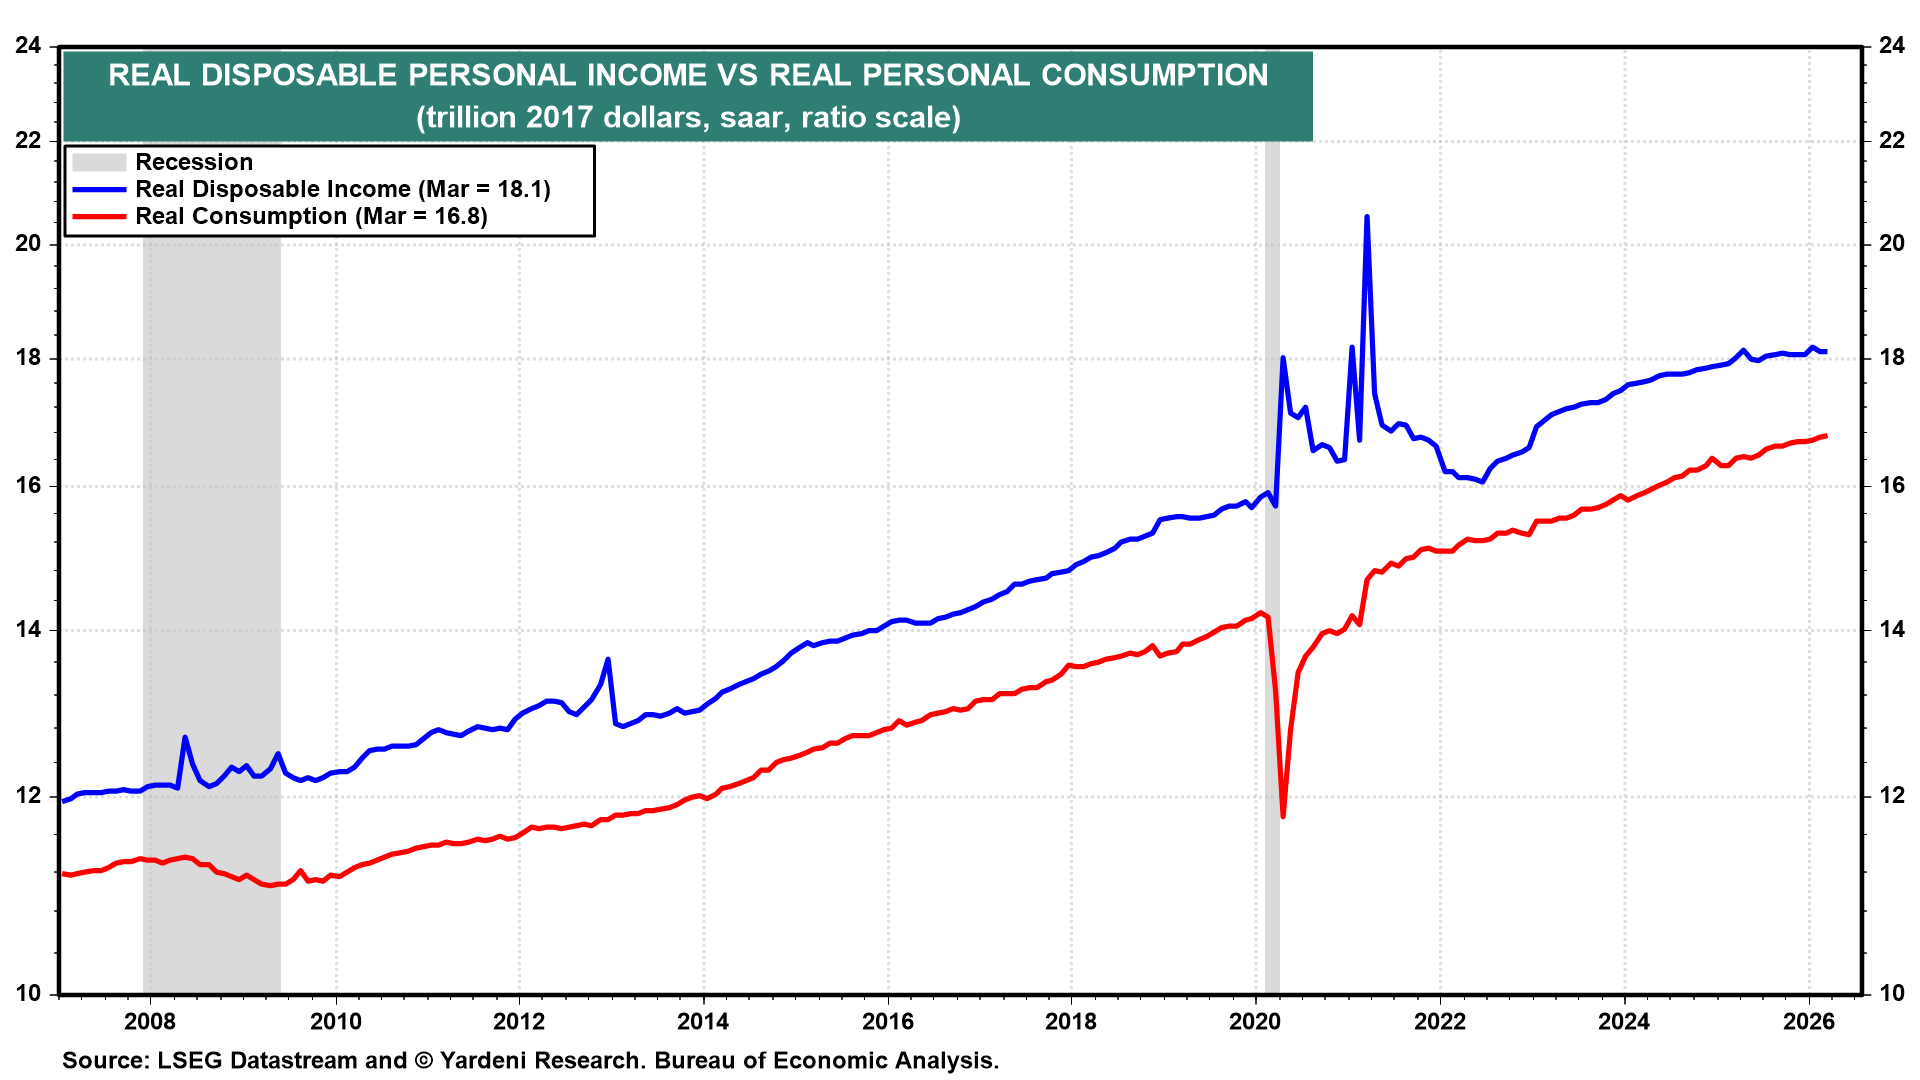
(2) Consumer Spending. Real disposable personal income (DPI) dipped slightly in March as the energy price surge eroded nominal income gains (chart). Real DPI has been relatively flat over the past year. Yet inflation-adjusted consumer spending is still growing. We attribute this development to the retirement of Baby Boomers.
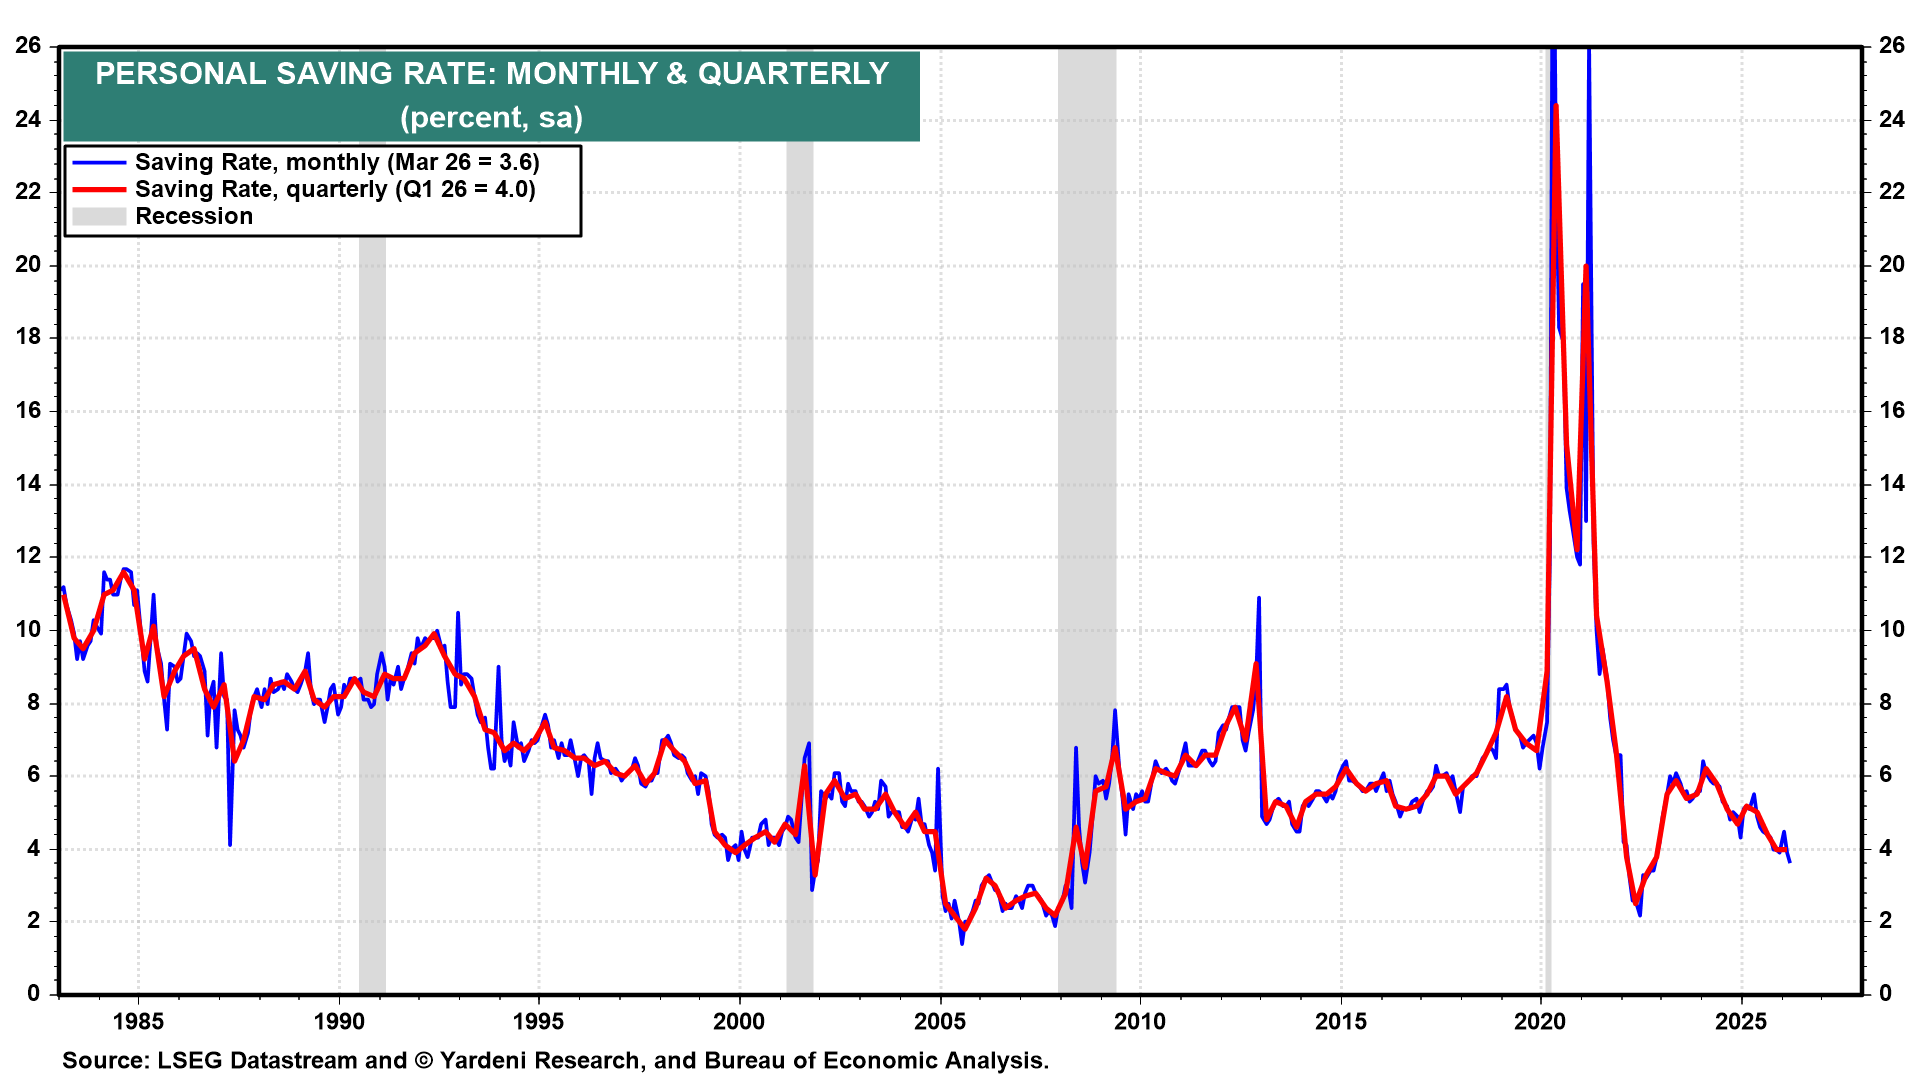
Because spending growth outpaced income growth in March, the saving rate fell to its lowest level since October 2022 (chart). Retired Baby Boomers are dipping into their record-setting retirement savings now that they are no longer receiving labor income.
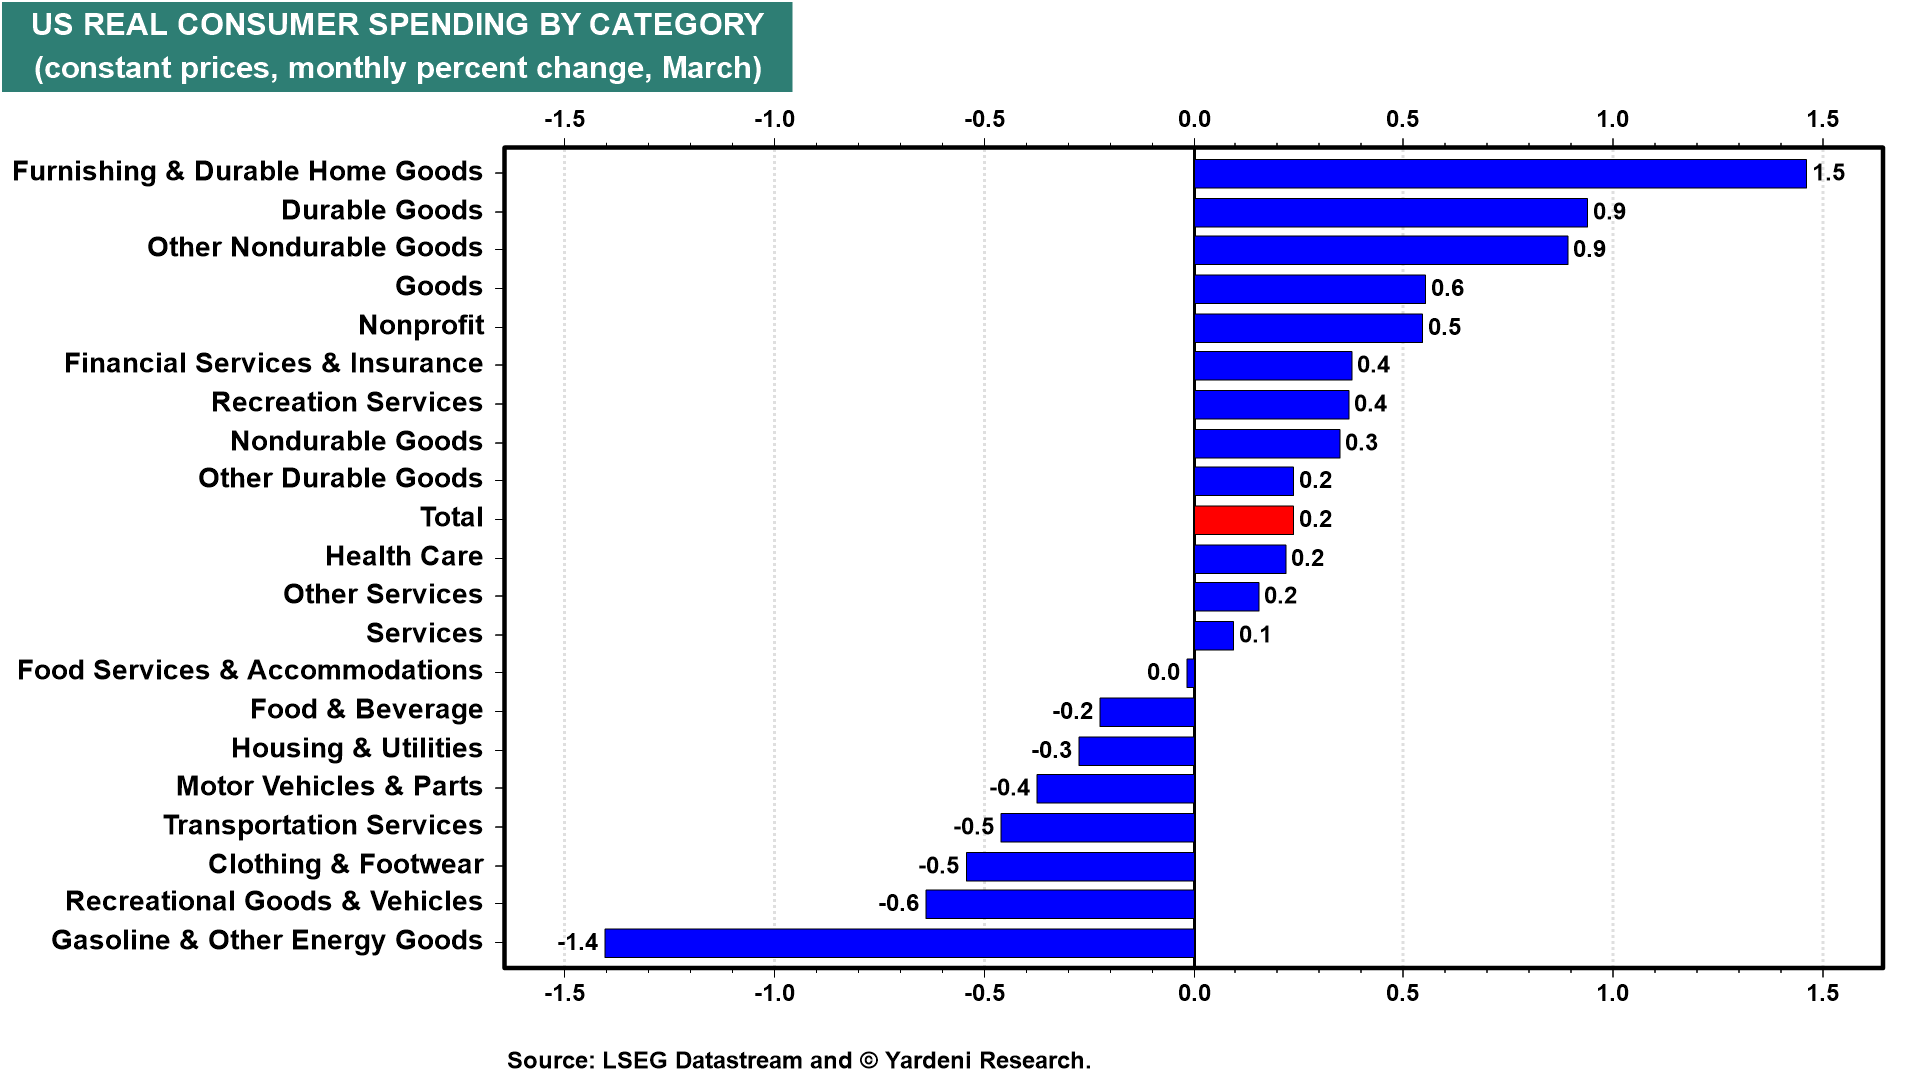
The details of real consumer spending in March reveal that goods spending led broadly while services stalled. Energy was the steepest decliner, consistent with higher gasoline prices weighing on demand.
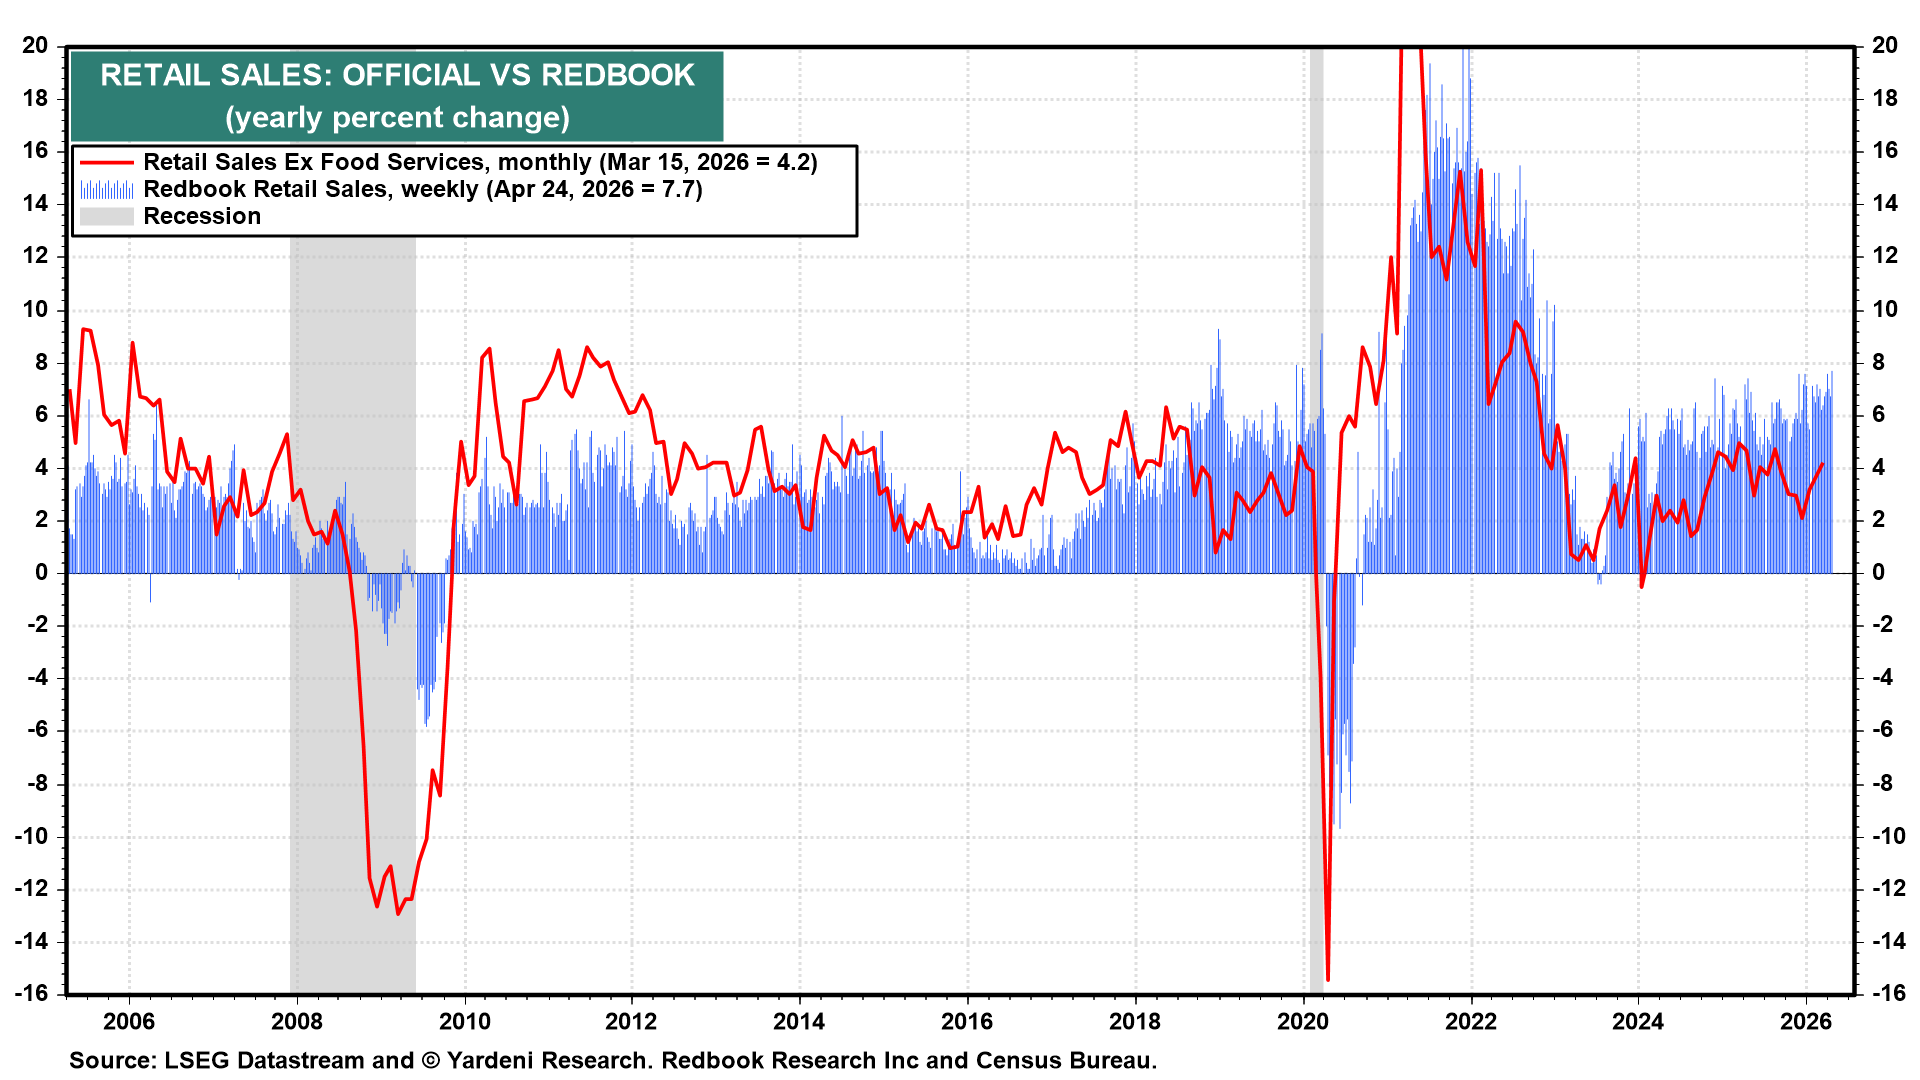
The Redbook Retail Sales Index shows that such spending continued to grow at a solid pace in April (chart).
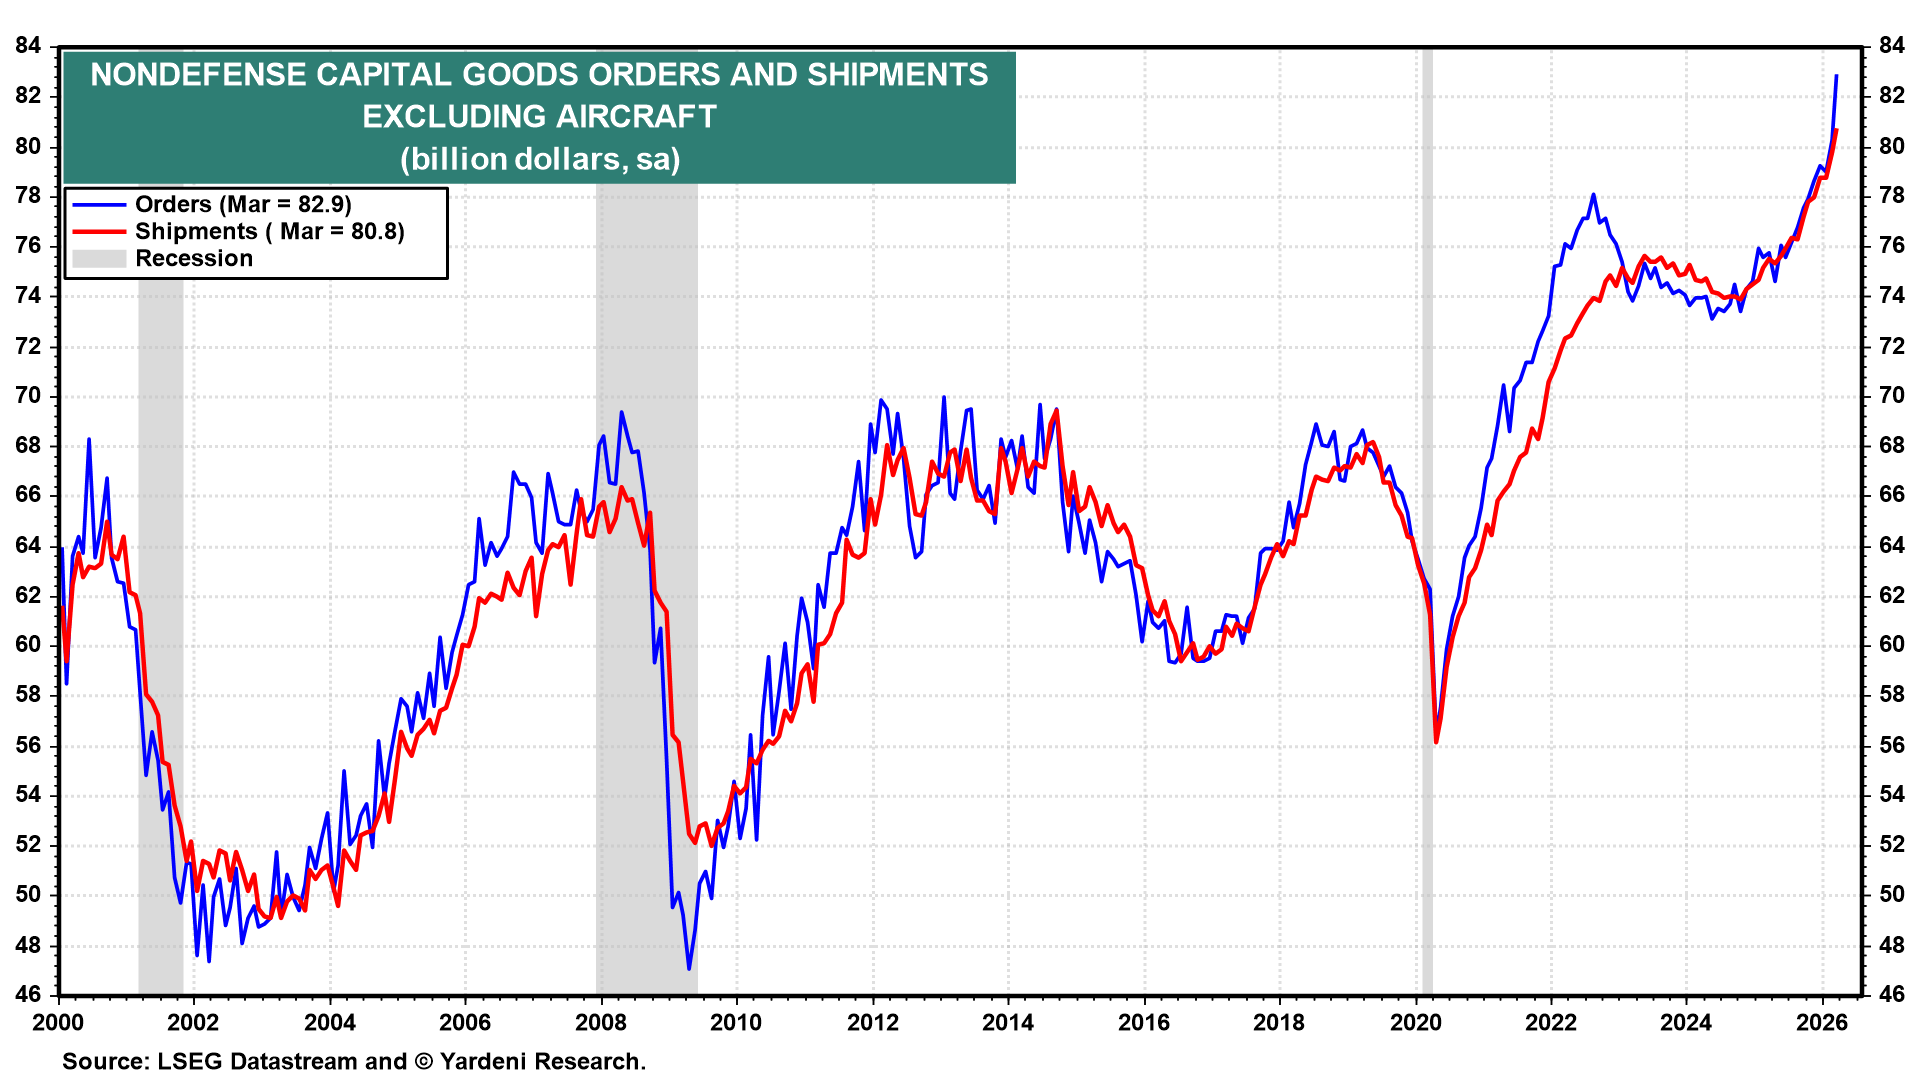
(3) Capital Spending. Capital spending indicators are red hot. Nondefense capital goods orders and shipments excluding aircraft hit fresh record highs in March, with both series in a strong uptrend since 2024 (chart).
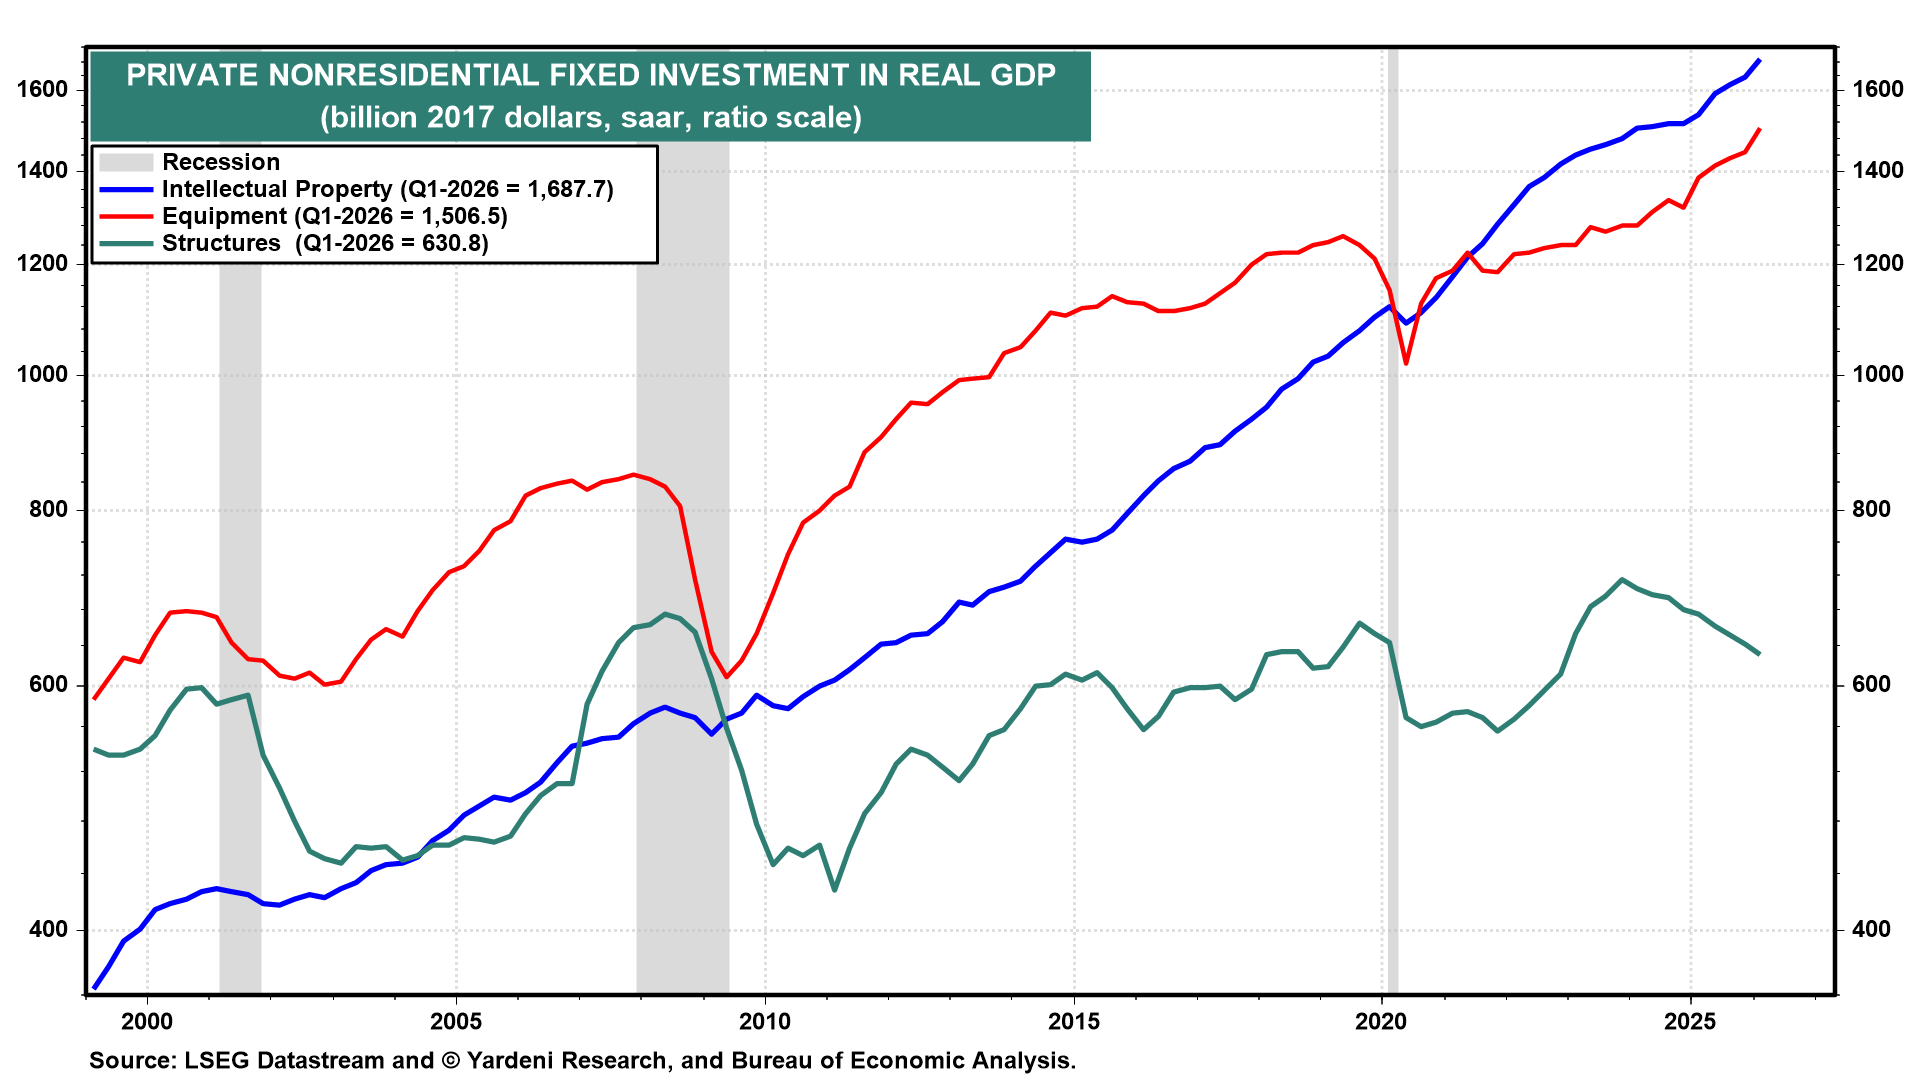
Intellectual property (including software) and business equipment investment (including semiconductors and servers) both hit record highs in Q1-2026. They have been on strong uptrends since 2020, while structures continue to lag meaningfully behind (chart).
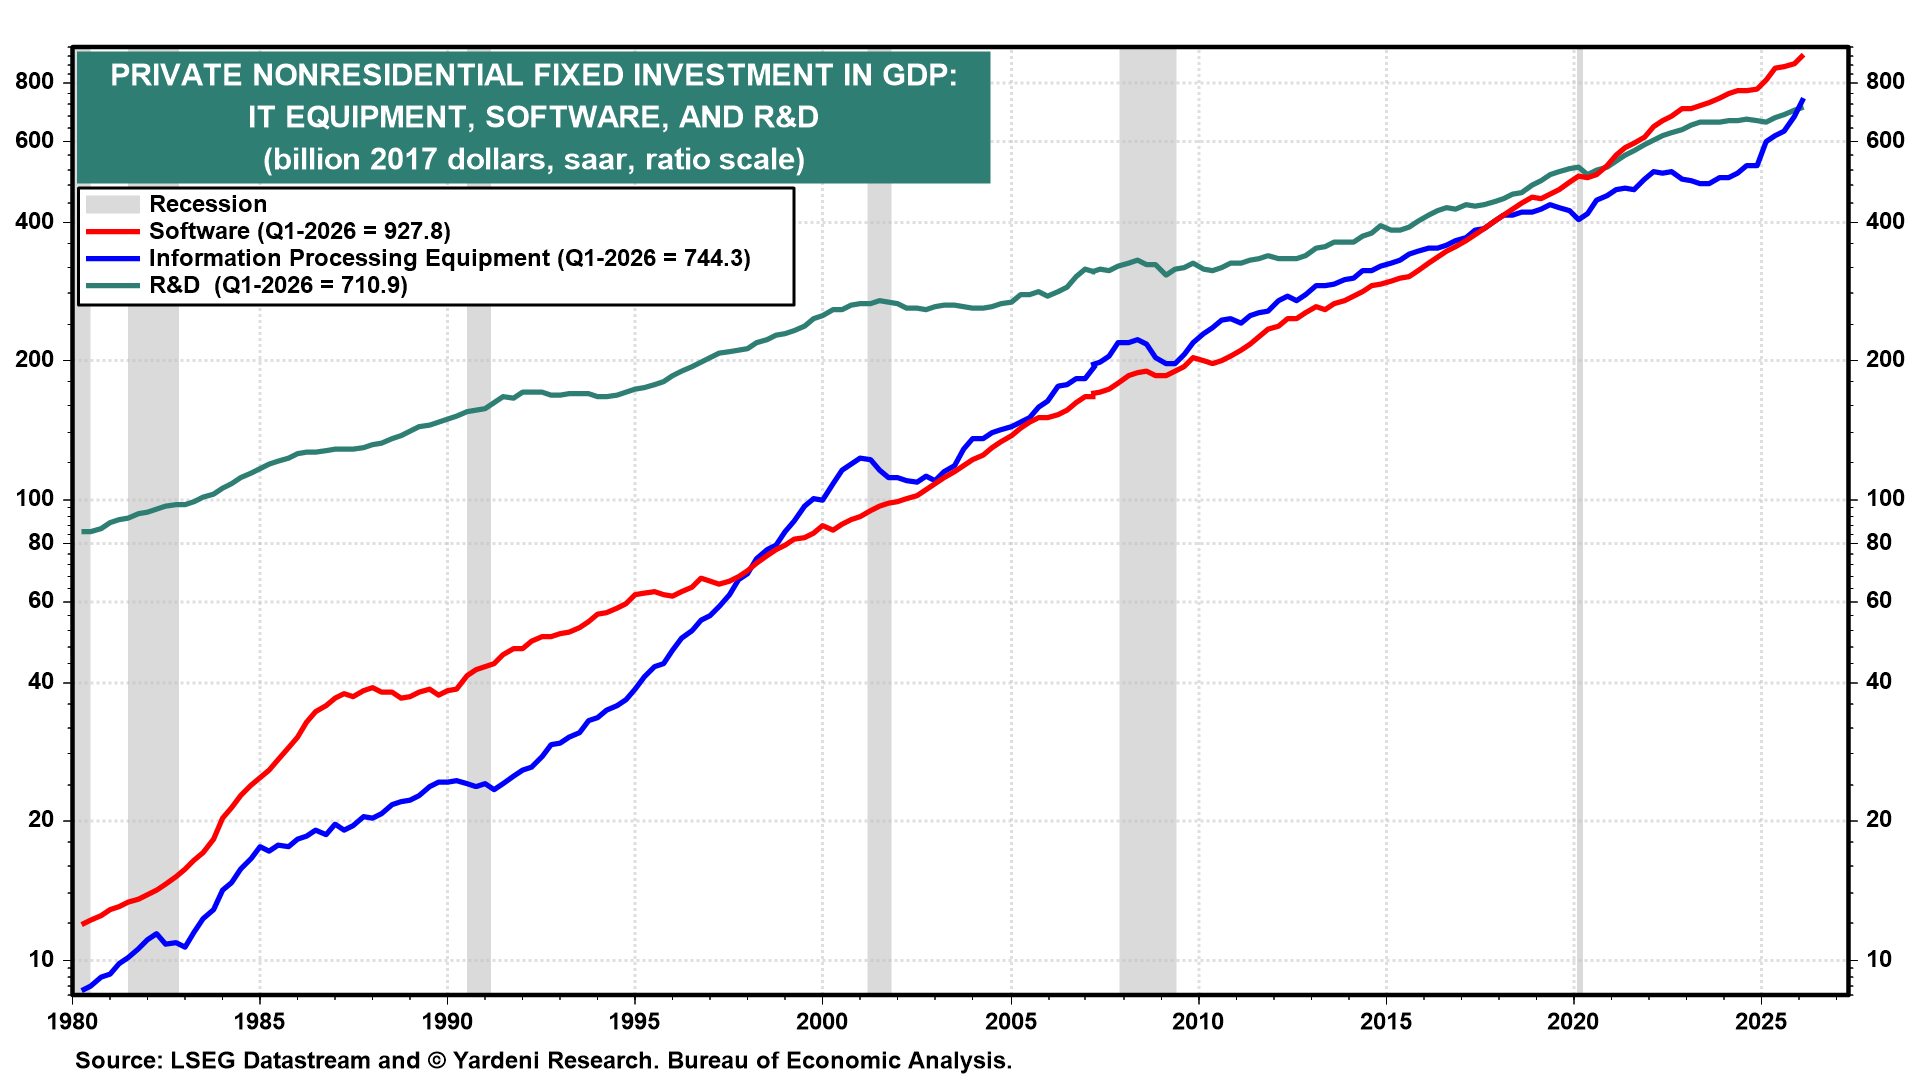
Software, information processing equipment, and R&D also reached fresh record highs in Q1-2026. The pace of growth in information processing equipment steepened significantly recently amid the AI-driven investment boom (chart).
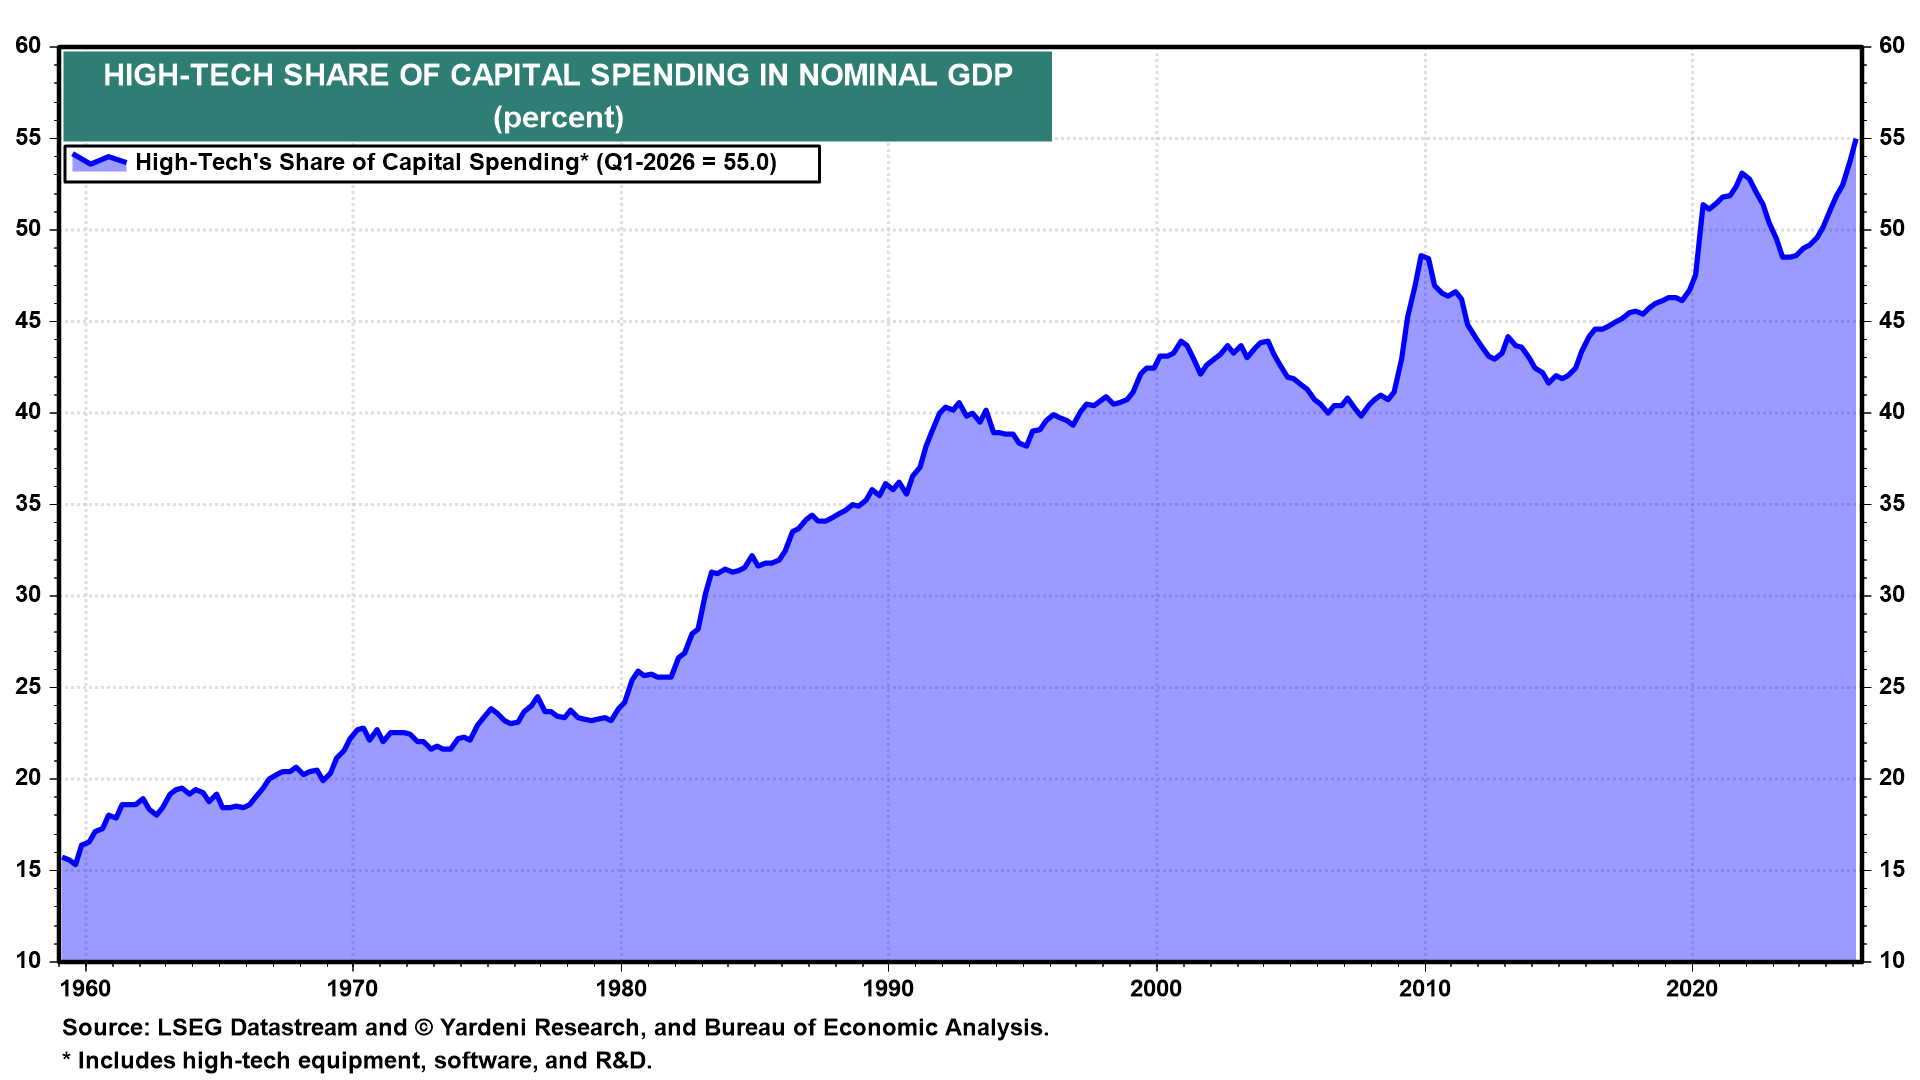
High tech's share of total nominal nonresidential capital spending surged to a record high of 55% in Q1-2026 (chart).
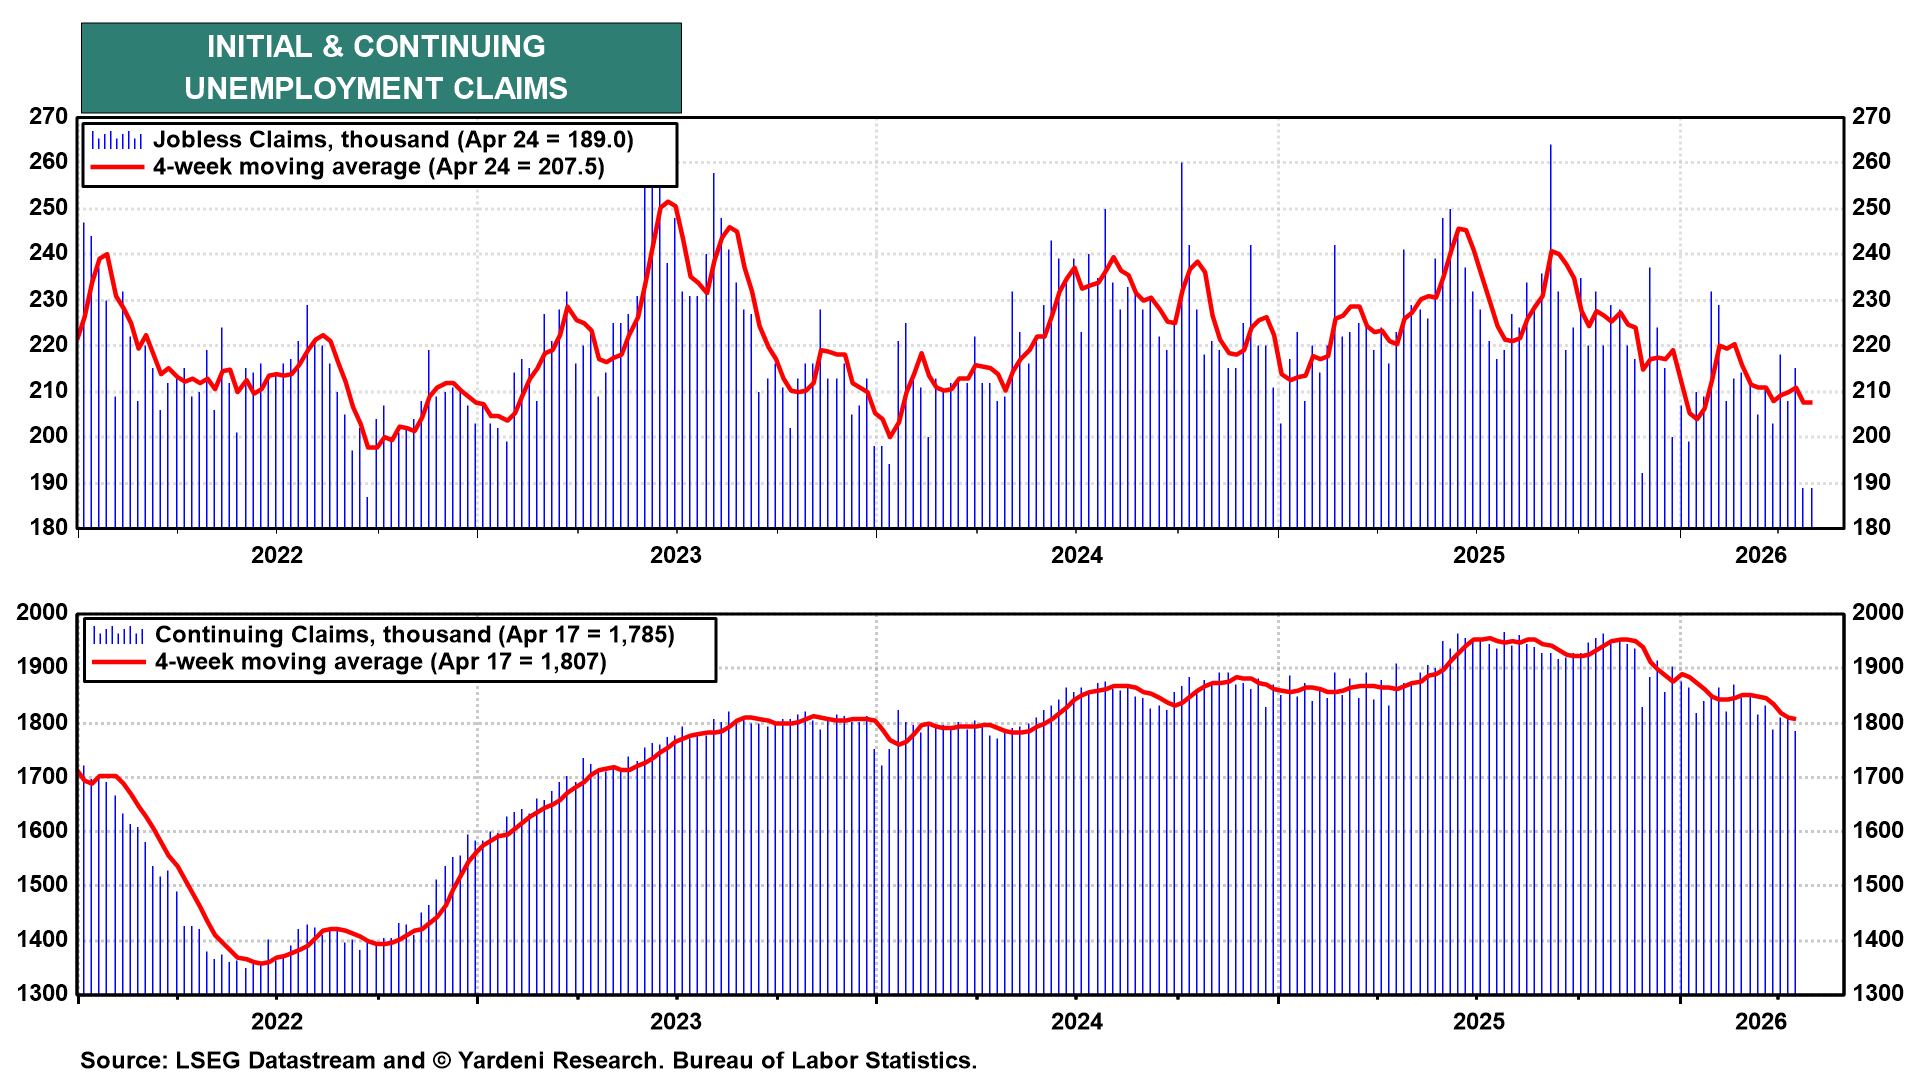
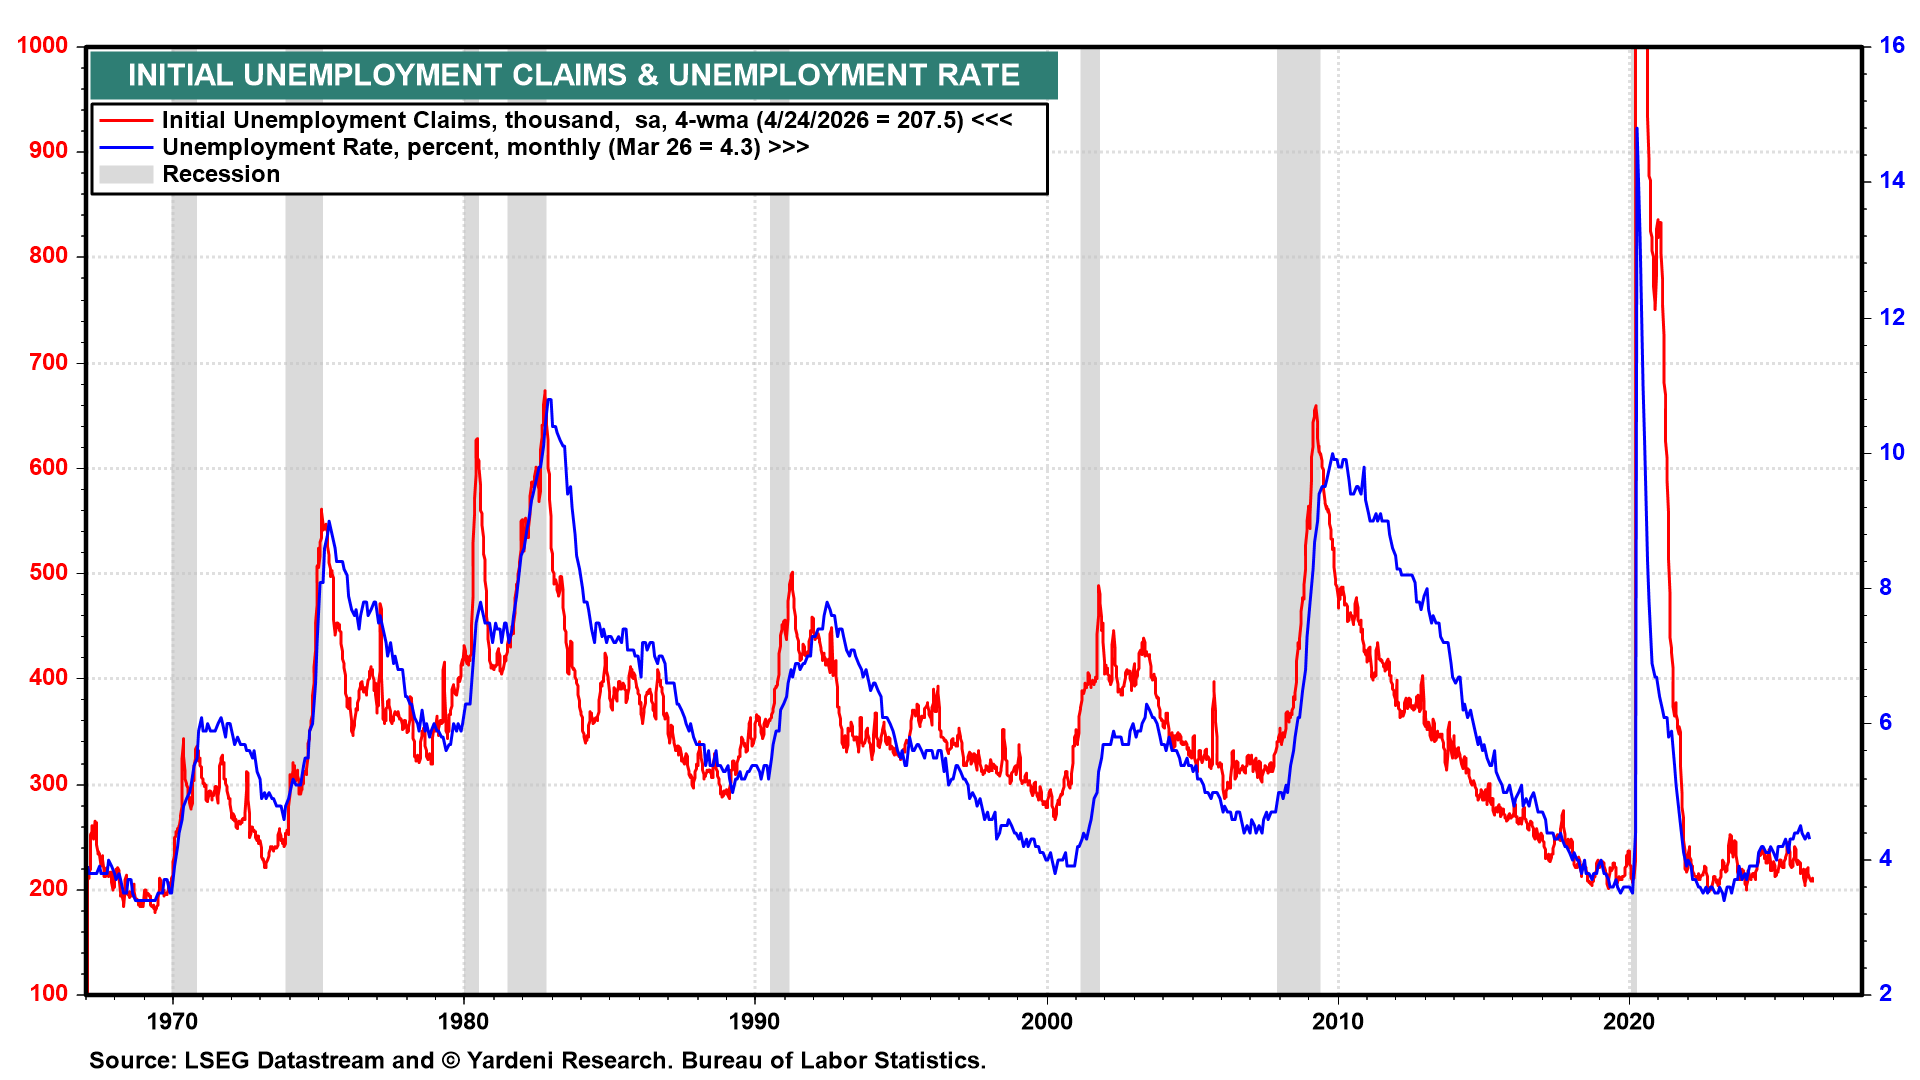
(4) Labor Market. The labor market delivered a blockbuster reading this week. Initial unemployment claims dropped to the lowest level since 1969, confirming that layoff activity remains remarkably subdued. Continuing jobless claims are also falling (chart).
The recent drop in initial jobless claims suggests that the unemployment rate likely fell in April (chart).
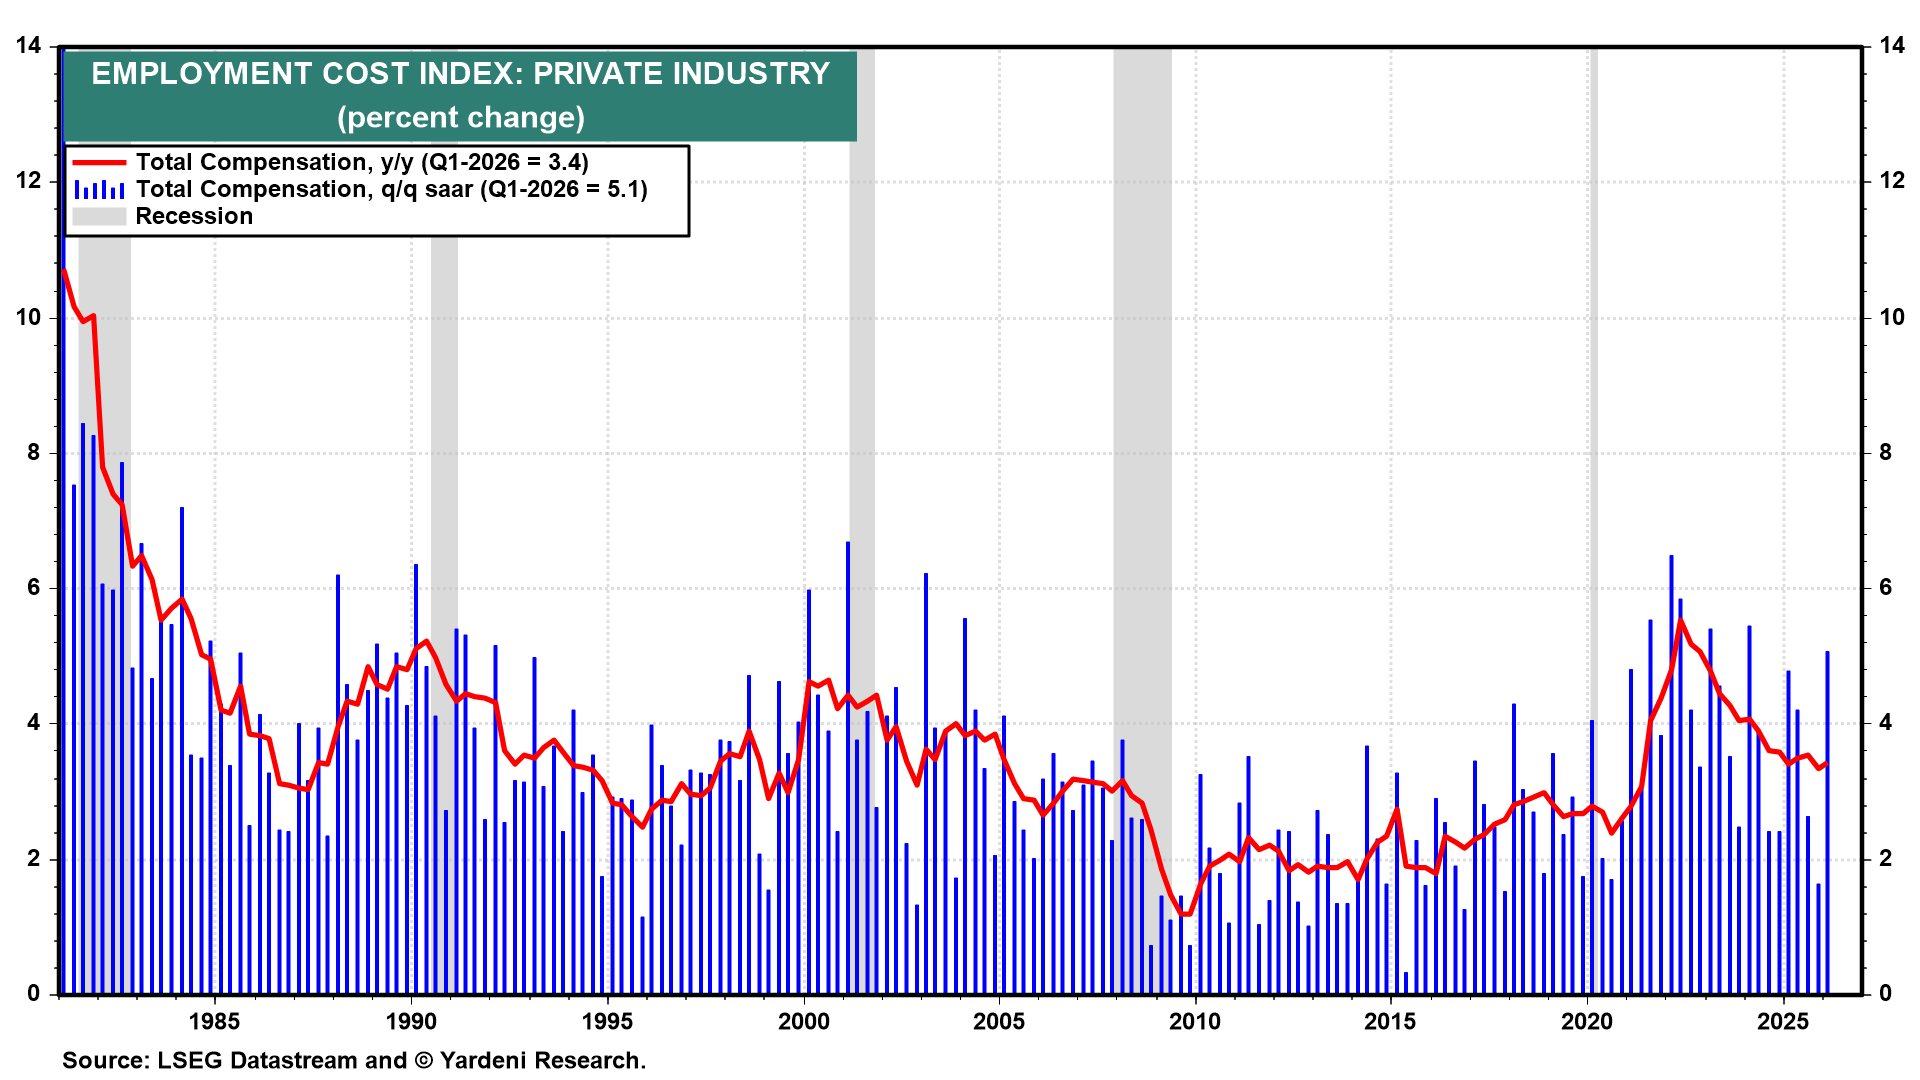
The Q1 Employment Cost Index came in hotter than expected, but the composition is important. The acceleration was driven by a surge in benefits costs, specifically, employer-sponsored health insurance reflecting the expiration of ACA subsidies.
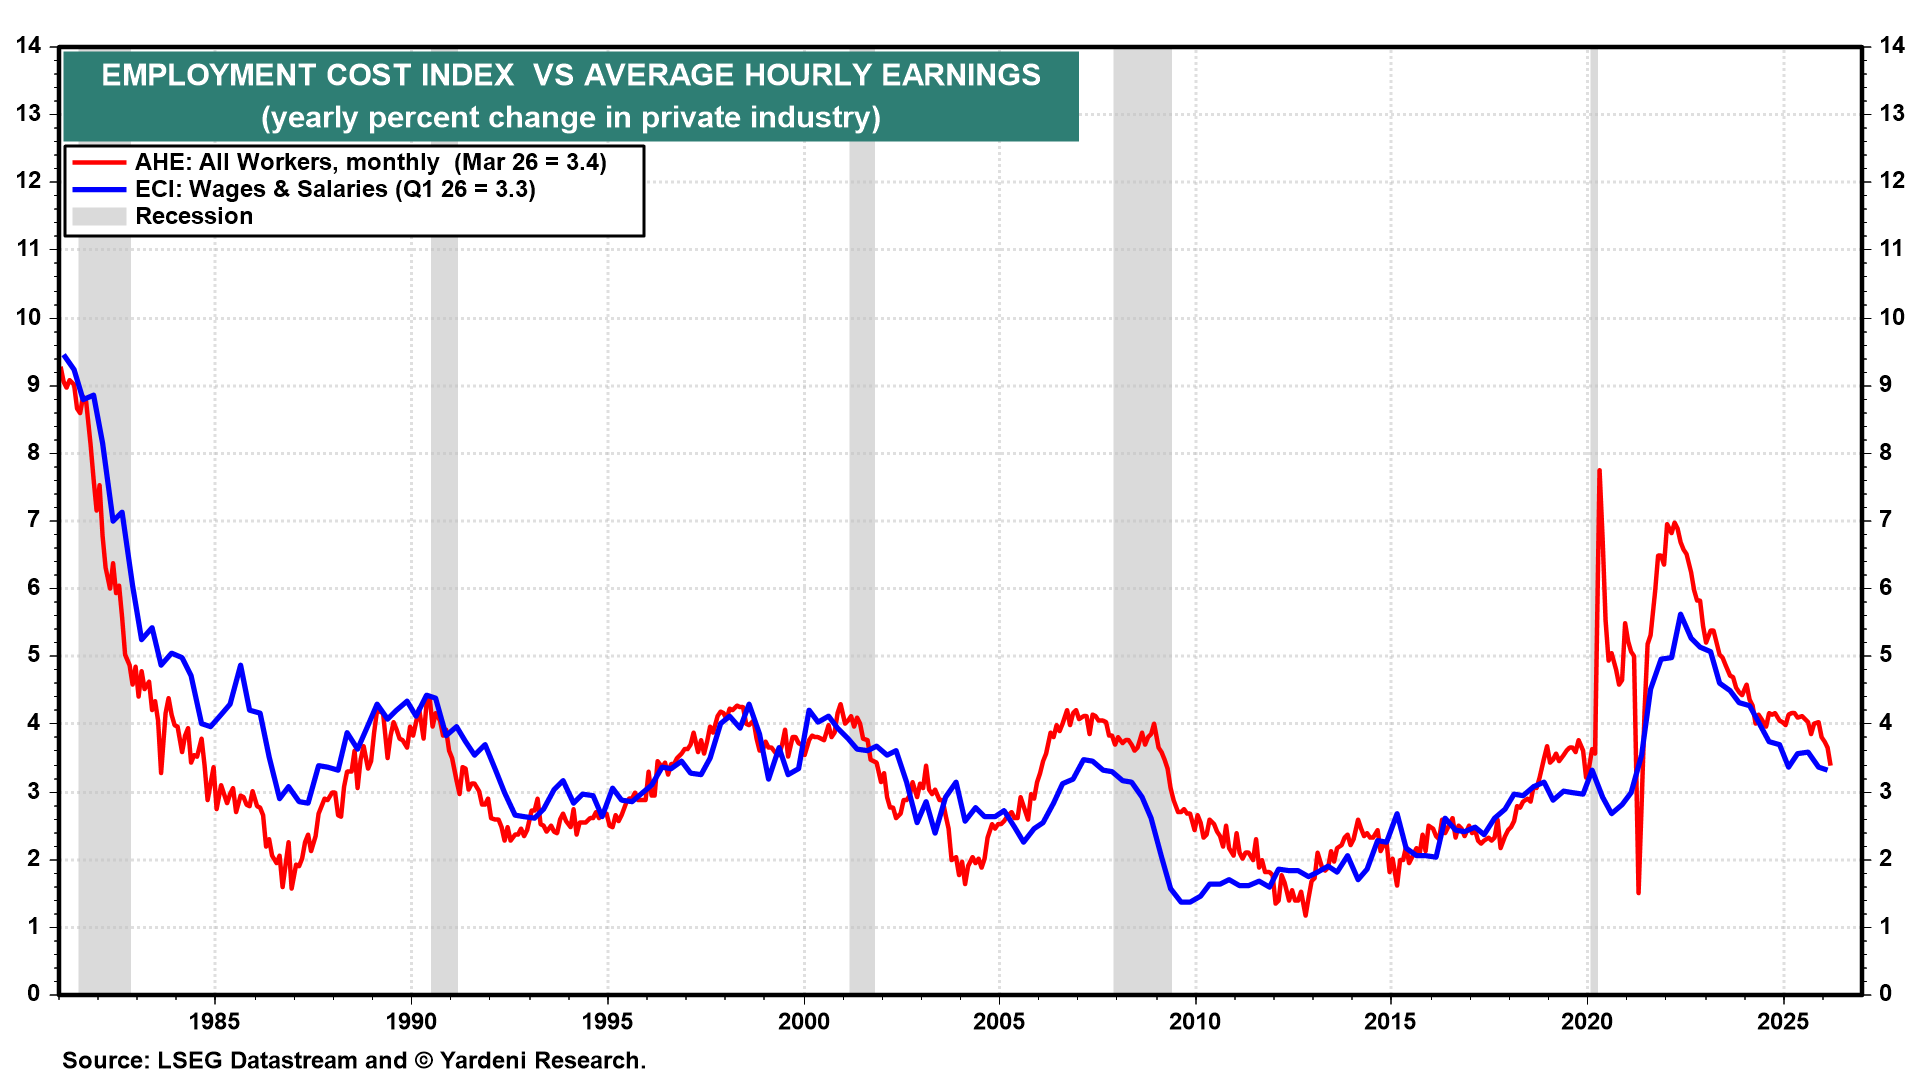
Both average hourly earnings and ECI wages & salaries have cooled significantly from their 2022 peaks and are now broadly converging near pre-pandemic norms (chart).
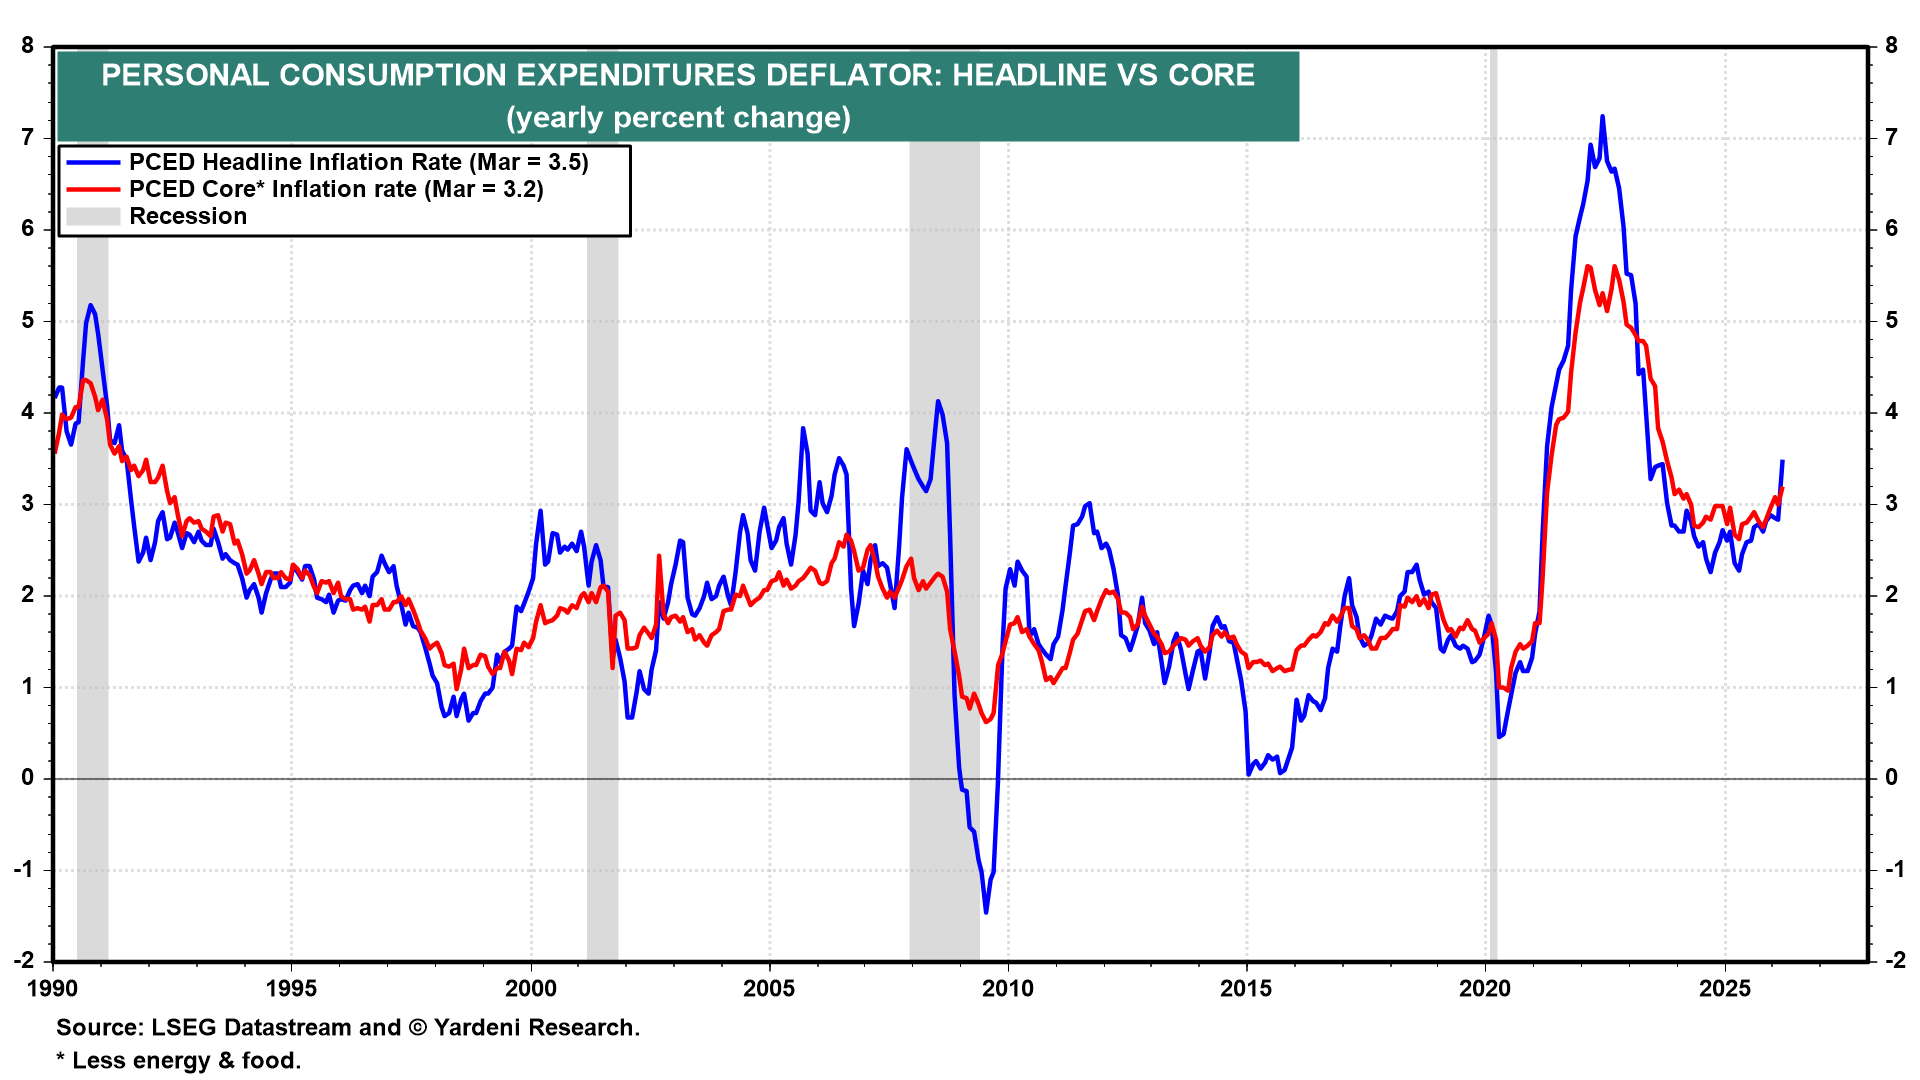
(5) Inflation. Headline PCED inflation spiked in March, driven by the energy price surge (chart). Importantly, core inflation is also moving further away from the Fed’s 2.0% y/y target.
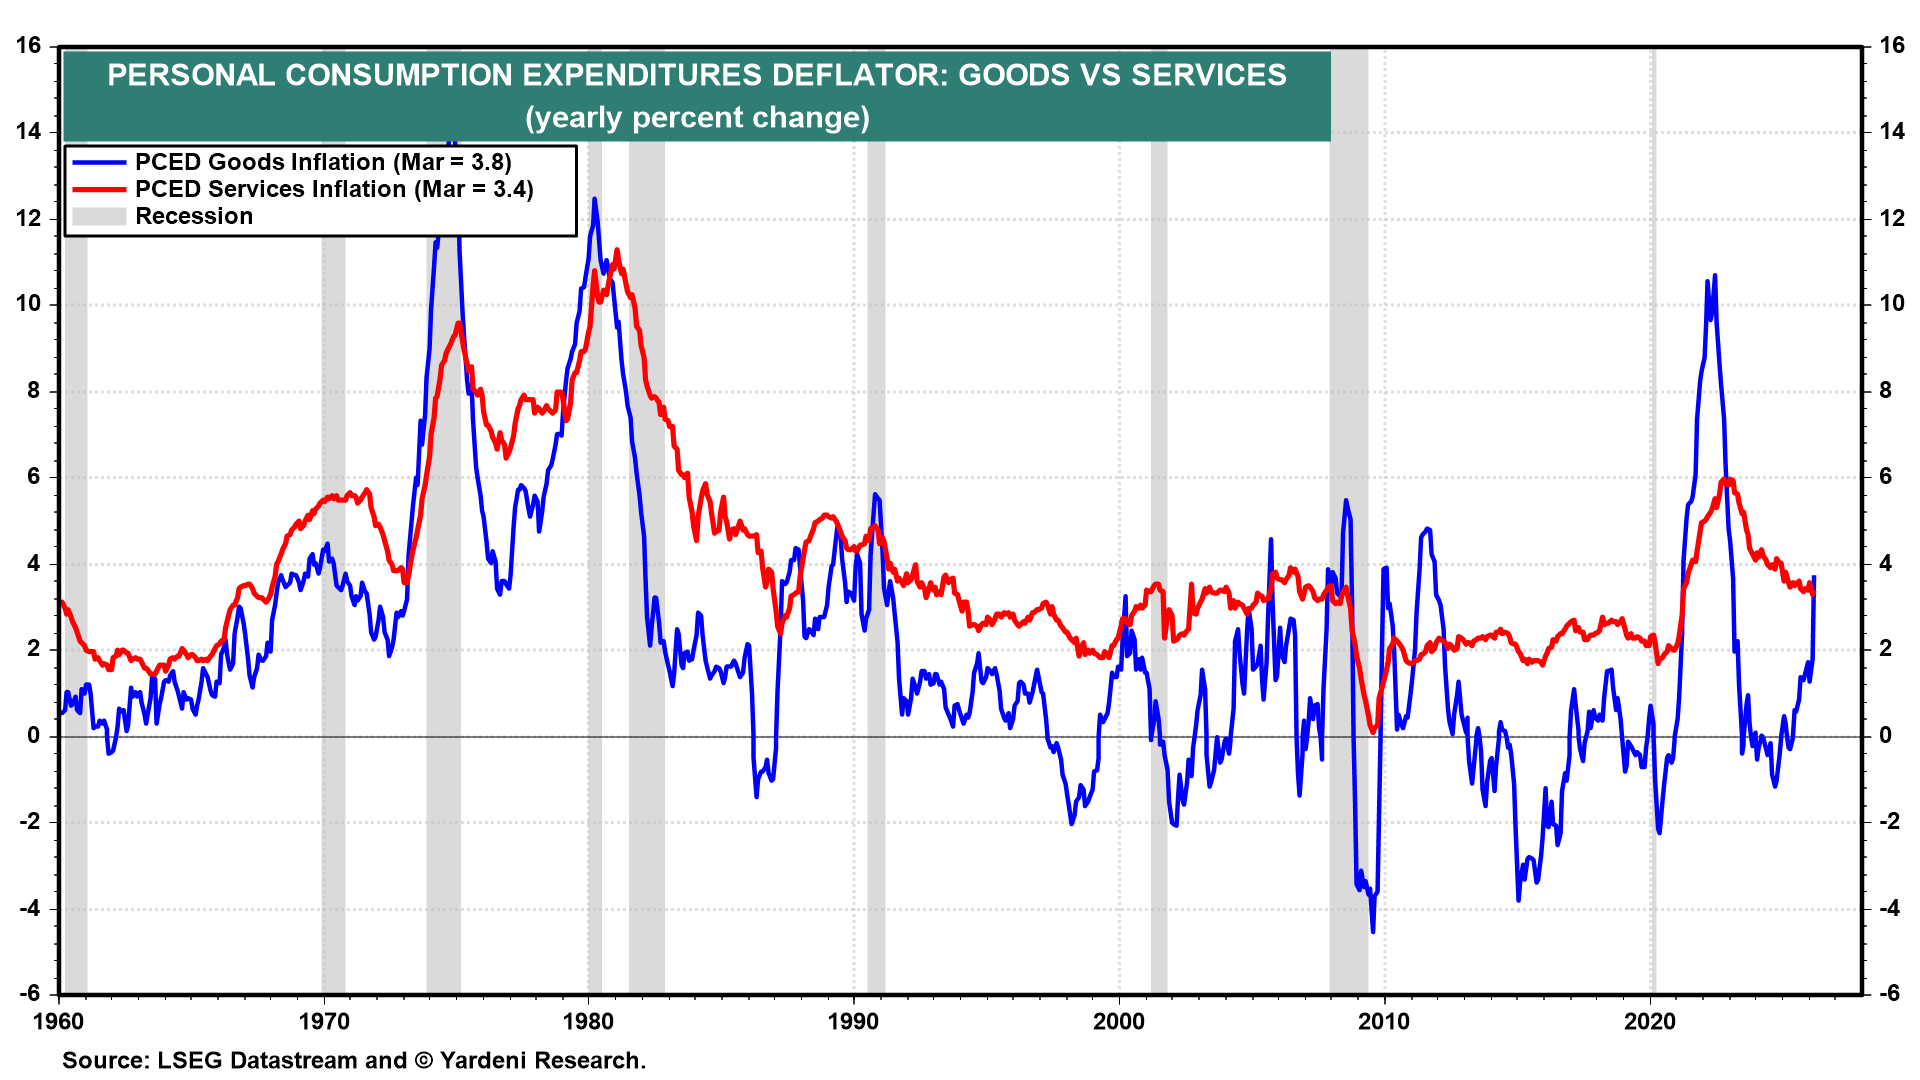
Goods inflation has re-accelerated sharply, reflecting the energy price shock and tariff pass-through, while services inflation remains stubbornly sticky (chart).
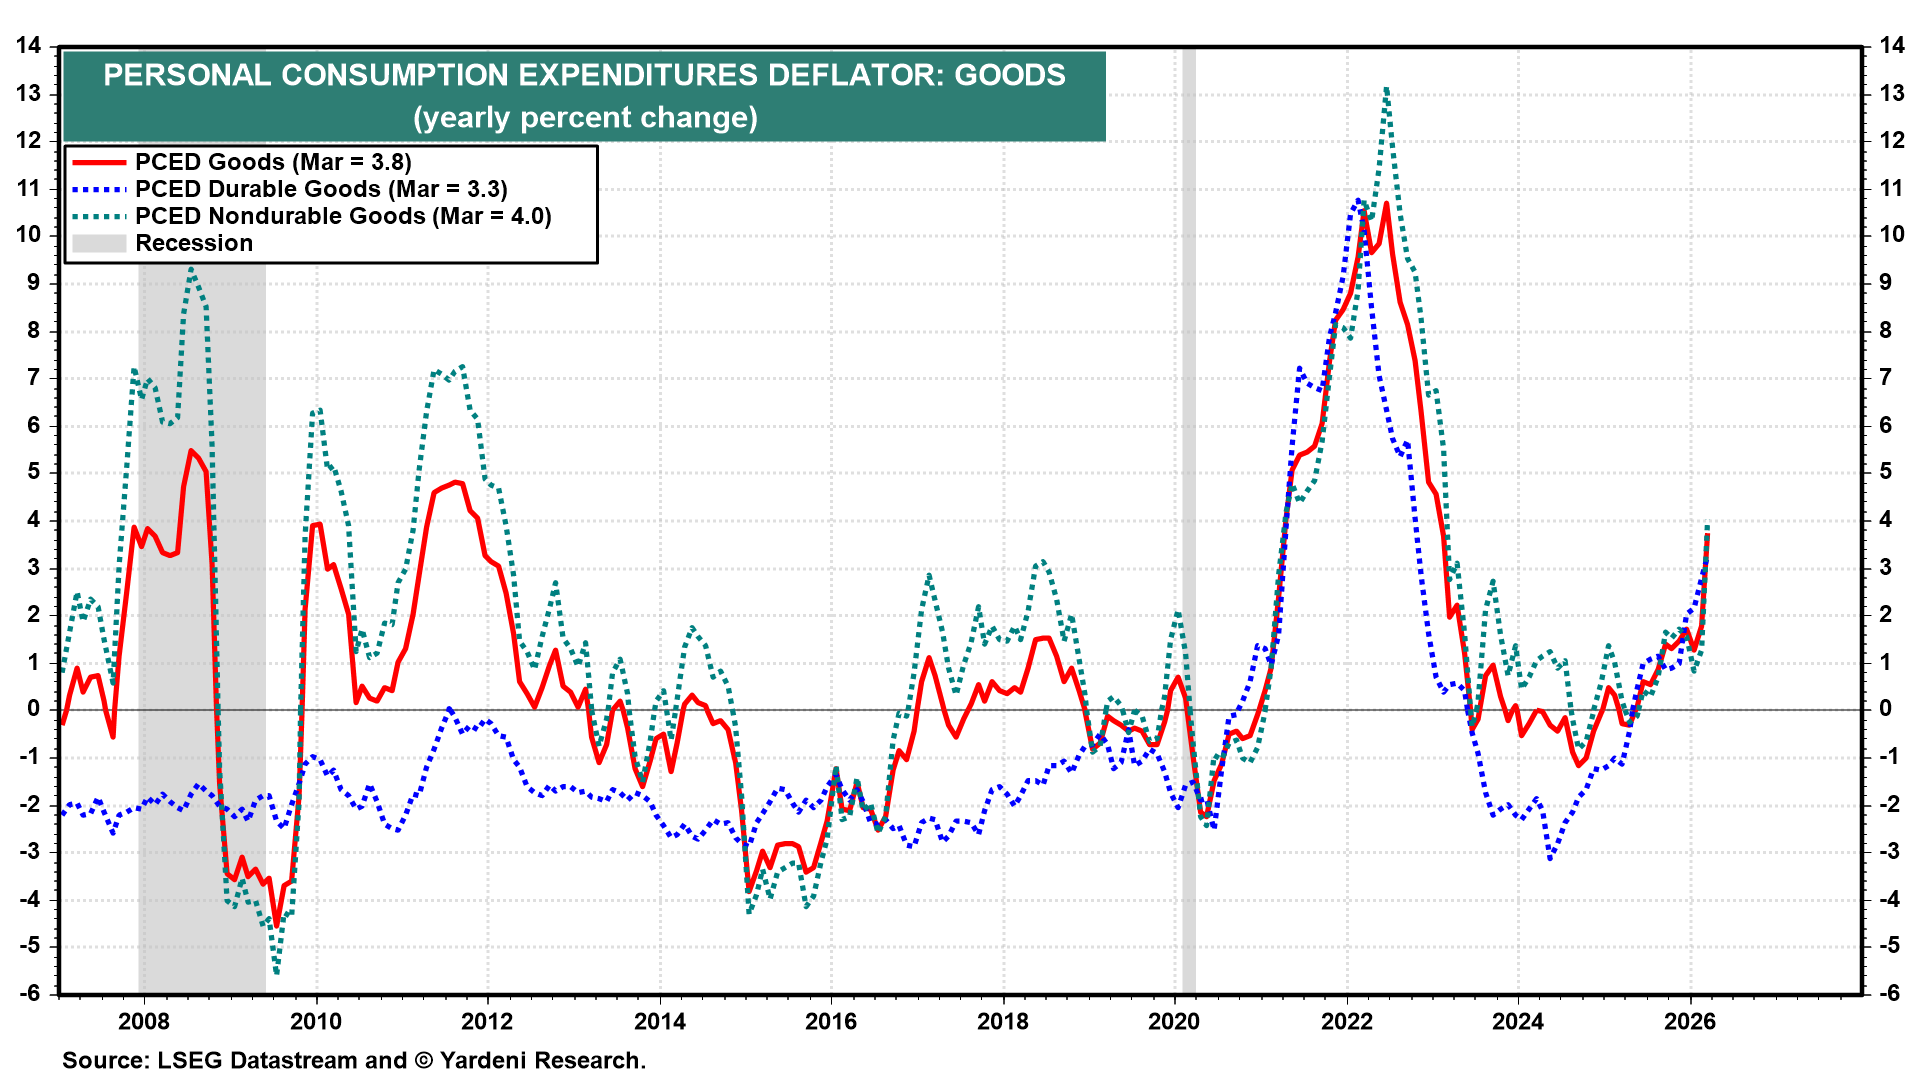
The re-acceleration in goods inflation is being led by nondurables, especially energy (chart). Durable goods inflation has also been moving higher since Trump's tariffs were imposed early last year. There is no sign that the tariff effect is dissipating so far.
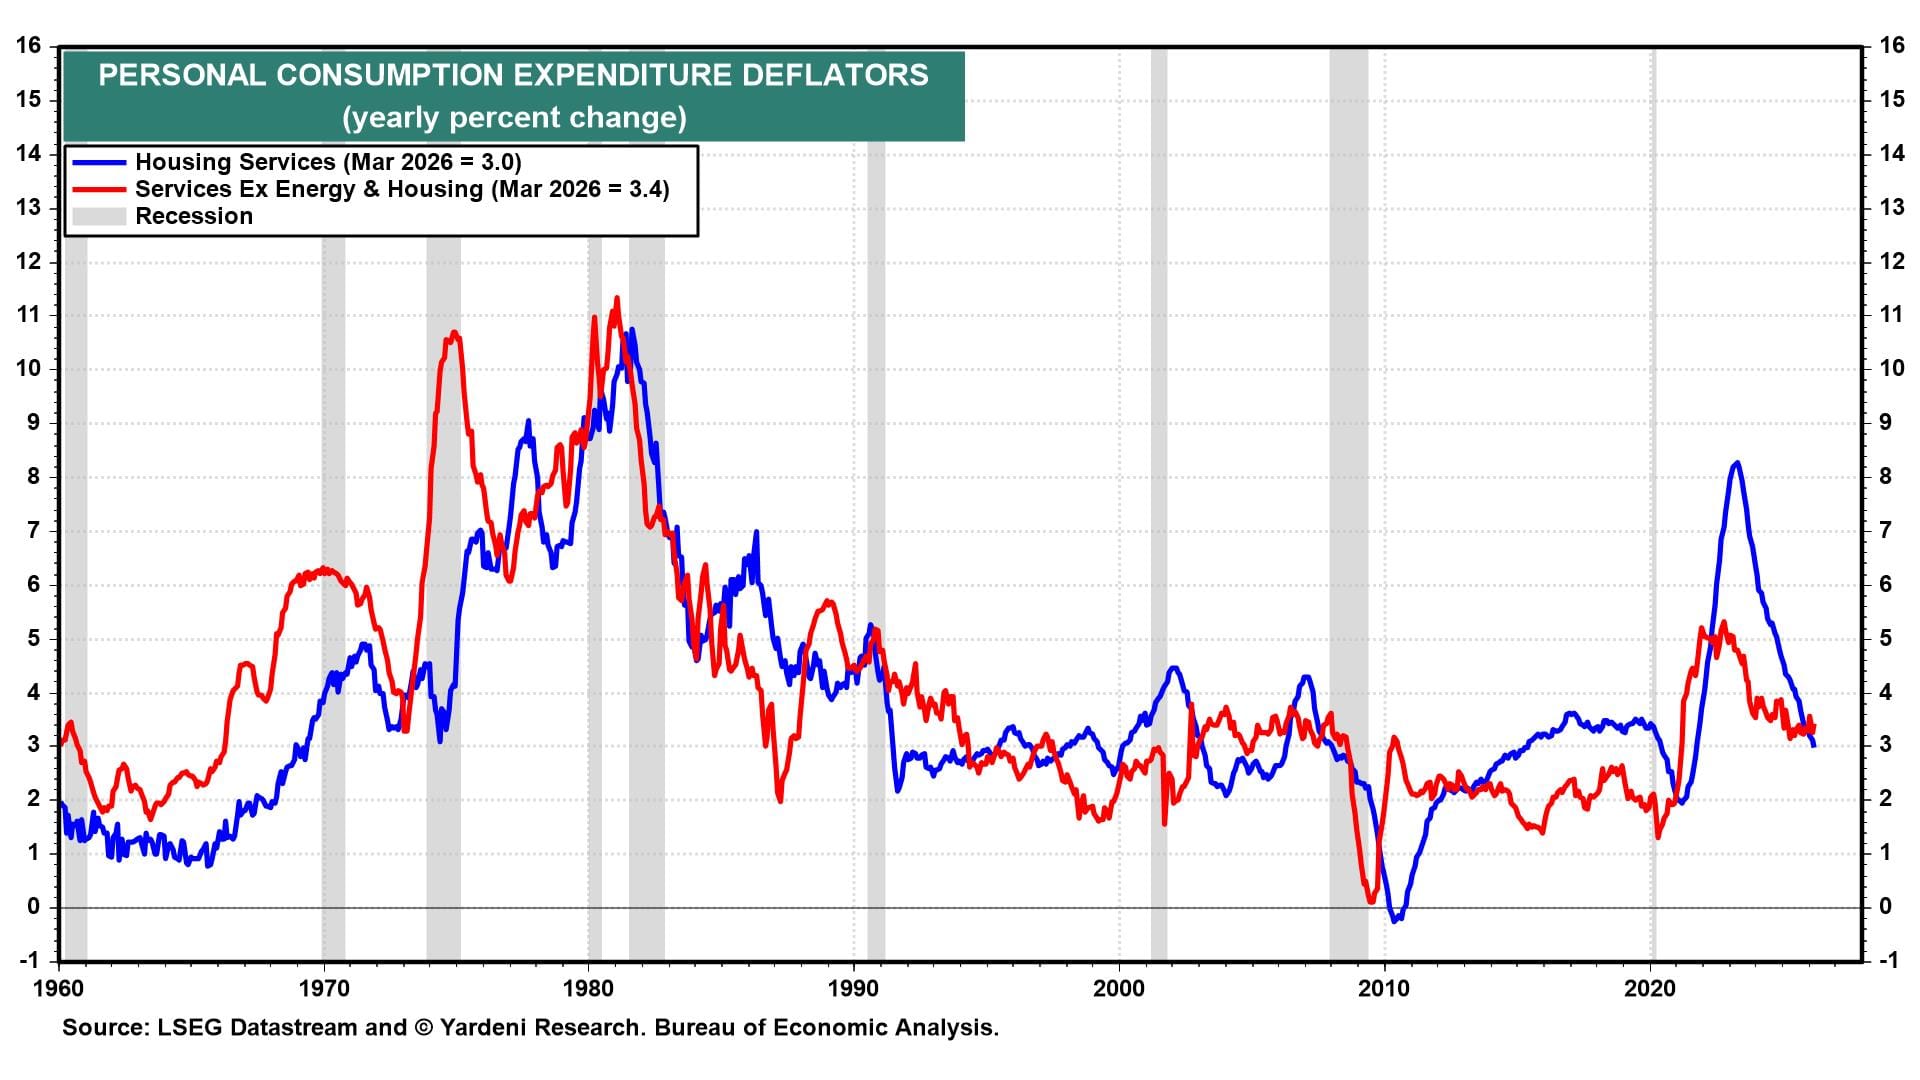
Housing services inflation continues to gradually cool, but services inflation ex-housing and ex-energy suggests little progress on the last mile to the Fed's inflation target (chart).
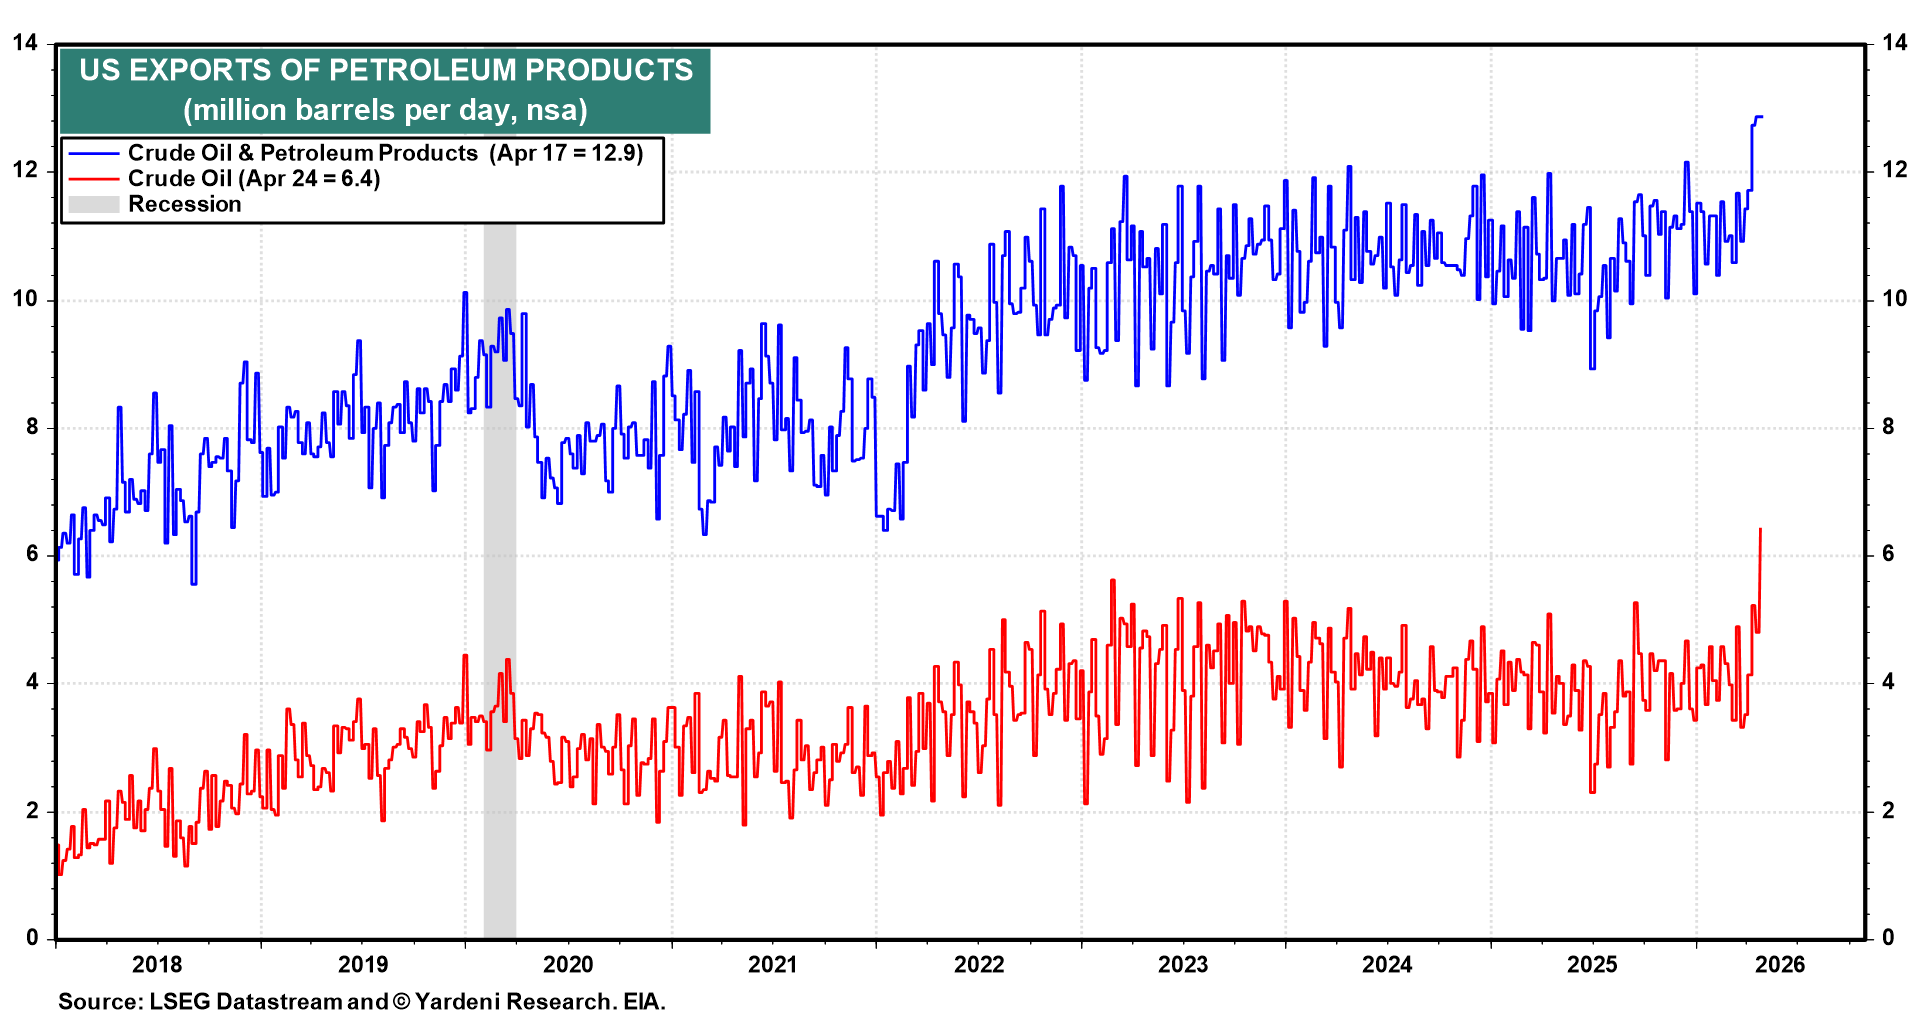
(6) Miscellaneous. US crude oil exports may be starting to take off to fill the supply gap caused by the blockades in the Arabian Gulf (chart).
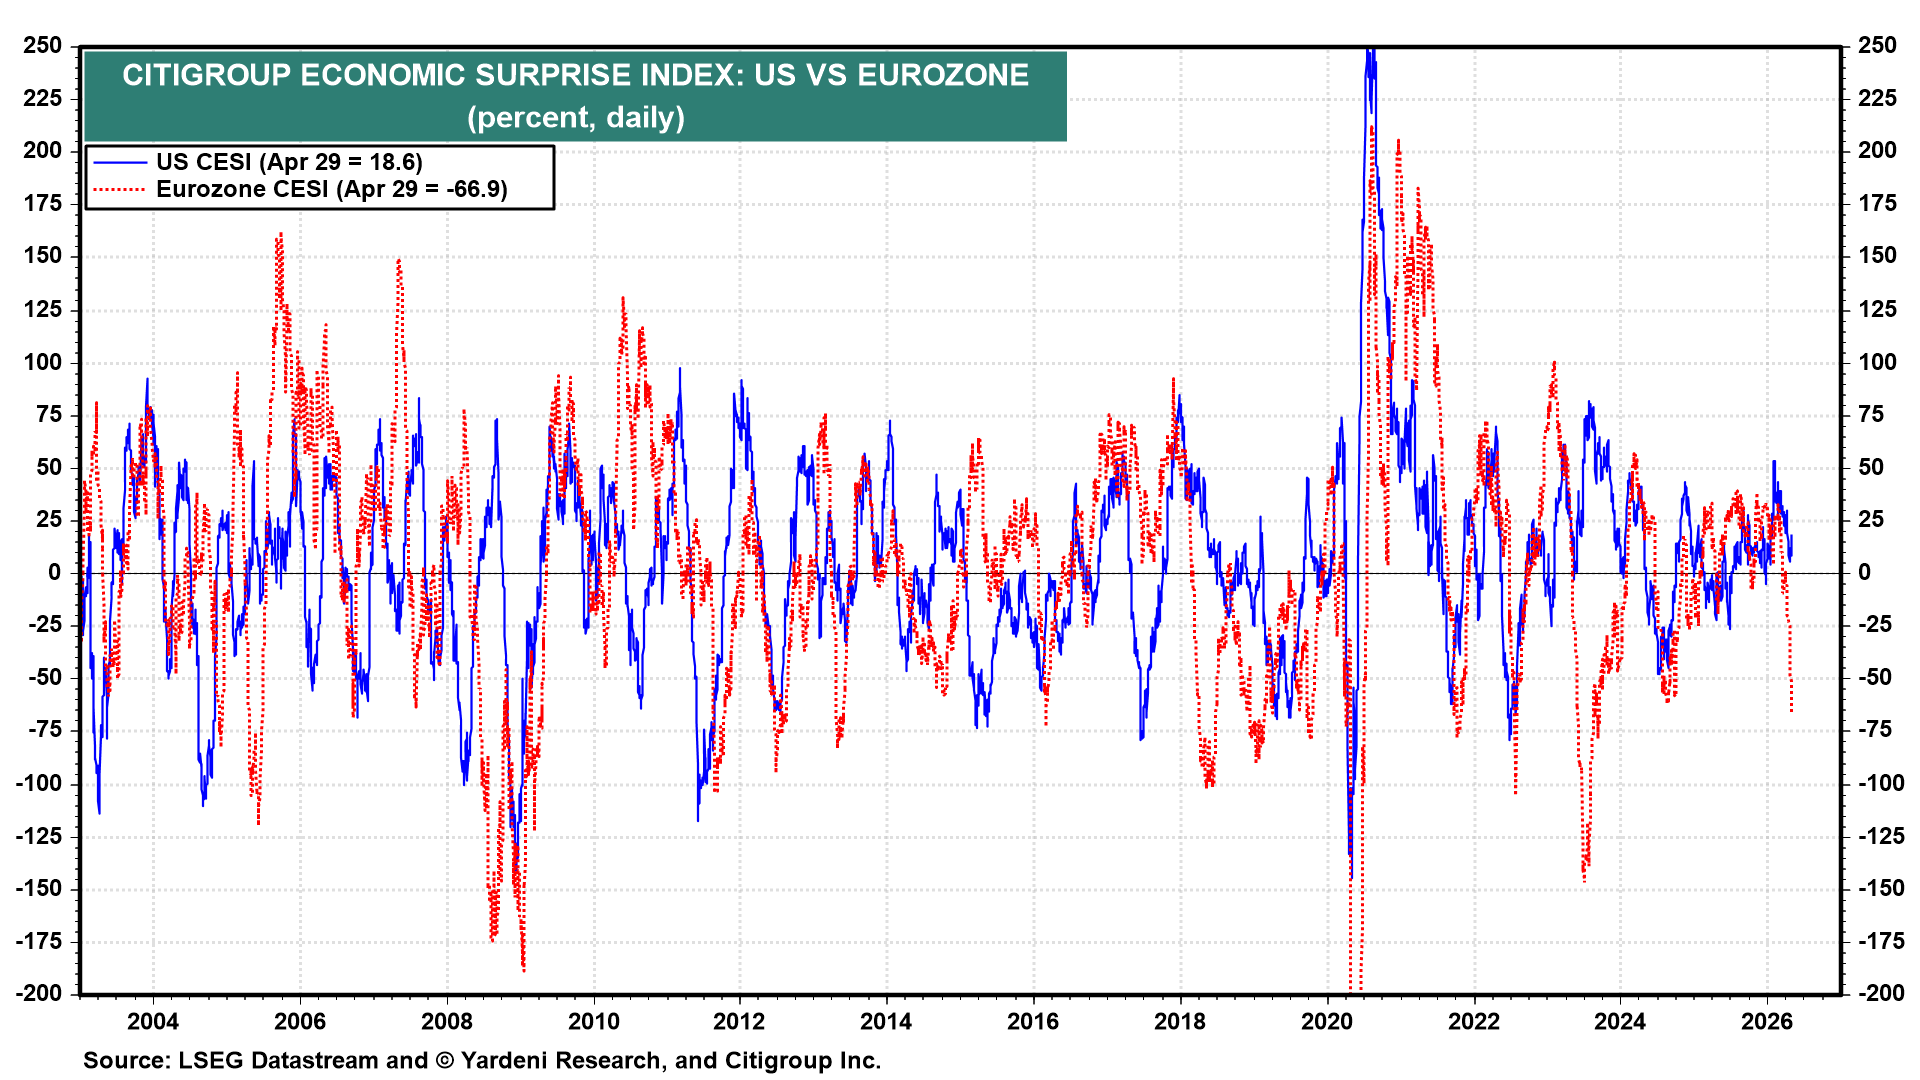
The US economy is handling the energy shock better than the Eurozone economy according to their Citigroup Economic Surprise Indexes (chart).