

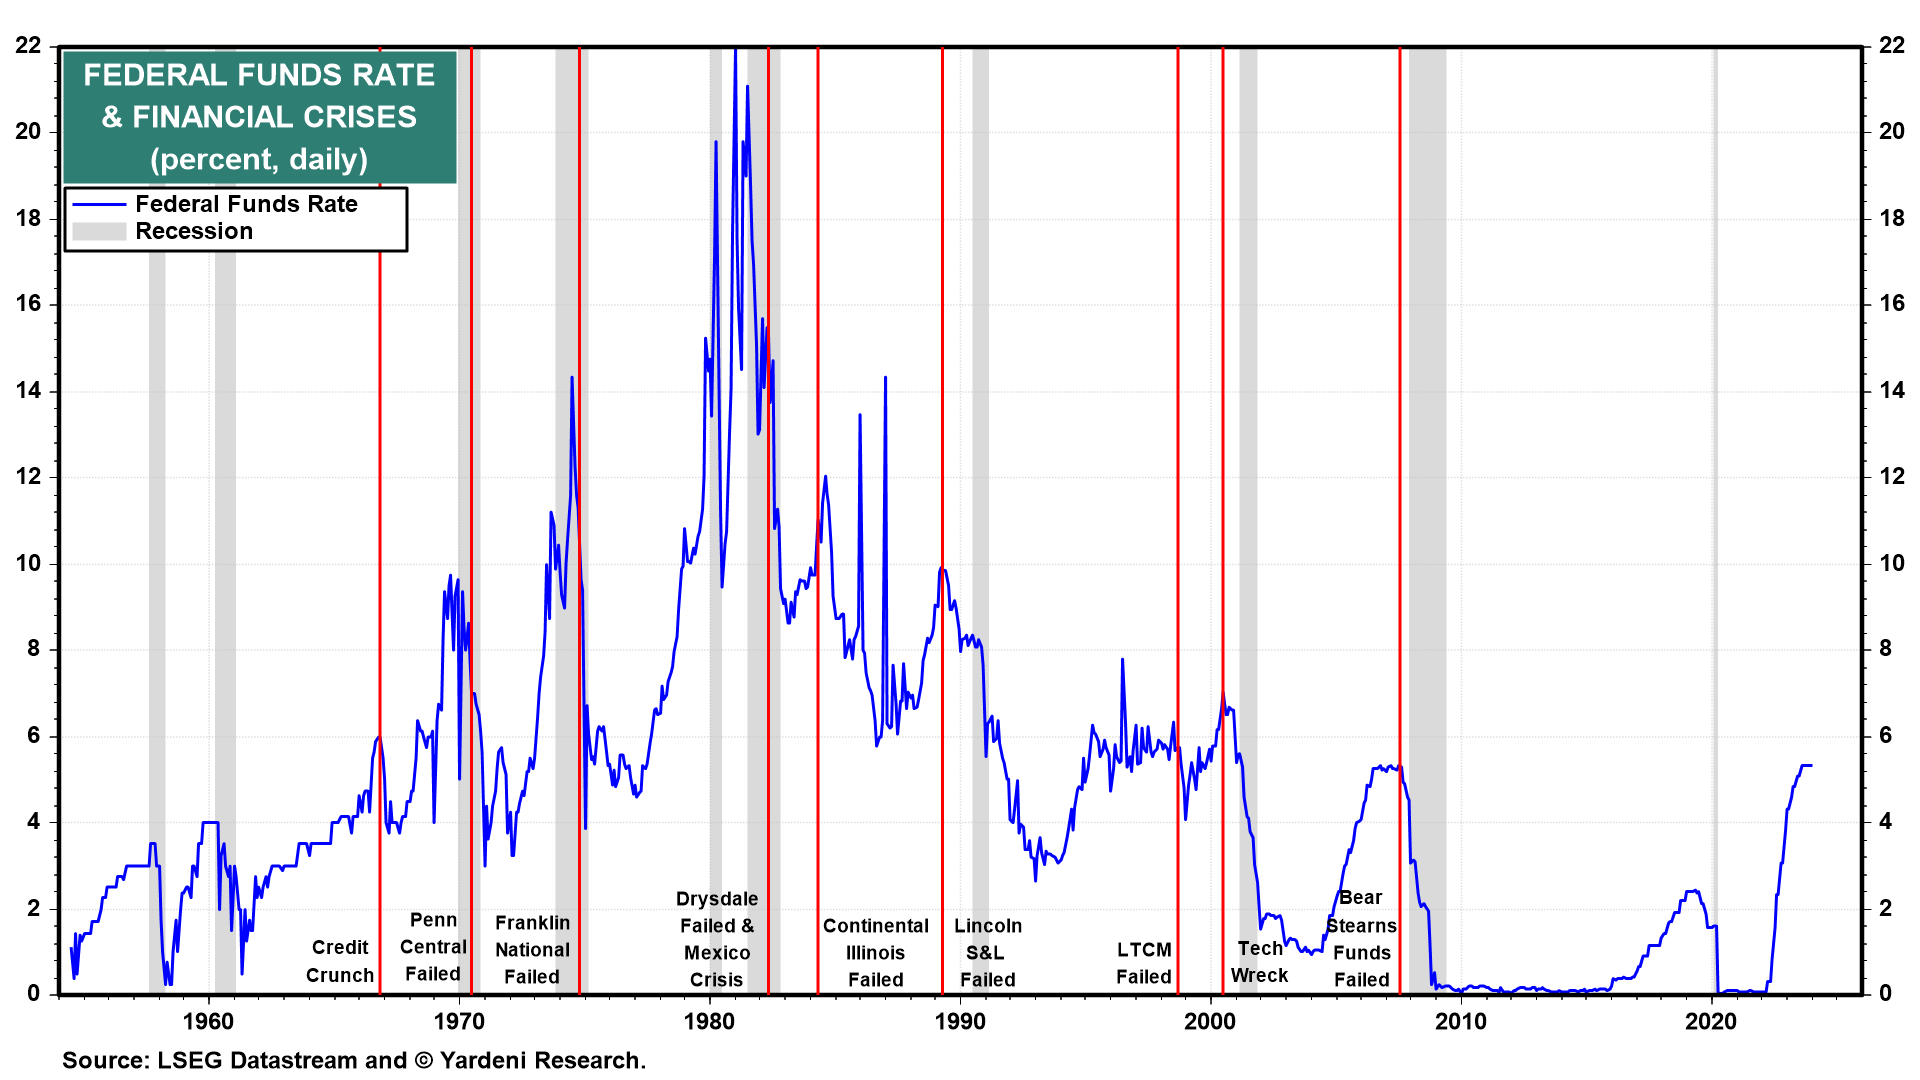
How long is the lag between monetary policy tightening and recessions? In the past, the answer to that question depended on how long it took the federal funds rate to rise to levels that triggered financial crises that morphed into credit crunches, which quickly caused recessions. Past federal funds rate hiking cycles tended to peak when financial crises resulted from rising interest rates and tightening credit conditions (Fig. 1 below).
Prior to these events, the yield curve tended to invert, reflecting investors’ anticipation that restrictive monetary policy likely would cause something to break in the financial system, forcing the Fed to ease (Fig. 2). Inverted yield curves indicated that bonds were becoming more appealing to investors than money market instruments, as they reasoned that locking in long-term rates in bonds made more sense than getting caught in short-term instruments when their interest rates came tumbling down.
Research by Melissa and me, which we’ve discussed often in recent years, supports our thesis that inverted yield curves forecast a process that often—but not inevitably—leads to a recession. Tighter money eventually causes a financial crisis, which turns into an economywide credit crunch. It is the credit crunch that causes the subsequent recession, not higher interest rates per se nor inverted yield curves. (Download a free copy of our 2019 study titled The Yield Curve: What Is It Really Predicting? for a deeper explanation of our thesis.)
The alternative and widely held thesis—that there are long and variable lags between the tightening of monetary policy and a recession—assumes that rising interest rates depress demand, which inevitably sets off a recession. We disagree. In our opinion, the timing question boils down to this: “When the Fed is raising the federal funds rate, how long will it take before it gets high enough to break something in the financial system?”
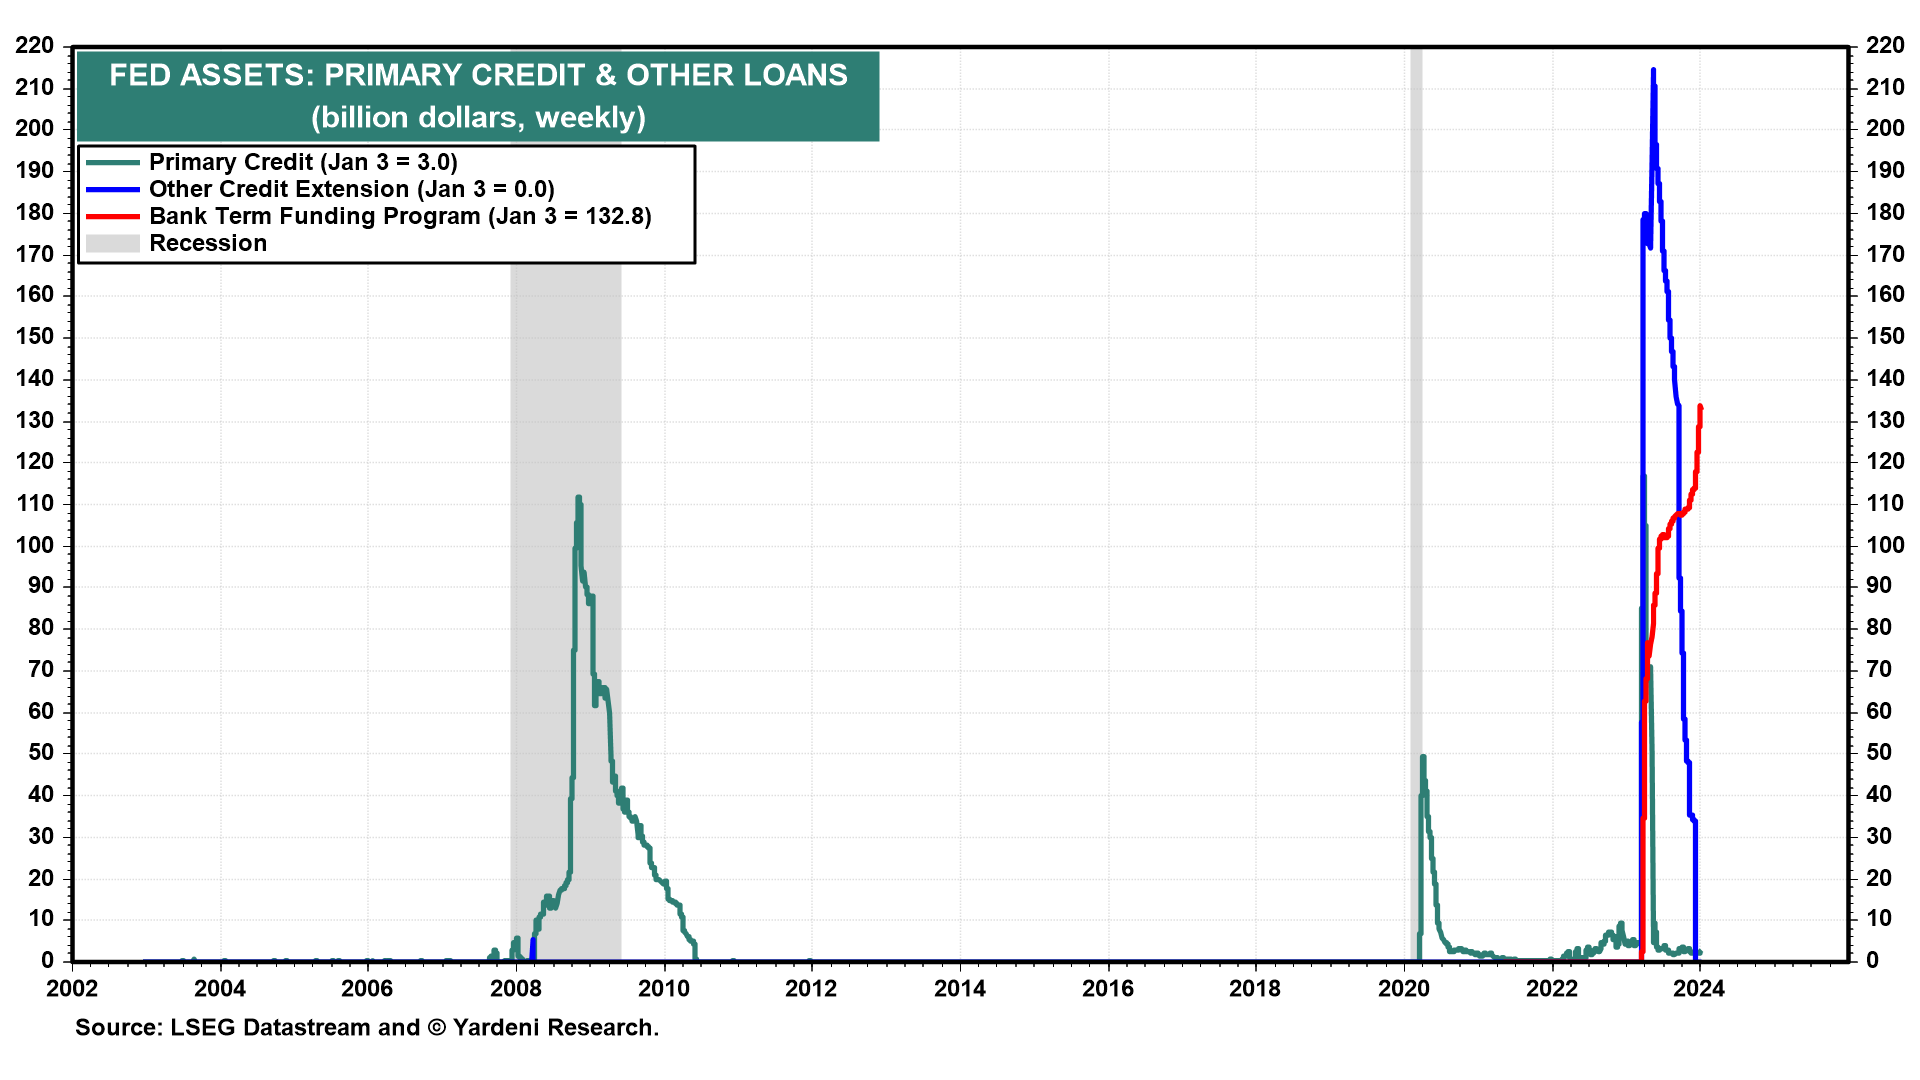
So far, the latest round of Fed tightening did cause three banks to fail last March, attesting to the vulnerability of links in the financial system chain when rates are rising. But the Fed averted a credit crunch by rapidly providing liquidity through a new emergency lending facility dubbed the “Bank Term Funding Program” on March 12, 2023. As of the week of January 3, it had provided $132.8 billion of liquidity to support the banking system (Fig. 3 below). Averting a credit crunch also avoided a recession, so far at least.
Meanwhile, Fed officials signaled in their December Summary of Economic Projections that they are done raising the federal funds rate and expect to be lowering it three times in increments of 25bps this year. The financial markets have been discounting this easing scenario since October 19, when the 2-year and 10-year Treasury yields peaked at 5.19% and 4.98% (Fig. 4). They were down to 4.40% and 4.05% on Friday. The 30-year mortgage rate is down by about 100bps since early November.
So now the question is whether the recent easing of financial conditions will offset any of the long and variable lags of the Fed’s restrictive policy over the past two years. We think so. Let’s have a look at this issue with the help of past and current relevant data. Before doing so, we want to reiterate that we are proponents of our credit crunch theory of recessions rather than the widely held notion that the long and variable lags of monetary policy can still cause a recession this year. Consider the following:
(1/7) Consumer durable goods. Real consumer spending on durable goods is one of the most interest-rate sensitive components of real GDP. Its growth rate tends to slow during monetary policy tightening periods (Fig. 5 below). Interestingly, it then tends to turn negative during the initial period of monetary easing, which usually coincides with a recession. So in the short term, it slows and then turns negative at about the same time that the Fed starts easing.
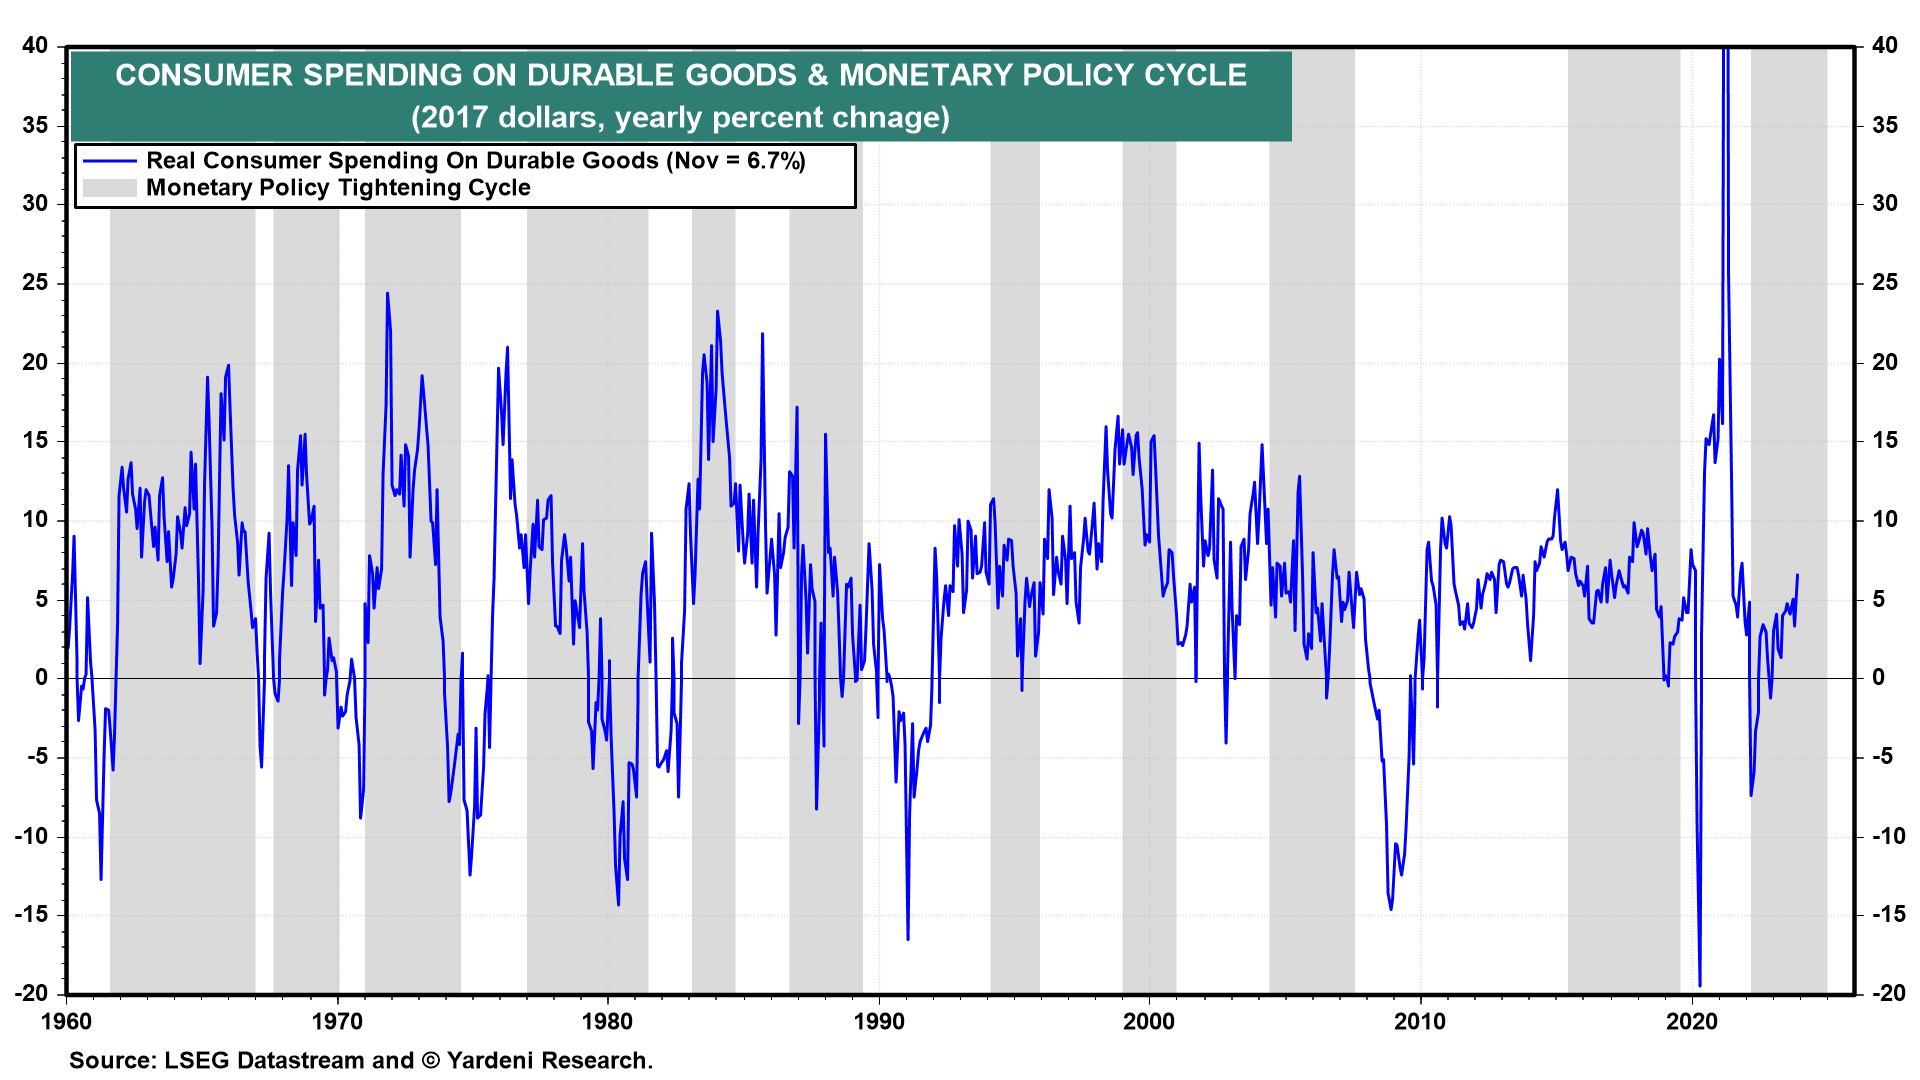
This could conceivably happen now. However, consumers were already slowing the pace of their durable goods purchases in late 2021, before the Fed started to tighten. As we’ve noted recently, the data suggest that the rolling recession in the goods sector is bottoming and could morph into a rolling recovery for goods producer and distributors this year. Indeed, the growth rate of real spending on durable goods rose to 6.7% in November.
(2/7) Housing starts. The most interest-rate sensitive component of real GDP is residential construction. Housing starts often has peaked early during monetary policy tightening periods and then plummeted. Home building then rebounded sharply once the Fed started cutting interest rates.
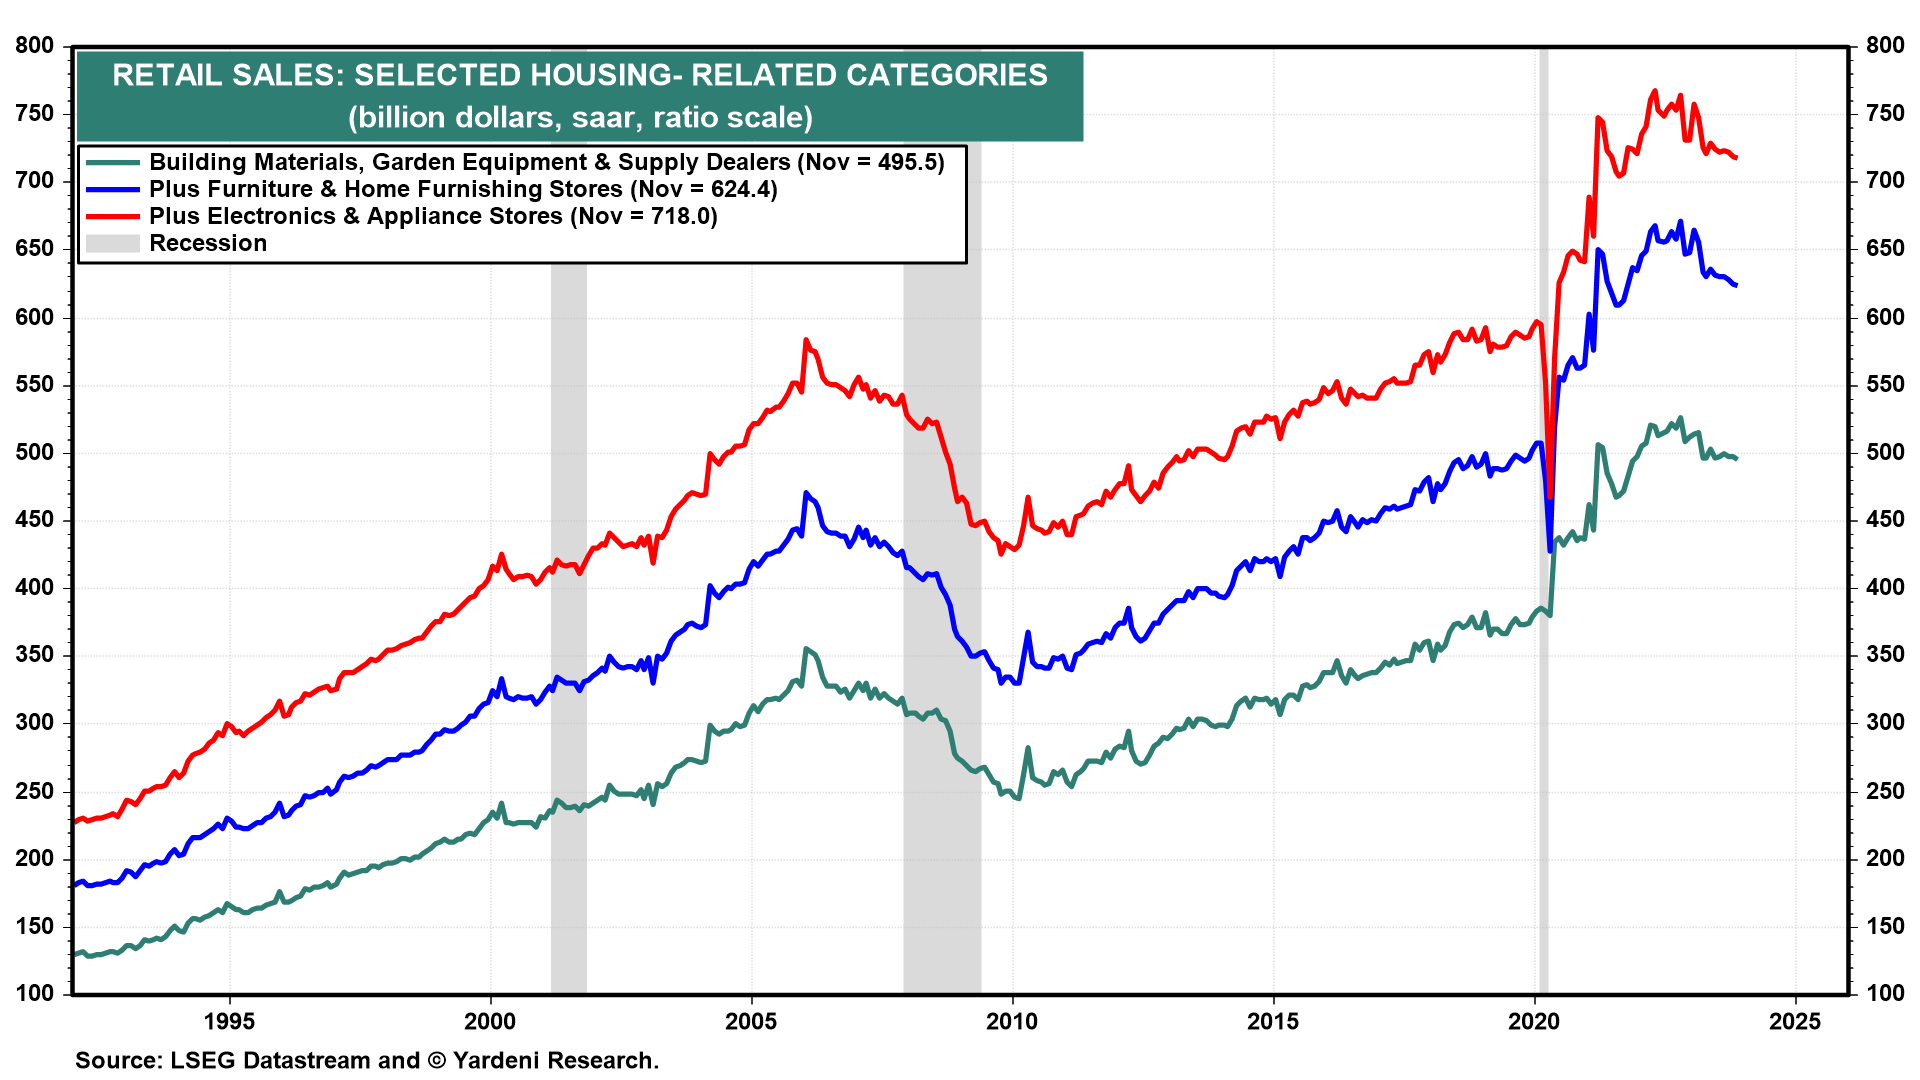
This time, the Fed hasn’t started to cut interest rates, but the mortgage rate is down sharply, and housing starts is showing clear signs of bottoming. If the rolling recession in housing activity morphs into a rolling recovery this year, as we expect, then the housing-related retail sales should rebound too (Fig. 6 below).
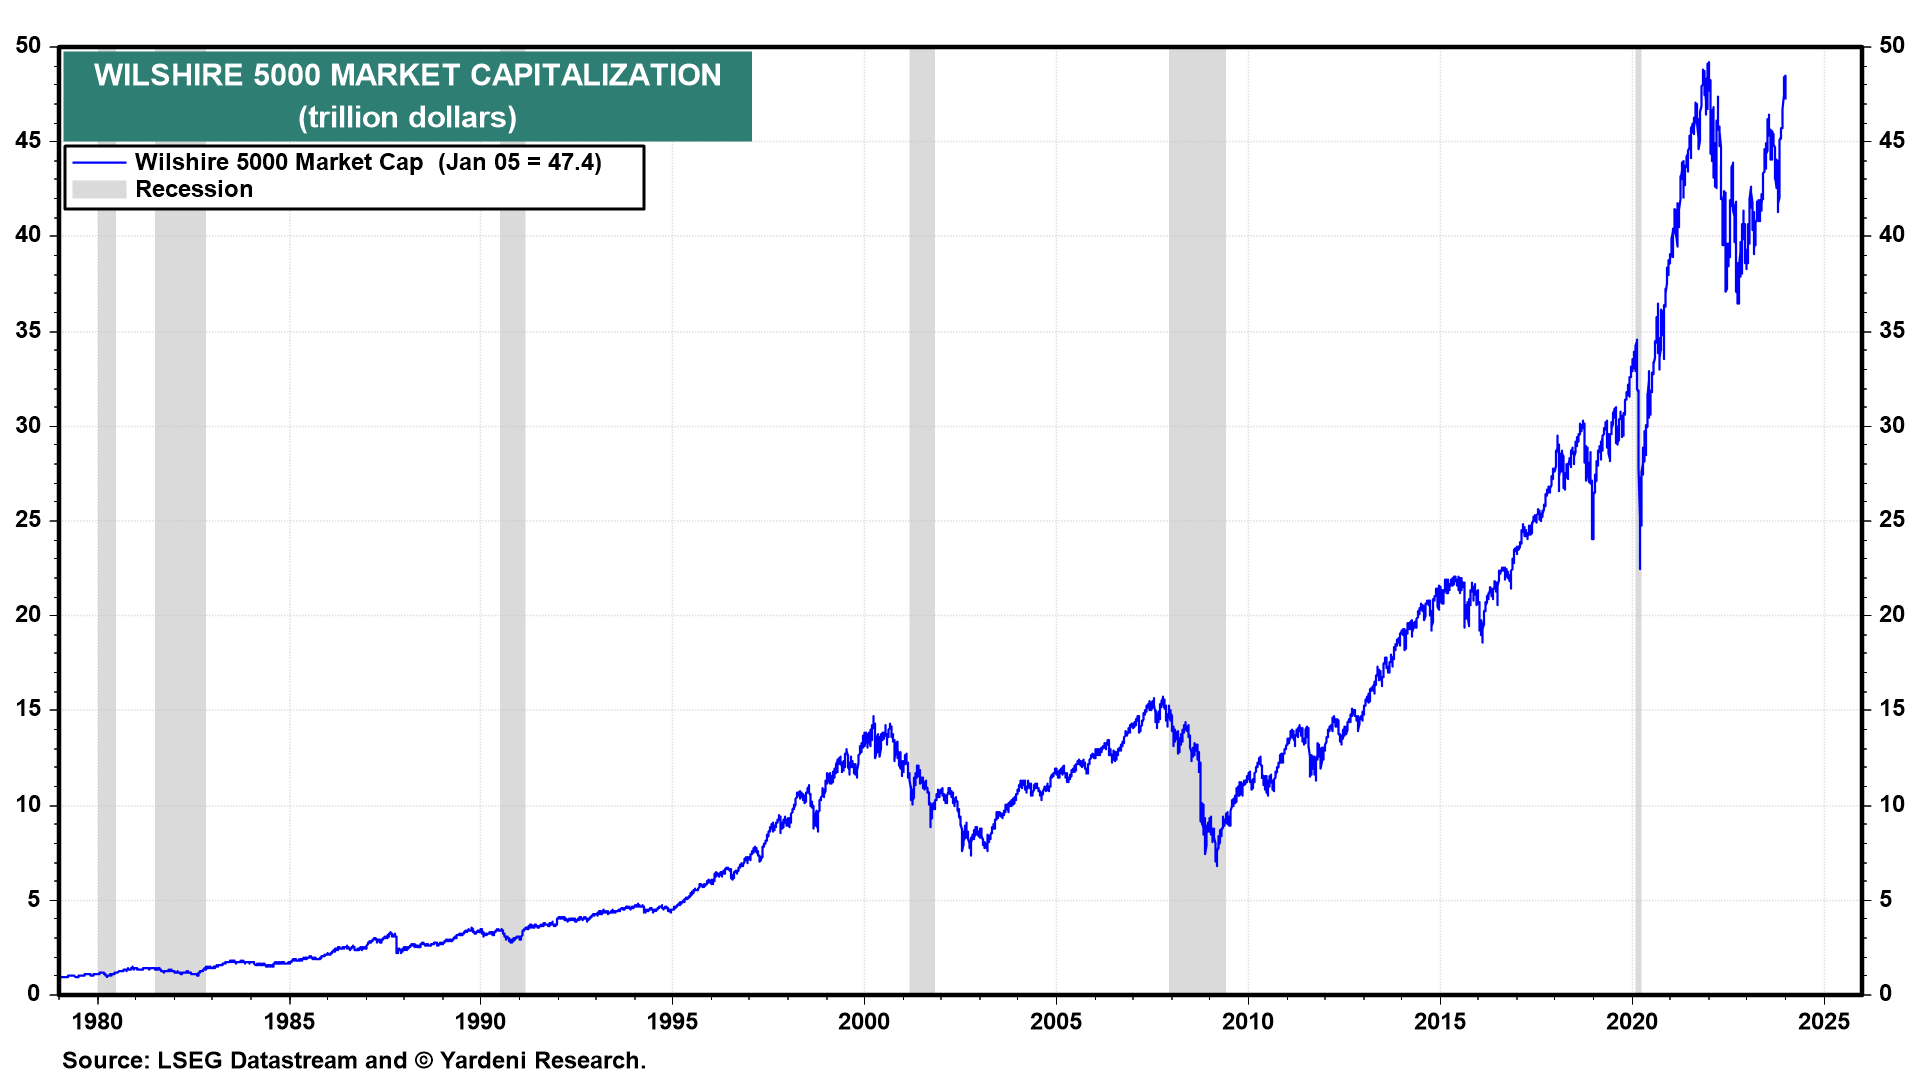
(3/7) Wealth effects. During the 1960s through the 1990s, financial crises invariably were followed by significant rallies in the stock and bond markets (Fig. 7 and Fig. 8). Such rallies have wealth effects that should boost consumer spending. This time, the Wilshire 5000 rose to $47.4 trillion on Friday (Fig. 9 below). That’s up $12.9 trillion since February 20, 2020, just when the pandemic started, and almost matches its record high during January 3, 2022.