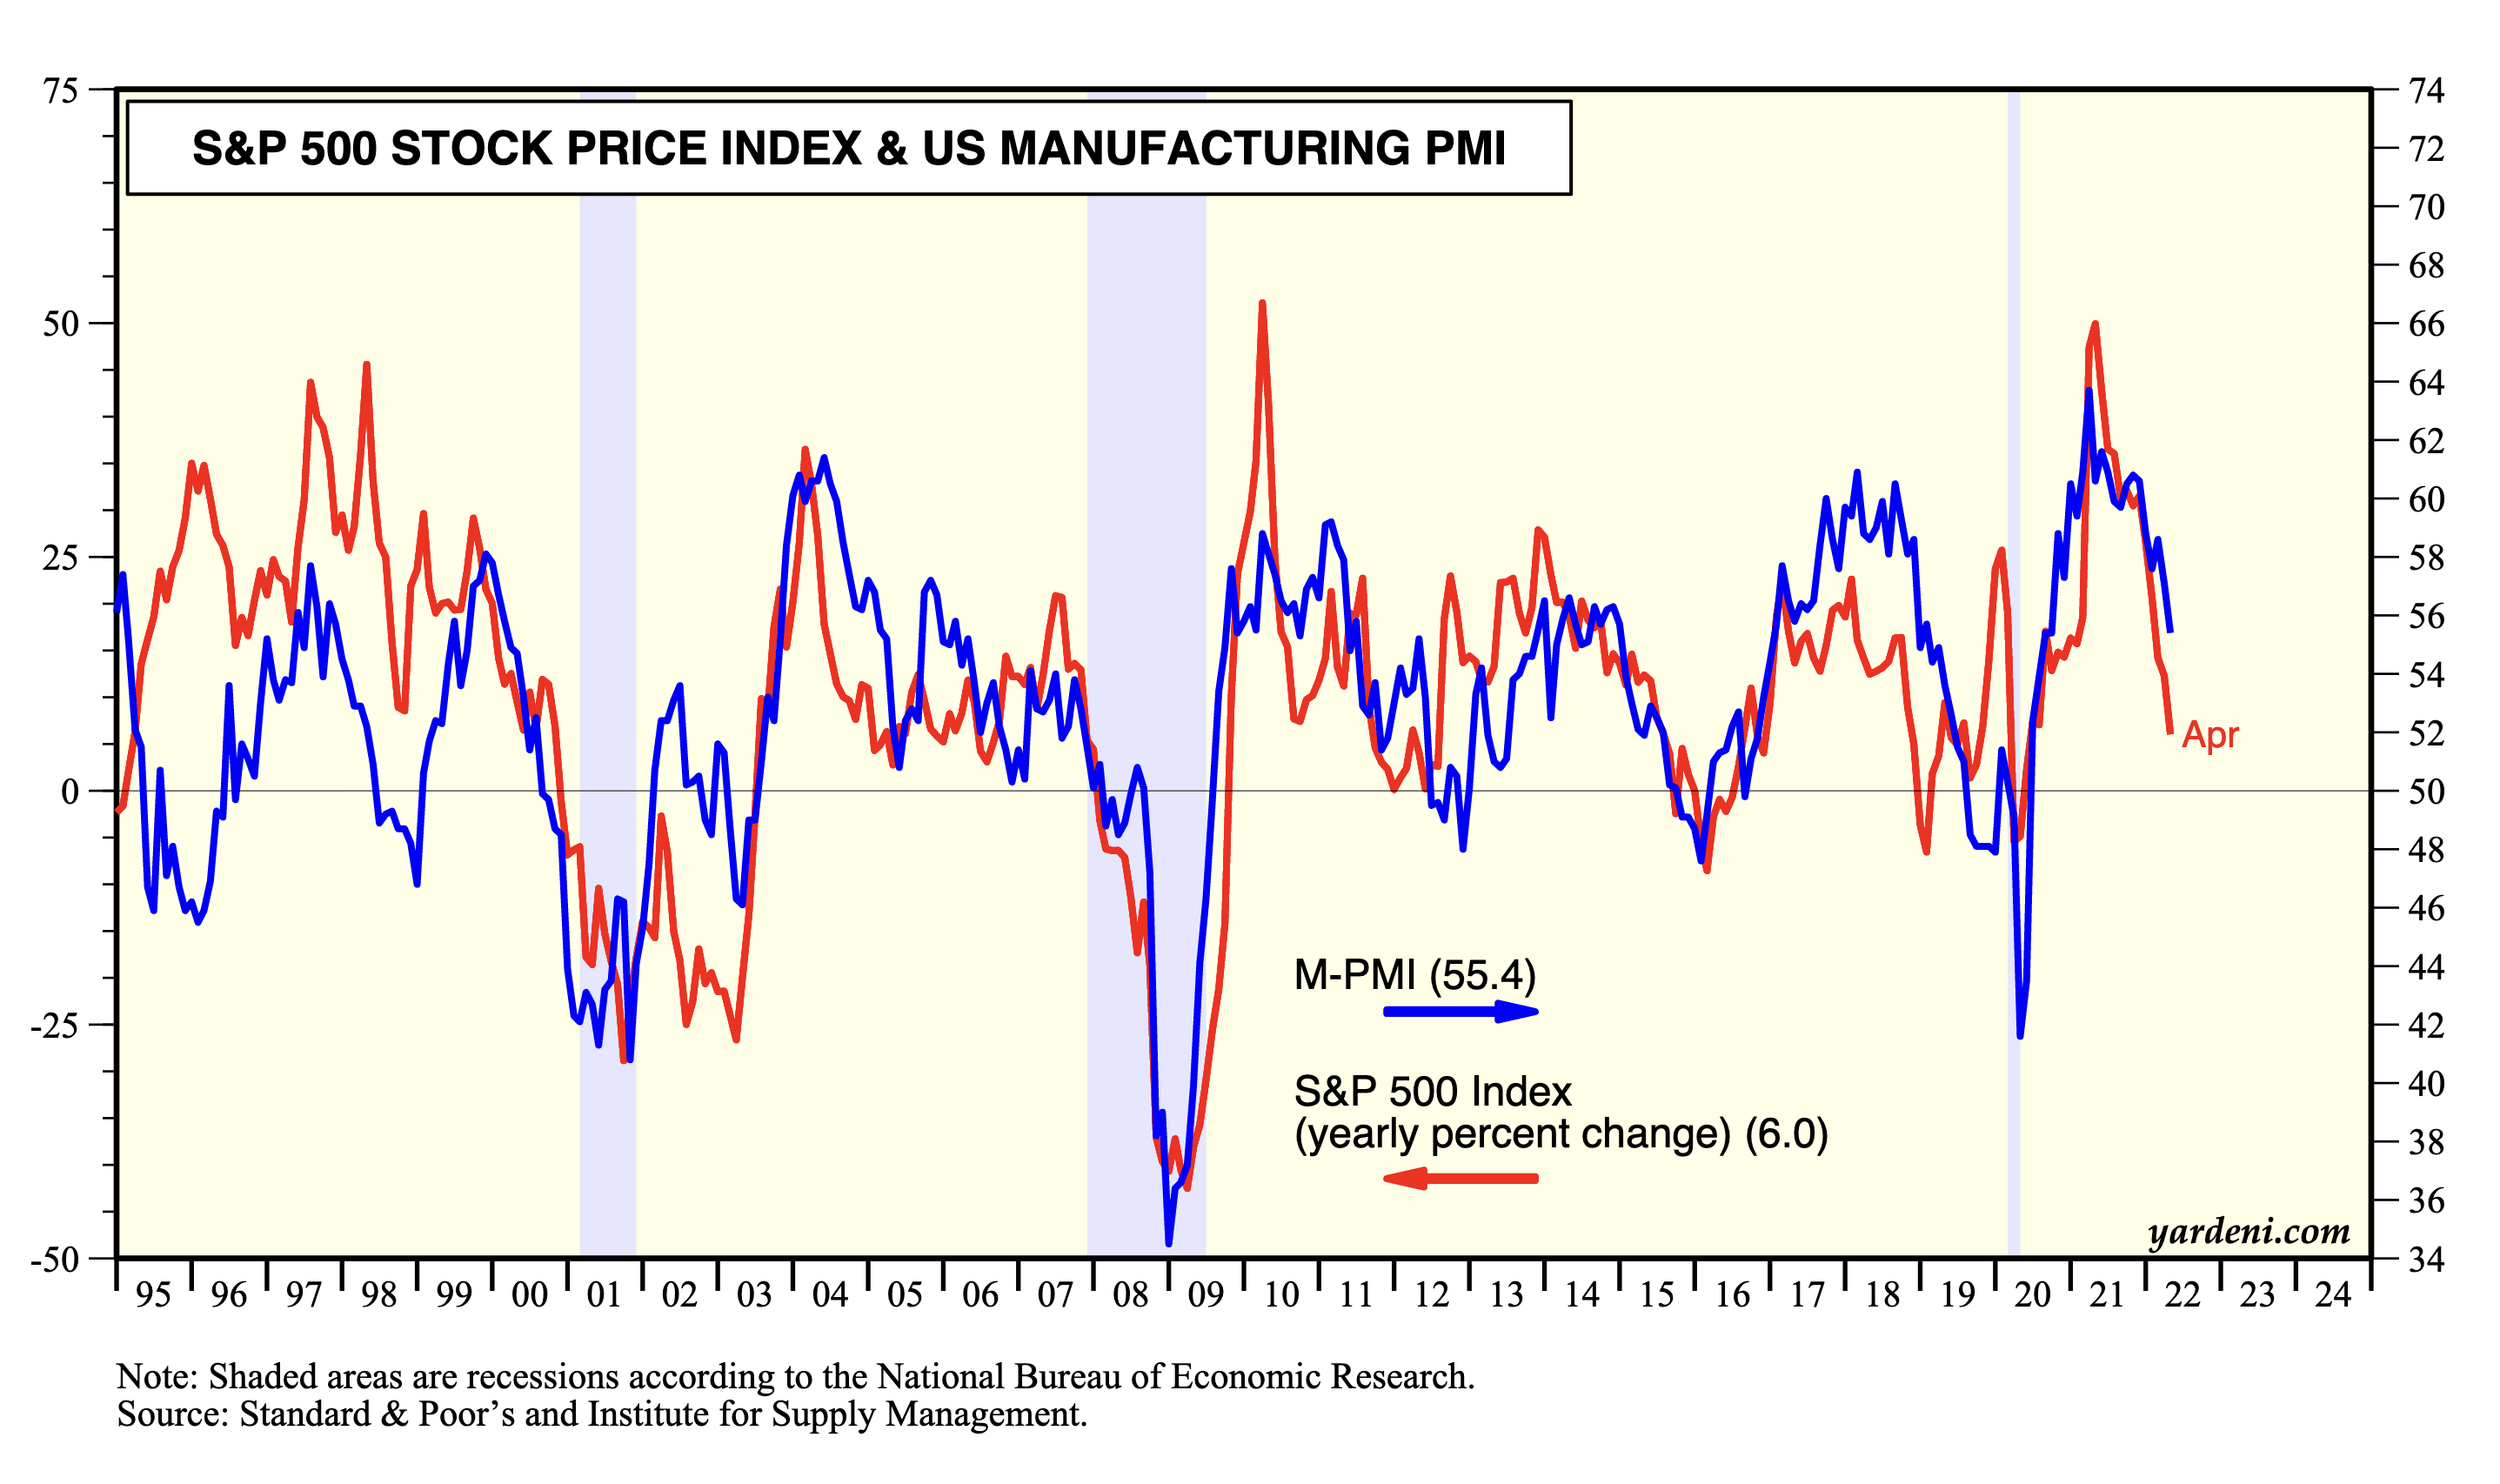
There is a remarkably close fit between the yearly percent change in the S&P 500 stock price index and the national manufacturing purchasing managers index (M-PMI). The latter is available only through April; the reading for May will be released next week, on Wednesday, June 1.
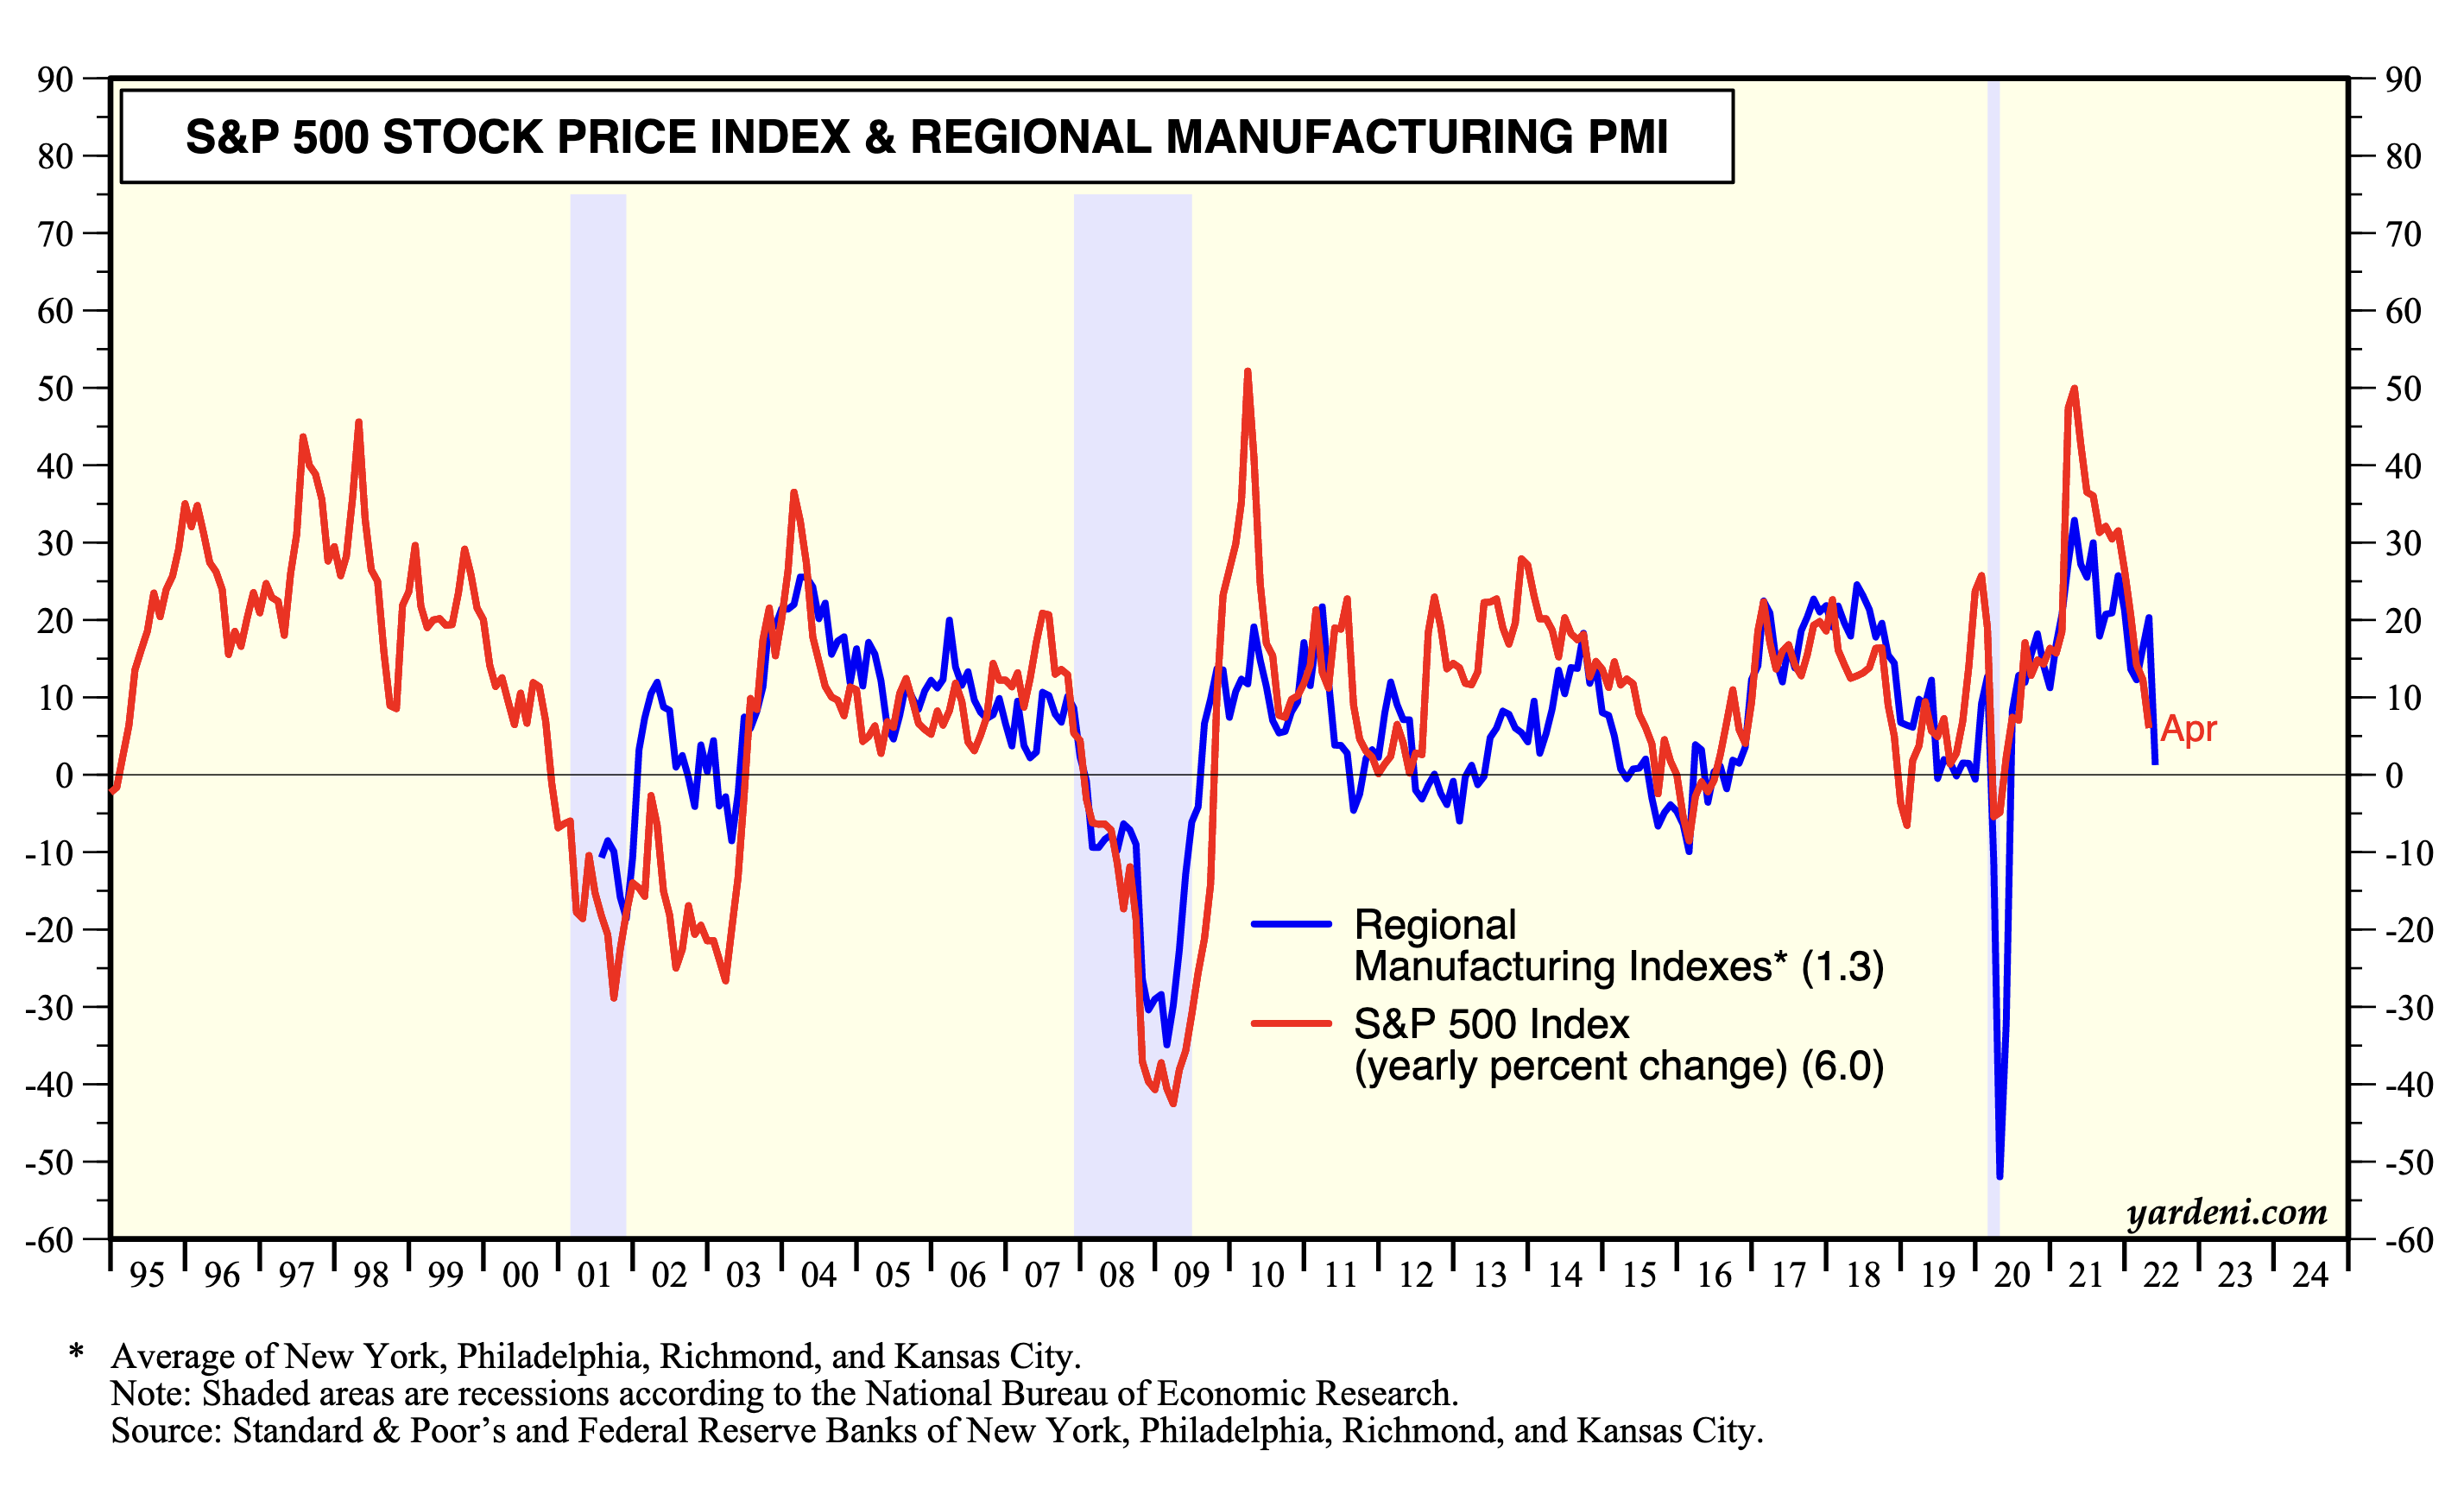
However, the M-PMI is highly correlated with the general business indexes of the regional business surveys compiled by the Federal Reserve Banks of NY, Philly, KC, Richmond, and Dallas. Four of them are available so far for May, and they suggest that the M-PMI—which was 55.4 in April—fell sharply closer to 50.0 in May.
A national M-PMI reading of 50.0 would be associated with the S&P 500 being unchanged from a year ago. Sure enough, a year ago, on May 27, 2021, the S&P 500 was 4201.11. It closed at 4158.24 on Friday.
This interesting relationship suggests that y/y comparisons will turn negative for the S&P 500 if the national and regional composite M-PMIs fall below 50.0 and 0.0, respectively, which could happen in coming months under a recession scenario. For long-term investors, the positive spin is that by next year, the M-PMI cycle should be turning back up again and the S&P 500 should be rising again on a y/y basis too.
Then again, on the near-term bullish side, contradicting May’s drop in the regional business surveys was May’s Markit flash M-PMI, which remained high at 57.5. The S&P 500 may be oversold relative to the economic fundamentals if the final M-PMI confirms the flash reading.
Stay tuned; the suspense is killing us too!